. 2020 Apr 15;15(4):e0231600.
doi: 10.1371/journal.pone.0231600. eCollection 2020.

Disruption of genes associated with Charcot-Marie-Tooth type 2 lead to common behavioural, cellular and molecular defects in Caenorhabditis elegans

Affiliations

Disruption of genes associated with Charcot-Marie-Tooth type 2 lead to common behavioural, cellular and molecular defects in Caenorhabditis elegans

Ming S Soh et al. PLoS One. .

Abstract

Charcot-Marie-Tooth (CMT) disease is an inherited peripheral motor and sensory neuropathy. The disease is divided into demyelinating (CMT1) and axonal (CMT2) neuropathies, and although we have gained molecular information into the details of CMT1 pathology, much less is known about CMT2. Due to its clinical and genetic heterogeneity, coupled with a lack of animal models, common underlying mechanisms remain elusive. In order to gain an understanding of the normal function of genes associated with CMT2, and to draw direct comparisons between them, we have studied the behavioural, cellular and molecular consequences of mutating nine different genes in the nematode Caenorhabditis elegans (lin-41/TRIM2, dyn-1/DNM2, unc-116/KIF5A, fzo-1/MFN2, osm-9/TRPV4, cua-1/ATP7A, hsp-25/HSPB1, hint-1/HINT1, nep-2/MME). We show that C. elegans defective for these genes display debilitated movement in crawling and swimming assays. Severe morphological defects in cholinergic motors neurons are also evident in two of the mutants (dyn-1 and unc-116). Furthermore, we establish methods for quantifying muscle morphology and use these to demonstrate that loss of muscle structure occurs in the majority of mutants studied. Finally, using electrophysiological recordings of neuromuscular junction (NMJ) activity, we uncover reductions in spontaneous postsynaptic current frequency in lin-41, dyn-1, unc-116 and fzo-1 mutants. By comparing the consequences of mutating numerous CMT2-related genes, this study reveals common deficits in muscle structure and function, as well as NMJ signalling when these genes are disrupted.


Conflict of interest statement

The authors have declared that no competing interests exist.

Figures
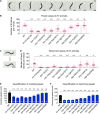
Fig 1
Fig 1. Motility assays in C. elegans mutants.
(A) An animal performing a single thrash in liquid culture. The head begins facing dorsal, moves ventral and then returns to dorsal. Arrows points to direction of the head; time in milliseconds displayed at bottom relative to the first image. Scale bar represents 250 µm. (B) Number of thrashes per minute calculated for 7-day old adult (A7) N2 wild-type (WT) and the nine mutant strains shown. See S1A Fig for thrash assays performed across different ages. (C) An animal undergoing one complete body bend on nematode growth media (NGM) agar. One body bend is defined as the maximum bending of the section behind the pharynx in the opposite direction, from top to bottom picture. Scale bar represents 500 µm. (D) Quantification of number of body bends of WT and CMT2 mutant A7 animals crawling on solid NGM agar. Number of body bends across different ages is included in S1B Fig. Each dot in (B) and (D) represents a single animal (n ≥ 30). (E) The rates of crawling on solid NGM agar and, (F) swimming in M9 liquid for 3-day old adult WT and nine CMT2 mutant worms. The swimming and crawling velocity were calculated using WormLab software; n values are within each bar. One-way ANOVA with Dunnett’s post hoc tests were used to compare swimming and crawling behaviour between WT and mutant animals in (B), (D), (E) and (F). Data is represented as mean ± S.E.M. **P < 0.01, ***P < 0.001, ****P < 0.0001, ns = not significant.
Fig 2
Fig 2. High-throughput analysis of swimming behaviour in animal populations.
(A-C) Activity count graphs from WMicrotracker experiments. Motility of swimming animals (30–50 animals per well, 6 wells per genotype per experiment) was measured over a 3 h period in duplicate runs (n = 12 wells). Locomotor activity was compared between wild-type (WT) animals and the mutant strains indicated. (D) Summary and comparison of the average activity count for individual genotypes. The number of wells analyzed is reported in each bar. Data is represented as mean ± S.E.M. *P < 0.05, ****P < 0.0001, ns = not significant from one-way ANOVA with Dunnett’s post hoc tests; a.u. arbitrary units.
Fig 3
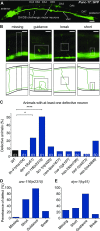
Fig 3. Morphological analysis of cholinergic motor neurons.
(A) Full body image of a 3-day old adult animal carrying the vsIs48(Punc-17::gfp) transgene, which produces GFP expression in all cholinergic neurons. VNC = ventral nerve cord. (B) Images (top) and schematics (bottom) of specific morphological phenotypes: absent commissure (missing), wayward commissure that failed to connect with the dorsal nerve cord (guidance), a gap or break within a commissure (break), and short neurite (short). The phenotypes are highlighted with the dashed boxes. (C) Quantification of morphological defects in WT and CMT2-associated mutant animals. Animals were scored visually for defects. Bar represents percentage of defective animals; n values are shown in each bar. Chi-square test with false discovery rate were performed to compare defects between WT and mutant animals. *P < 0.05, ****P < 0.0001. (D) Proportion of specific morphological defects in unc-116(e2310), and (E) dyn-1(ky51) animals. Scale bar represents 40 µm in (A) and 8 µm in (B).
Fig 4
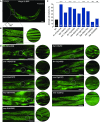
Fig 4. Visual scoring of body wall muscle defects.
(A) A single 3-day old adult animal carrying the stEx30(Pmyo-3::gfp::myo-3 + rol-6(su1006)) transgene, which drives GFP-tagged myosin heavy chain in the body wall muscles. Animals with stEx30 also possess a rolling phenotype that facilitates visualization of muscle cells that flank the dorsal and ventral sections of the body. (B) 90 o rotated and expanded view of muscle area within dashed box in (A). (C) Categorical scoring of 3-day old adult WT and mutant animals, all carrying stEx30, for abnormalities in muscle fibres. Data is represented as the percentage of defective animals; n values are shown in each bar. Defects are compared between WT and CMT2 mutant animals using chi-square analysis with false discovery rate. *P < 0.05, **P < 0.01, ***P < 0.001, ****P < 0.0001, ns = not significant. (D) Representative close-up muscle fibre images of individual CMT2 mutant animals. Scale bar represents 60 µm in (A), and 25 µm in (B) and (D).
Fig 5
Fig 5. Quantification of body wall muscle area and fibre length in 3-day old adults.
(A) Example image of how the muscle area ratio (gap to total cell area) was calculated. Gaps left by degenerating muscle fibres (red-lined area) and the total area of a single muscle cell (yellow-lined area) were drawn and calculated in Fiji using the polygon selection tool. (B) Comparison of gap to total muscle cell area ratio between WT and CMT2 mutants. (C) Measurement of individual fibre length using a combination of Fiji skeletonization and ilastik segmentation. The protocol is illustrated in S4 Fig. Only images with at least one complete visible oblique muscle cell were included for analysis. Fibres that recorded 0 µm or longer than 250 µm were excluded. (D-F) Density plot of muscle fibre length compared between WT and lin-41(ma104), unc-116(e2310), and fzo-1(cjn020). Density plots of other CMT2 mutants can be found in S5 Fig. Bar represents mean ± S.E.M in (B) and (C). Number of animals and fibres analyzed is listed in each bar in (B) and (C), respectively. *P < 0.05, **P < 0.01, ***P < 0.001, ****P < 0.0001, ns = not significant from one-way ANOVA with Dunnett’s post hoc tests for multiple comparison in (B) and (C). F test was used for variance comparison between WT and mutants in (D) to (F), with significance set at P < 0.05. All animals expressed the stEx30 transgene.
Fig 6
Fig 6. Quantification of body contraction in response to levamisole.
(A) Relative change in body length of 3-day old adult wild-type (WT) and mutant animals following the application of different concentrations of levamisole (40 μM or 200 μM). The original and contracted body lengths were measured before levamisole administration and when the animals had been paralyzed by levamisole, respectively. (B) Bar graph of the time taken for the animals to reach full paralysis following the addition of 40 μM or 200 μM levamisole. Bars represent mean ± S.E.M, n values are within each bar. We used one-way ANOVA with Dunnett’s post hoc tests to compare WT and CMT2 mutant animals within each concentration. *P < 0.05, **P < 0.01, ***P < 0.001, ****P < 0.0001, ns = not significant.
Fig 7
Fig 7. Electrophysiological recordings from the neuromuscular junction (NMJ).
(A) Bar graph of the frequency of spontaneous postsynaptic currents (PSCs) recorded from 3-day old adult WT and CMT2 mutant animals. (B) Bar graph of the amplitude of spontaneous PSCs recorded from 3-day old adult WT and CMT2 mutant animals. (C) Sample traces of spontaneous PSCs recorded from ventral cord NMJs of individual worms. All recordings were made at a holding potential of –60 mV. All animals carried the vsIs48 transgene. Bars represent mean ± S.E.M, n values are within each bar in (A) and (B). One-way ANOVA with Dunnett’s post hoc tests were used for comparison between WT and CMT2 mutant animals in (A) and (B). **P < 0.01, ***P < 0.001, ****P < 0.0001, ns = not significant.
Fig 8
Fig 8. Summary of the sites at which mutation of CMT2-associated genes affect cellular function and animal behaviour in C. elegans.
Mutations in dyn-1 and unc-116 led to defects in cholinergic motor neuron morphology, while mutations in lin-41, dyn-1, unc-116, fzo-1, osm-9, cua-1, hsp-25, hint-1 and nep-2 resulted in irregularities in the body wall muscle. Neuromuscular junction dysfunction occurred as a result of lin-41, dyn-1, unc-116 and fzo-1 mutations, whereas lin-41, dyn-1, unc-116, fzo-1, osm-9, cua-1, hsp-25 and nep-2 mutants experienced motility impairments in swimming and/or crawling.

Similar articles

Cited by

References

    1. Barisic N, Claeys KG, Sirotković-Skerlev M, Löfgren A, Nelis E, De Jonghe P, et al. Charcot-Marie-Tooth disease: A clinico-genetic confrontation. Ann Hum Genet. 2007;72(3):416–41. - PubMed
    1. Barreto LCLS, Oliveira FS, Nunes PS, de França Costa IM, Garcez CA, Goes GM, et al. Epidemiologic study of Charcot-Marie Tooth disease: A systematic review. Neuroepidemiology. 2016;46(3):157–65. 10.1159/000443706 - DOI - PubMed
    1. Reilly MM, Murphy SM, Laurá M. Charcot‐Marie‐Tooth disease. J Peripher Nerv Syst. 2011;16(1):1–14. 10.1111/j.1529-8027.2011.00324.x - DOI - PubMed
    1. d’Ydewalle C, Benoy V, Van Den Bosch L. Charcot-Marie-Tooth disease: Emerging mechanisms and therapies. Int J Biochem Cell Biol. 2012;44:1299–304. 10.1016/j.biocel.2012.04.020 - DOI - PubMed
    1. Shy ME, Patzkó Á. Axonal Charcot–Marie–Tooth disease. Curr Opin Neurol. 2011;24:475–83. 10.1097/WCO.0b013e32834aa331 - DOI - PubMed

Publication types

MeSH terms

Substances