Characterization of the chromatin accessibility in an Alzheimer's disease (AD) mouse model
- PMID: 32293531
- PMCID: PMC7092509
- DOI: 10.1186/s13195-020-00598-2
Characterization of the chromatin accessibility in an Alzheimer's disease (AD) mouse model
Abstract
Background: The pathological hallmarks of Alzheimer's disease (AD) involve alterations in the expression of numerous genes associated with transcriptional levels, which are determined by chromatin accessibility. Here, the landscape of chromatin accessibility was studied to understand the outline of the transcription and expression of AD-associated metabolism genes in an AD mouse model.
Methods: The assay for transposase-accessible chromatin by sequencing (ATAC-seq) was used to investigate the AD-associated chromatin reshaping in the APPswe/PS1dE9 (APP/PS1) mouse model. ATAC-seq data in the hippocampus of 8-month-old APP/PS1 mice were generated, and the relationship between chromatin accessibility and gene expression was analyzed in combination with RNA sequencing. Gene ontology (GO) analysis was applied to elucidate biological processes and signaling pathways altered in APP/PS1 mice. Critical transcription factors were identified; alterations in chromatin accessibility were further confirmed using chromatin immunoprecipitation assays.
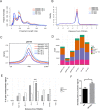
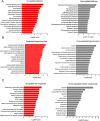
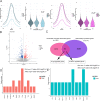
Results: We identified 1690 increased AD-associated chromatin-accessible regions in the hippocampal tissues of APP/PS1 mice. These regions were enriched in genes related to diverse signaling pathways, including the PI3K-Akt, Hippo, TGF-β, and Jak-Stat signaling pathways, which play essential roles in regulating cell proliferation, apoptosis, and inflammatory responses. A total of 1003 decreased chromatin-accessible regions were considered to be related with declined AD-associated biological processes including cellular response to hyperoxia and insulin stimulus, synaptic transmission, and positive regulation of autophagy. In the APP/PS1 hippocampus, 1090 genes were found to be upregulated and 1081 downregulated. Interestingly, enhanced ATAC-seq signal was found in approximately 740 genes, with 43 exhibiting upregulated mRNA levels. Several genes involved in AD development were found to have a significantly increased expression in APP/PS1 mice compared to controls, including Sele, Clec7a, Cst7, and Ccr6. The signatures of numerous transcription factors, including Olig2, NeuroD1, TCF4, and NeuroG2, were found enriched in the AD-associated accessible chromatin regions. The transcription-activating marks of H3K4me3 and H3K27ac were also found increased in the promoters of these genes. These results indicate that the mechanism for the upregulation of genes could be attributed to the enrichment of open chromatin regions with transcription factors motifs and the histone marks H3K4me3 and H3K27ac.
Conclusion: Our study reveals that alterations in chromatin accessibility may be an initial mechanism in AD pathogenesis.
Keywords: ATAC-seq; Alzheimer’s disease; Chromatin accessibility; RNA-seq; Transcription factors.
Conflict of interest statement
The authors declare that they have no competing interests.
Figures


Similar articles
-
Early alterations in energy metabolism in the hippocampus of APPswe/PS1dE9 mouse model of Alzheimer's disease.Biochim Biophys Acta. 2014 Sep;1842(9):1556-66. doi: 10.1016/j.bbadis.2014.05.025. Epub 2014 Jun 2. Biochim Biophys Acta. 2014. PMID: 24887203
-
[Moxibustion at acpoints of governor vessel on regulating PI3K/Akt/mTOR signaling pathway and enhancing autophagy process in APP/PS1 double-transgenic Alzheimer's disease mice].Zhongguo Zhen Jiu. 2019 Dec 12;39(12):1313-8. doi: 10.13703/j.0255-2930.2019.12.015. Zhongguo Zhen Jiu. 2019. PMID: 31820607 Chinese.
-
[Moxibustion improves learning-memory ability by promoting cellular autophagy and regulating autophagy-related proteins in hippocampus and cerebral cortex in APP/PS1 transgenic Alzheimer's disease mice].Zhen Ci Yan Jiu. 2019 Apr 25;44(4):235-41. doi: 10.13702/j.1000-0607.180305. Zhen Ci Yan Jiu. 2019. PMID: 31056874 Chinese.
-
Detect accessible chromatin using ATAC-sequencing, from principle to applications.Hereditas. 2019 Aug 15;156:29. doi: 10.1186/s41065-019-0105-9. eCollection 2019. Hereditas. 2019. PMID: 31427911 Free PMC article. Review.
-
Guidelines for bioinformatics of single-cell sequencing data analysis in Alzheimer's disease: review, recommendation, implementation and application.Mol Neurodegener. 2022 Mar 2;17(1):17. doi: 10.1186/s13024-022-00517-z. Mol Neurodegener. 2022. PMID: 35236372 Free PMC article. Review.
Cited by
-
A Set of Dysregulated Target Genes to Reduce Neuroinflammation at Molecular Level.Int J Mol Sci. 2022 Jun 28;23(13):7175. doi: 10.3390/ijms23137175. Int J Mol Sci. 2022. PMID: 35806178 Free PMC article.
-
Immune-related signature of periodontitis and Alzheimer's disease linkage.Front Genet. 2023 Oct 2;14:1230245. doi: 10.3389/fgene.2023.1230245. eCollection 2023. Front Genet. 2023. PMID: 37849501 Free PMC article.
-
Cystatin F acts as a mediator of immune suppression in glioblastoma.Cell Oncol (Dordr). 2021 Oct;44(5):1051-1063. doi: 10.1007/s13402-021-00618-9. Epub 2021 Jun 29. Cell Oncol (Dordr). 2021. PMID: 34189679
-
Role of primary aging hallmarks in Alzheimer´s disease.Theranostics. 2023 Jan 1;13(1):197-230. doi: 10.7150/thno.79535. eCollection 2023. Theranostics. 2023. PMID: 36593969 Free PMC article. Review.
-
CCL20/CCR6 axis mediates macrophages to promote proliferation and migration of ESCs by blocking autophagic flux in endometriosis.Stem Cell Res Ther. 2022 Jul 15;13(1):294. doi: 10.1186/s13287-022-02981-2. Stem Cell Res Ther. 2022. PMID: 35841069 Free PMC article.
References
-
- Stozicka Z, Zilka N, Novak M. Risk and protective factors for sporadic Alzheimer’s disease. Acta Virol. 2007;51(4):205–222. - PubMed
Publication types
MeSH terms
Substances
LinkOut - more resources
Full Text Sources
Medical
Molecular Biology Databases

