

Single-Cell Probe Force Studies to Identify Sox2 Overexpression-Promoted Cell Adhesion in MCF7 Breast Cancer Cells
- PMID: 32290242
- PMCID: PMC7227807
- DOI: 10.3390/cells9040935
Single-Cell Probe Force Studies to Identify Sox2 Overexpression-Promoted Cell Adhesion in MCF7 Breast Cancer Cells
Abstract
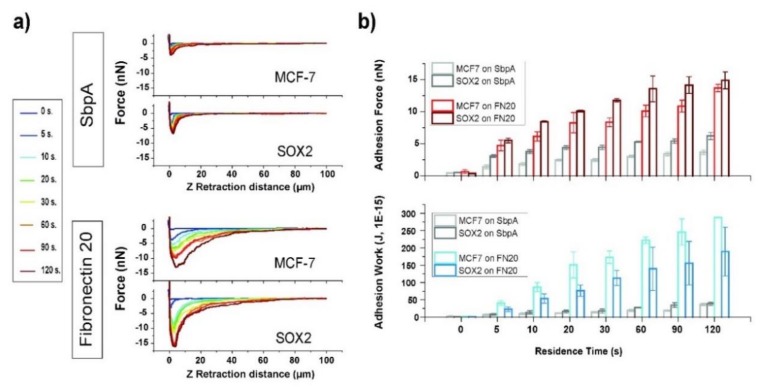
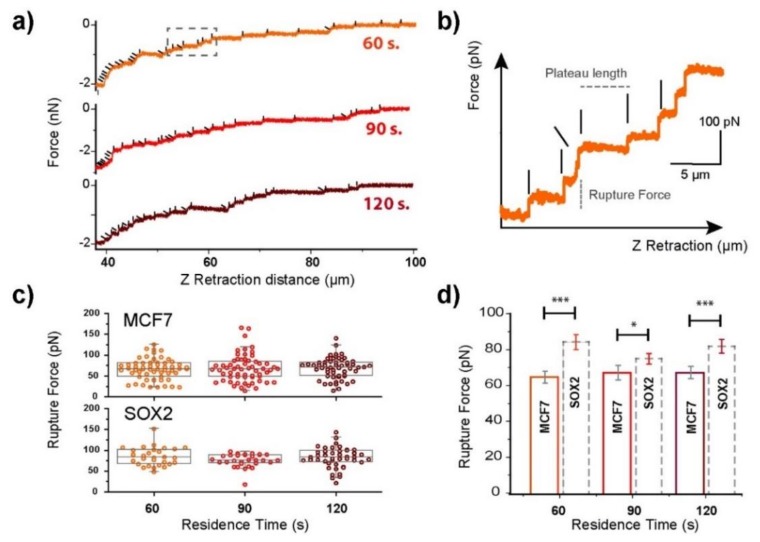
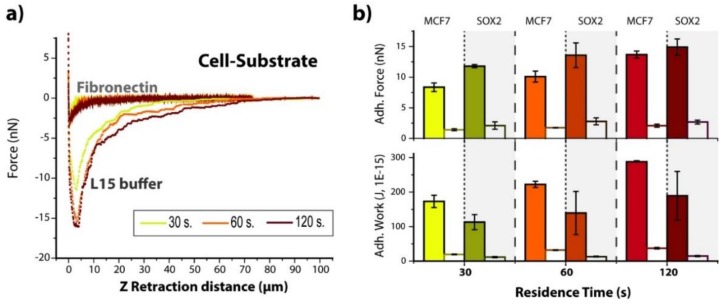
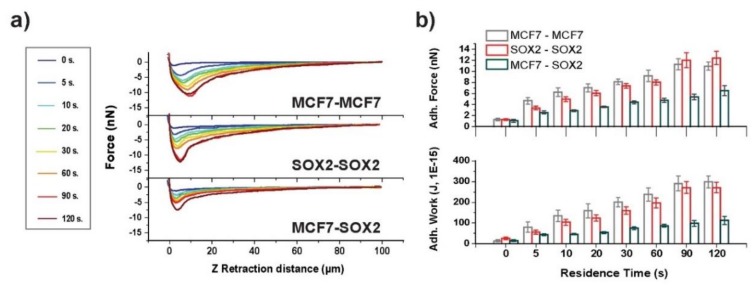
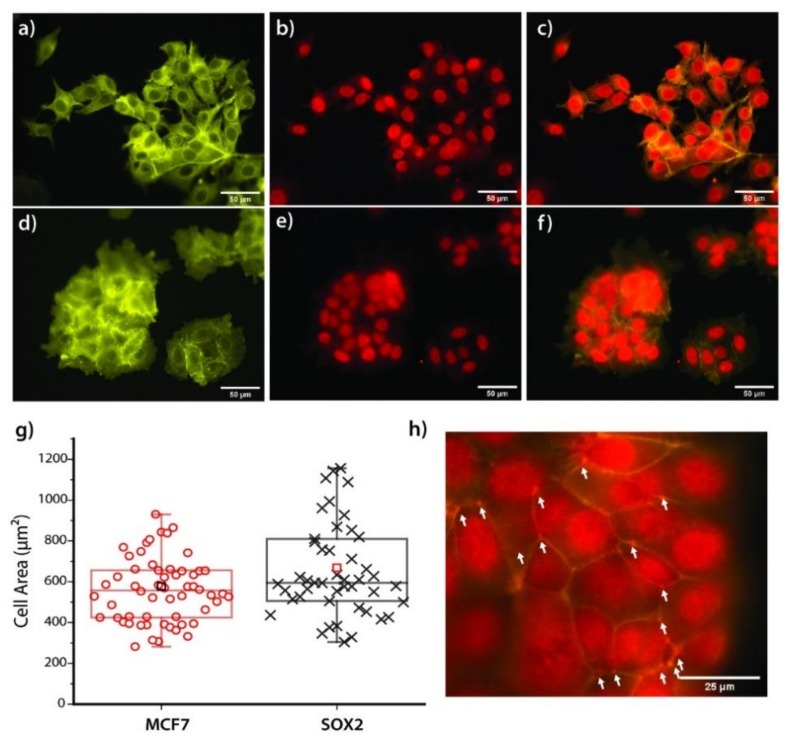
The replacement of the cantilever tip by a living cell in Atomic Force Microscopy (AFM) experiments permits the direct quantification of cell-substrate and cell-cell adhesion forces. This single-cell probe force measurement technique, when complemented by microscopy, allows controlled manipulation of the cell with defined location at the area of interest. In this work, a setup based on two glass half-slides, a non-fouling one with bacterial S-layer protein SbpA from L. sphaericus CMM 2177 and the second with a fibronectin layer, has been employed to measure the adhesion of MCF7 breast cancer cells to fibronectin films (using SbpA as control) and to other cells (symmetric vs. asymmetric systems). The measurements aimed to characterize and compare the adhesion capacities of parental cells and cells overexpressing the embryonic transcription factor Sox2, which have a higher capacity for invasion and are more resistant to endocrine therapy in vivo. Together with the use of fluorescence techniques (epifluorescence, Total Internal Fluorescence Microscopy (TIRF)), the visualization of vinculin and actin distribution in cells in contact with fibronectin surfaces is enabled, facilitating the monitoring and quantification of the formation of adhesion complexes. These findings demonstrate the strength of this combined approach to assess and compare the adhesion properties of cell lines and to illustrate the heterogeneity of adhesive strength found in breast cancer cells.
Keywords: AFM; MCF7 cells; Sox2 overexpression; TIRF; cell adhesion; epifluorescence; single-cell probe.
Conflict of interest statement
The authors declare no conflict of interest. The funders had no role in the design of the study; in the collection, analyses, or interpretation of data; in the writing of the manuscript, or in the decision to publish the results.
Figures


Similar articles
-
Investigating cell-substrate and cell-cell interactions by means of single-cell-probe force spectroscopy.Microsc Res Tech. 2017 Jan;80(1):124-130. doi: 10.1002/jemt.22706. Epub 2016 Jun 25. Microsc Res Tech. 2017. PMID: 27341785
-
Applications of Atomic Force Microscopy for Adhesion Force Measurements in Mechanotransduction.Methods Mol Biol. 2018;1814:515-528. doi: 10.1007/978-1-4939-8591-3_30. Methods Mol Biol. 2018. PMID: 29956252
-
Characterization of the adhesive mucilages secreted by live diatom cells using atomic force microscopy.Protist. 2002 Mar;153(1):25-38. doi: 10.1078/1434-4610-00080. Protist. 2002. PMID: 12022272
-
Extending applications of AFM to fluidic AFM in single living cell studies.J Cell Physiol. 2022 Aug;237(8):3222-3238. doi: 10.1002/jcp.30809. Epub 2022 Jun 13. J Cell Physiol. 2022. PMID: 35696489 Free PMC article. Review.
-
Single-cell force spectroscopy.J Cell Sci. 2008 Jun 1;121(11):1785-91. doi: 10.1242/jcs.030999. J Cell Sci. 2008. PMID: 18492792 Review.
Cited by
-
Characterization of Breast Cancer Aggressiveness by Cell Mechanics.Int J Mol Sci. 2023 Jul 30;24(15):12208. doi: 10.3390/ijms241512208. Int J Mol Sci. 2023. PMID: 37569585 Free PMC article.
-
Insights in Cell Biomechanics through Atomic Force Microscopy.Materials (Basel). 2023 Apr 9;16(8):2980. doi: 10.3390/ma16082980. Materials (Basel). 2023. PMID: 37109816 Free PMC article. Review.
-
Laser-Assisted Direct Grafting of Poly(ethyleneimine) on Poly(methyl methacrylate).Polymers (Basel). 2022 May 17;14(10):2041. doi: 10.3390/polym14102041. Polymers (Basel). 2022. PMID: 35631923 Free PMC article.
-
miR-301 regulates the SIRT1/SOX2 pathway via CPEB1 in the breast cancer progression.Mol Ther Oncolytics. 2021 Mar 13;22:13-26. doi: 10.1016/j.omto.2021.03.007. eCollection 2021 Sep 24. Mol Ther Oncolytics. 2021. PMID: 34377766 Free PMC article.
-
Transcriptome-wide analysis of the differences between MCF7 cells cultured in DMEM or αMEM.PLoS One. 2024 Mar 28;19(3):e0298262. doi: 10.1371/journal.pone.0298262. eCollection 2024. PLoS One. 2024. PMID: 38547234 Free PMC article.
References
Publication types
MeSH terms
Substances
Grants and funding
LinkOut - more resources
Full Text Sources
Medical
Miscellaneous
