

Clustering model for transmission of the SARS virus: application to epidemic control and risk assessment
- PMID: 32288075
- PMCID: PMC7126158
- DOI: 10.1016/j.physa.2005.01.009
Clustering model for transmission of the SARS virus: application to epidemic control and risk assessment
Abstract
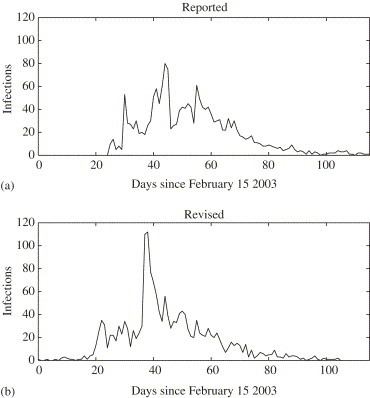
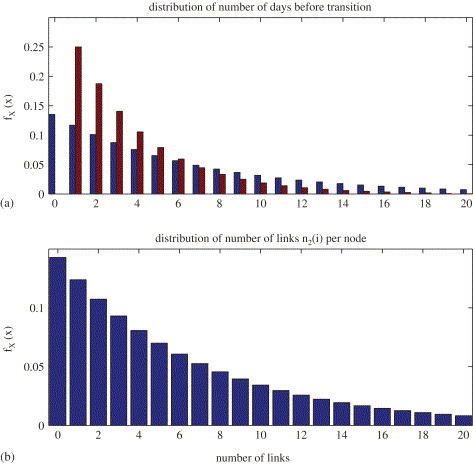
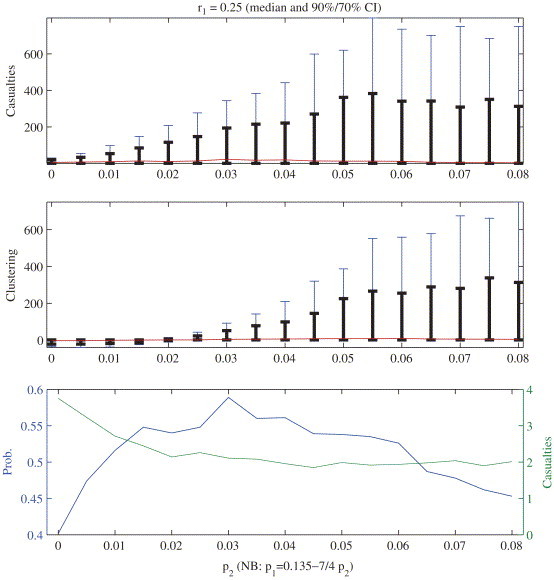
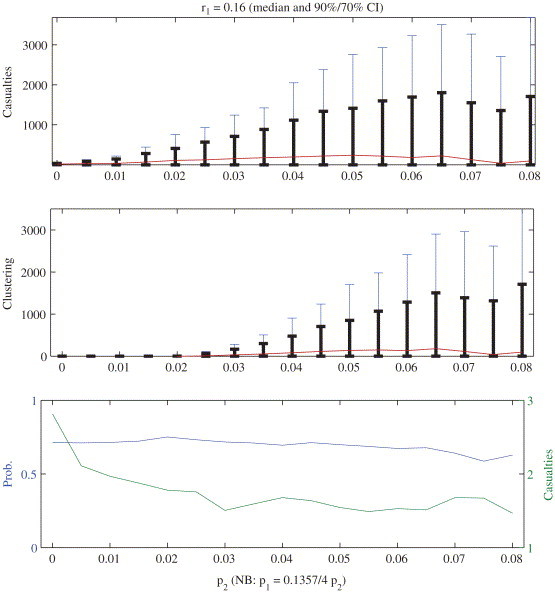
We propose a new four state model for disease transmission and illustrate the model with data from the 2003 SARS epidemic in Hong Kong. The critical feature of this model is that the community is modelled as a small-world network of interconnected nodes. Each node is linked to a fixed number of immediate neighbors and a random number of geographically remote nodes. Transmission can only propagate between linked nodes. This model exhibits two features typical of SARS transmission: geographically localized outbreaks and "super-spreaders". Neither of these features are evident in standard susceptible-infected-removed models of disease transmission. Our analysis indicates that "super-spreaders" may occur even if the infectiousness of all infected individuals is constant. Moreover, we find that nosocomial transmission in Hong Kong directly contributed to the severity of the outbreak and that by limiting individual exposure time to 3-5 days the extent of the SARS epidemic would have been minimal.
Keywords: Disease transmission; Epidemiological methods; Nonlinear dynamics; Severe acute respiratory syndrome; Small world networks.
Copyright © 2005 Elsevier B.V. All rights reserved.
Figures

Similar articles
-
Super-spreaders and the rate of transmission of the SARS virus.Physica D. 2006 Mar 15;215(2):146-158. doi: 10.1016/j.physd.2006.01.021. Epub 2006 Mar 10. Physica D. 2006. PMID: 32287555 Free PMC article.
-
The epidemiology of severe acute respiratory syndrome in the 2003 Hong Kong epidemic: an analysis of all 1755 patients.Ann Intern Med. 2004 Nov 2;141(9):662-73. doi: 10.7326/0003-4819-141-9-200411020-00006. Ann Intern Med. 2004. PMID: 15520422
-
A tale of two cities: community psychobehavioral surveillance and related impact on outbreak control in Hong Kong and Singapore during the severe acute respiratory syndrome epidemic.Infect Control Hosp Epidemiol. 2004 Dec;25(12):1033-41. doi: 10.1086/502340. Infect Control Hosp Epidemiol. 2004. PMID: 15636289
-
The SARS epidemic in Hong Kong--a human calamity in the 21st century.Methods Inf Med. 2005;44(2):293-8. Methods Inf Med. 2005. PMID: 15924195
-
The epidemiology of the outbreak of severe acute respiratory syndrome (SARS) in Hong Kong--what we do know and what we don't.Epidemiol Infect. 2004 Oct;132(5):781-6. doi: 10.1017/s0950268804002614. Epidemiol Infect. 2004. PMID: 15473139 Free PMC article. Review.
Cited by
-
Prediction of COVID-19 spreading profiles in South Korea, Italy and Iran by data-driven coding.PLoS One. 2020 Jul 6;15(7):e0234763. doi: 10.1371/journal.pone.0234763. eCollection 2020. PLoS One. 2020. PMID: 32628673 Free PMC article.
-
Congruent epidemic models for unstructured and structured populations: analytical reconstruction of a 2003 SARS outbreak.Math Biosci. 2006 Oct;203(2):171-203. doi: 10.1016/j.mbs.2006.05.004. Epub 2006 Jun 9. Math Biosci. 2006. PMID: 16904134 Free PMC article.
-
Applications of Machine Learning (ML) and Mathematical Modeling (MM) in Healthcare with Special Focus on Cancer Prognosis and Anticancer Therapy: Current Status and Challenges.Pharmaceutics. 2024 Feb 9;16(2):260. doi: 10.3390/pharmaceutics16020260. Pharmaceutics. 2024. PMID: 38399314 Free PMC article. Review.
-
A review of mathematical modeling, artificial intelligence and datasets used in the study, prediction and management of COVID-19.Appl Intell (Dordr). 2020;50(11):3913-3925. doi: 10.1007/s10489-020-01770-9. Epub 2020 Jul 6. Appl Intell (Dordr). 2020. PMID: 34764546 Free PMC article.
-
Data-driven methods for present and future pandemics: Monitoring, modelling and managing.Annu Rev Control. 2021;52:448-464. doi: 10.1016/j.arcontrol.2021.05.003. Epub 2021 Jun 29. Annu Rev Control. 2021. PMID: 34220287 Free PMC article. Review.
References
-
- Severe Acute Respiratory Syndrome Expert Committee, Report of the severe acute respiratory syndrome expert committee, Technical report, Hong Kong Department of Health, 2 October 2003. http://www.sars-expertcom.gov.hk/english/reports/ report.html.
-
- Riley S. Transmission dynamics of the etiological agent of SARS in Hong Kong: impact of public health interventions. Science. 2003;300:1961–1966. - PubMed
-
- C.A. Donnelly, et al., Epidemiological determinants of spread of causal agent of severe acute respiratory syndrome in Hong Kong, Lancet (2003) http://image.thelancet.com/extras/03art4453web.pdf. - PMC - PubMed
LinkOut - more resources
Full Text Sources
Miscellaneous