. 2020 Apr;52(4):643-657.
doi: 10.1038/s12276-020-0416-y. Epub 2020 Apr 13.

The cGAS/STING/TBK1/IRF3 innate immunity pathway maintains chromosomal stability through regulation of p21 levels

Affiliations

The cGAS/STING/TBK1/IRF3 innate immunity pathway maintains chromosomal stability through regulation of p21 levels

Abdul Basit et al. Exp Mol Med. 2020 Apr.

Abstract

Chromosomal instability (CIN) in cancer cells has been reported to activate the cGAS-STING innate immunity pathway via micronuclei formation, thus affecting tumor immunity and tumor progression. However, adverse effects of the cGAS/STING pathway as they relate to CIN have not yet been investigated. We addressed this issue using knockdown and add-back approaches to analyze each component of the cGAS/STING/TBK1/IRF3 pathway, and we monitored the extent of CIN by measuring micronuclei formation after release from nocodazole-induced mitotic arrest. Interestingly, knockdown of cGAS (cyclic GMP-AMP synthase) along with induction of mitotic arrest in HeLa and U2OS cancer cells clearly resulted in increased micronuclei formation and chromosome missegregation. Knockdown of STING (stimulator of interferon genes), TBK1 (TANK-binding kinase-1), or IRF3 (interferon regulatory factor-3) also resulted in increased micronuclei formation. Moreover, transfection with cGAMP, the product of cGAS enzymatic activity, as well as add-back of cGAS WT (but not catalytic-dead mutant cGAS), or WT or constitutively active STING (but not an inactive STING mutant) rescued the micronuclei phenotype, demonstrating that all components of the cGAS/STING/TBK1/IRF3 pathway play a role in preventing CIN. Moreover, p21 levels were decreased in cGAS-, STING-, TBK1-, and IRF3-knockdown cells, which was accompanied by the precocious G2/M transition of cells and the enhanced micronuclei phenotype. Overexpression of p21 or inhibition of CDK1 in cGAS-depleted cells reduced micronuclei formation and abrogated the precocious G2/M transition, indicating that the decrease in p21 and the subsequent precocious G2/M transition is the main mechanism underlying the induction of CIN through disruption of cGAS/STING signaling.


Conflict of interest statement

The authors declare that they have no conflict of interest.

Figures

Fig. 1
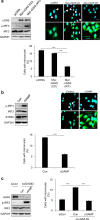
Fig. 1. cGAS prevents the formation of micronuclei.
a Generalized experimental scheme utilized to identify the role of the cGAS–STING pathway in the induction of chromosomal instability. b Thirty hours after transfection with the cGAS siRNA, nocodazole treatment (100 ng/mL) commenced for 16 h. The mitotic cell fraction was obtained by shaking the plate, and the cells were reseeded on a coverslip; the remaining cells were subjected to western blotting with the indicated antibodies (top panel). Quantification of the percentage of micronucleated cells was performed by immunocytochemistry (bottom panel) along with representative fluorescent images showing micronuclei (white arrowhead denotes micronuclei). The results are given as the mean ± SD from three independent experiments (n = 300). ***P < 0.001 as assessed by Student’s t-test. c Wild-type HeLa and cGAS−/− HeLa cells were treated with 100 ng/mL nocodazole for 16 h. Mitotic cells were collected by shaking the plate, and they were then subjected to western blotting (top panel) and immunocytochemical analysis (bottom panel) to quantify micronucleated cells; representative fluorescent images of micronuclei (white arrowhead denotes micronuclei) are shown. The results are given as the mean ± SD from three independent experiments (n = 300). ***P < 0.001 as assessed by Student’s t-test. d Cells were co-transfection of sicGAS with a control vector or MYC-cGAS (non-targeting siRNA) in HeLa cells for 20 h, and then they were arrested at prometaphase by nocodazole treatment for 16 h. Western blotting with the indicated antibodies was performed to confirm cGAS knockdown and cGAS add-back (top panel). Immunocytochemistry was performed to evaluate micronucleated cells 10 h after release from nocodazole-induced mitotic arrest (bottom panel); representative fluorescent images show micronuclei (white arrowhead denotes micronuclei). The results are given as the mean ± SD from three independent experiments (n = 300). ***P < 0.001 as assessed by Student’s t-test. e Transfection of the MYC-cGAS plasmid into cGAS−/− HeLa cells for 12 h before the treatment with nocodazole for 16 h. Mitotic cells were collected, reseeded, and cultured for 10 h to quantify the number of cells containing micronuclei by immunocytochemistry (bottom panel); representative fluorescent images show micronuclei (white arrowhead denotes micronuclei), and their cell lysates were used for western blotting with the indicated antibodies (top panel). The results are given as the mean ± SD from three independent experiments (n = 300). ***P < 0.001 as assessed by Student’s t-test. f U2OS cells were transfected with sicGAS for 30 h after pretreatment with nocodazole for 16 h. Mitotic cells were subjected to western blotting to determine cGAS and GAPDH (loading control) protein levels (top panel) as well as ICC to enumerate the percentage of cells with micronuclei (bottom panel); representative fluorescent images show micronuclei (white arrowhead denotes micronuclei). The results are given as the mean ± SD from three independent experiments (n = 300). ***P < 0.001 as assessed by Student’s t-test.
Fig. 2
Fig. 2. cGAS is essential to regulate proper chromosomal segregations.
a Representative confocal images of mitotic cells 1 h after release from nocodazole-induced mitotic arrest. Cells showing bipolar division, multipolar division, lagging chromosome, and a chromatin bridge (from left to right). b Thirty hours after transfection with sicGAS, mitotic cells were collected by shaking the plate, and they were then treated for 16 h with nocodazole and seeded on a PLL-coated coverslip. After 1 h, cells were fixed with 100% ice-chilled methanol, and ICC was performed. Cells showing the indicated chromosomal segregation errors were calculated as percentages. The results are given as the mean ± SD from three independent experiments (n = 300). ***P < 0.001 as assessed by Student’s t-test. c Co-transfection of sicGAS with pcDNA or MYC-cGAS (non-targeting siRNA) in HeLa cells for 20 h before beginning treatment with nocodazole, which lasted for 16 h. Cells arrested in mitosis were collected and reseeded on PLL-coated coverslips. After 1 h, the percentage of micronucleated cells was quantified using ICC. The results are given as the mean ± SD from three independent experiments (n = 300). ***P < 0.001 by Student’s t-test. d cGAS−/− and wild-type HeLa cells were treated with nocodazole for 16 h. Then, mitotic cells were collected by shaking the plate, and the collected cells were seeded on PLL-coated coverslips for 1 h before ICC was performed to analyze the number of cells showing the indicated chromosomal missegregations. The results are given as the mean ± SD from three independent experiments (n = 300). ***P < 0.001 as assessed by Student’s t-test. e cGAS−/− HeLa cells were transfected with pcDNA or MYC-cGAS and then were treated with nocodazole for 16 h to induce mitotic arrest. After release from nocodazole treatment, mitotic cells were seeded on PLL-coated coverslips for 1 h and were then subjected to ICC to quantify the percentage of cells with chromosomal segregation errors. The results are given as the mean ± SD from three independent experiments (n = 300). *P < 0.05, ***P < 0.001 as assessed by Student’s t-test.
Fig. 3
Fig. 3. cGAS activity-dependent downregulation of the micronuclei phenotype.
a cGAS−/− HeLa cells were transfected with the indicated plasmids for 6 h and then were treated with nocodazole for 16 h. Then, mitotic cells were collected by shaking the plate, and they were subjected to western blotting (left panel) with the indicated antibodies. Further, ICC (right panel) was performed to determine the percentage of cells showing micronuclei 10 h after release from nocodazole, and representative fluorescent images show micronuclei (white arrowhead denotes micronuclei). The results are given as the mean ± SD from three independent experiments (n = 300). ***P < 0.001 as assessed by Student’s t-test. b cGAS−/− HeLa cells were transfected with or without cGAMP using Lipofectamine® 2000 transfection reagent and were then incubated for 6 h. Then, the cells were arrested at the M phase via nocodazole treatment for 16 h. A portion of the mitotic cells were seeded on a coverslip to enumerate the cells showing a micronuclei phenotype 10 h after release from arrest, as assessed by ICC (right panel) along with representative fluorescent images showing micronuclei (white arrowhead denotes micronuclei). The remaining portion of cells was subjected to western blotting with the indicated antibodies (left panel). The results are given as the mean ± SD from three independent experiments (n = 300). ***P < 0.001 as assessed by Student’s t-test. c HeLa cells transfected with sicGAS for 20 h were transfected with or without cGAMP for 6 h and then subjected to nocodazole treatment for 16 h. Ten hours after release from nocodazole treatment, western blotting (left panel) with the indicated antibodies and ICC (right panel) was performed to quantify cells displaying a micronuclei phenotype. The results are given as the mean ± SD from three independent experiments (n = 300). ***P < 0.001 as assessed by Student’s t-test.
Fig. 4
Fig. 4. STING activation via cGAS leads to chromosomal stability.
a HeLa cells transfected with an siRNA targeting STING, and after 30 h they were treated with nocodazole for 16 h. Mitotic cells were subjected to western blotting (left panel) for cGAS, STING, and α-tubulin and to ICC (right panel) to analyze the percentage of micronucleated cells; representative fluorescent images show micronuclei (white arrowhead denotes micronuclei). The results are given as the mean ± SD from three independent experiments (n = 300). ***P < 0.001 as assessed by Student’s t-test. b HeLa cells were cotransfected with siSTING and different indicated plasmids for 20 h and then were arrested via nocodazole treatment. After 16 h, cells were released from arrest, and western blotting (left panel) with the indicated antibodies was performed. The percentages of cells with micronuclei were counted after performing ICC (right panel) on cells 10 h after their release from mitotic arrest; representative fluorescent images show micronuclei (white arrowhead denotes micronuclei). The results are given as the mean ± SD from three independent experiments (n = 300). ***P < 0.001 as assessed by Student’s t-test. c cGAS−/− HeLa cells were transfected with the indicated plasmids for 12 h before nocodazole treatment commenced for 16 h. Ten hours after release from mitotic arrest, cells were subjected to western blotting with the indicated antibodies and ICC to calculate the percentage of cells showing micronuclei formation after nocodazole release; representative fluorescent images show micronuclei (white arrowhead denotes micronuclei). The results are given as the mean ± SD from three independent experiments (n = 300). ***P < 0.001 as assessed by Student’s t-test.
Fig. 5
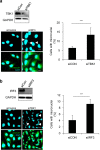
Fig. 5. TBK1 and IRF3 downregulation also promotes the formation of micronucleated cells.
a HeLa cells were transfected with siRNA targeting TBK1, and 30 h later they were treated with nocodazole for 16 h. After 16 h, cells were released from arrest and were subjected to western blotting with the indicated antibodies. Mitotic cells collected after nocodazole treatment were reseeded, and ICC was performed to evaluate the percentage of cells with micronuclei; representative fluorescent images show micronuclei (white arrowhead denotes micronuclei). The results are given as the mean ± SD from three independent experiments (n = 300). ***P < 0.001 as assessed by Student’s t-test. b IRF3 was downregulated by RNA interference in HeLa cells for 30 h, and then cells were treated with nocodazole for 16 h. After 16 h, cells were released from arrest, and mitotic cells were collected and subjected to ICC (right panel) to evaluate the percentage of cells with micronuclei; representative fluorescent images show micronuclei (white arrowhead denotes micronuclei). Western blotting was performed with the indicated antibodies to confirm IRF3 knockdown via siRNA transfection (left panel).
Fig. 6
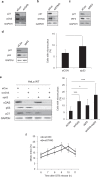
Fig. 6. cGAS–STING pathway-dependent p21 expression levels resulting in abnormal cell-cycle progression.
a HeLa cells were transfected with sicGAS, and after 48 h they were subjected to western blotting with the indicated antibodies. b HeLa cells transfected with an siRNA targeting STING, and after 48 h the cell lysates were subjected to western blotting with antibodies against p21, STING, and GAPDH. c IRF3 was knocked down using RNA interference, and after 48 h cell lysates were collected. Cell lysates were subjected to western blotting with the indicated antibodies. d p53 was knocked down in HeLa cells using sip53, and micronuclei were checked 10 h after release from nocodazole by ICC (right panel); p21 levels were assessed with the indicated antibodies by western blot (left panel). The results are given as the mean ± SD from three independent experiments (n = 300). ***P < 0.001 as assessed by Student’s t-test. e HeLa cells were transfected with sip53, sicGAS, or both, and then micronuclei formation was quantified after release from nocodazole using ICC (right panel). cGAS, p53, and p21 levels were assessed with the indicated antibodies using western blot. The results are given as the mean ± SD from three independent experiments (n = 300). ***P < 0.001 as assessed by Student’s t-test. f HeLa cells were transfected with siSTING and then were subjected to a double thymidine block with 2 mM thymidine for 40 h. Six hours after release from the DTB, quantification of the percentage of mitotic cells with condensed chromosomes was performed by aceto-orcein staining at the indicated time points. The results are given as the mean ± SD from three independent experiments (n = 300).
Fig. 7
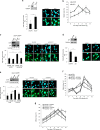
Fig. 7. Upregulation of p21 levels or cell-cycle arrest at the G2 phase results in improved chromosomal stability.
a HeLa cells were transfected with sip21, and after 30 h cells were treated with nocodazole for 16 h. After nocodazole release, cells were subjected to western blotting (top panel) with p21 and GAPDH (loading control) antibodies. Mitotic cells were analyzed by ICC, and the number of micronucleated cells was calculated (bottom panel); representative fluorescent images show micronuclei (white arrowhead denotes micronuclei). The results are given as the mean ± SD from three independent experiments (n = 300). ***P < 0.001 as assessed by Student’s t-test. b Same as in a. Mitotic cells (as indicated above) were collected and stained with aceto-orcein to visualize cells with condensed chromosomes. The percentage of mitotic cells with condensed chromosomes was calculated at the indicated time points. The results are given as the mean ± SD from three independent experiments (n = 300). c Co-transfection of sicGAS with or without a p21 plasmid was performed for 30 h. Then, cells were treated with nocodazole for 16 h before being analyzed by western blot (top panel) with the indicated antibodies as well as by ICC (bottom panel) for enumeration of micronucleated cells; representative fluorescent images show micronuclei (white arrowhead denotes micronuclei). The results are given as the mean ± SD from three independent experiments (n = 300). ***P < 0.001 as assessed by Student’s t-test. d cGAS−/− HeLa cells were transfected with p21 plasmid, and after 12 h they were treated with nocodazole for 16 h. After 16 h, cells were subjected to western blotting (top panel) with the indicated antibodies, and mitotic cells that were collected upon cessation of nocodazole treatment were reseeded on a coverslip so that ICC could be performed. Immunocytochemical analysis (bottom panel) was used to detect and count the percentage of cells showing micronuclei; representative fluorescent images show micronuclei (white arrowhead denotes micronuclei). The results are given as the mean ± SD from three independent experiments (n = 300). ***P < 0.001 as assessed by Student’s t-test. e HeLa cells transfected with sicGAS and synchronized by double thymidine block for 40 h were released from arrest and then 7 h later were treated with RO3306 for 3 h. Mitotic cells with or without RO3306 treatment were collected by shaking the plate at 9 and 10 h, and then they were reseeded on a coverslip to assess chromosomal instability phenotypes, i.e., micronuclei by immunocytochemistry (bottom panel); representative fluorescent images show micronuclei (white arrowhead denotes micronuclei). Western blotting was performed with the indicated antibodies to confirm cGAS downregulation (top panel). f Same as indicated in e. Six hours after release from DTB, quantification of the percentage of mitotic cells with condensed chromosomes was performed by aceto-orcein staining at the indicated time points; the cells analyzed were those with or without RO3306 treatment for 3 h, which occurred 7 h after release from DTB. The results are given as the mean ± SD from three independent experiments (n = 300). g Cells were cotransfected with sicGAS and pcDNA (control vector) or p21 and then were subjected to DTB. After release from DTB, cells were harvested at the indicated time points and stained with aceto-orcein to count mitotic cells with condensed chromosomes. The results are given as the mean ± SD from three independent experiments (n = 300).

Similar articles

Cited by

References

    1. Cui J, Chen Y, Wang HY, Wang RF. Mechanisms and pathways of innate immune activation and regulation in health and cancer. Hum. Vaccin. Immunother. 2014;10:3270–3285. doi: 10.4161/21645515.2014.979640. - DOI - PMC - PubMed
    1. Li X, et al. Cyclic GMP-AMP synthase is activated by double-stranded DNA-induced oligomerization. Immunity. 2013;39:1019–1031. doi: 10.1016/j.immuni.2013.10.019. - DOI - PMC - PubMed
    1. Wu J, et al. Cyclic GMP-AMP is an endogenous second messenger in innate immune signaling by cytosolic DNA. Science. 2013;339:826–830. doi: 10.1126/science.1229963. - DOI - PMC - PubMed
    1. Ishikawa H, Barber GN. STING is an endoplasmic reticulum adaptor that facilitates innate immune signalling. Nature. 2008;455:674–678. doi: 10.1038/nature07317. - DOI - PMC - PubMed
    1. Shu C, Li X, Li P. The mechanism of double-stranded DNA sensing through the cGAS-STING pathway. Cytokine Growth Factor Rev. 2014;25:641–648. doi: 10.1016/j.cytogfr.2014.06.006. - DOI - PMC - PubMed

Publication types

MeSH terms