. 2020 Apr 10;5(46):eaaz4415.
doi: 10.1126/sciimmunol.aaz4415.

M2-like, dermal macrophages are maintained via IL-4/CCL24-mediated cooperative interaction with eosinophils in cutaneous leishmaniasis

Affiliations

M2-like, dermal macrophages are maintained via IL-4/CCL24-mediated cooperative interaction with eosinophils in cutaneous leishmaniasis

Sang Hun Lee et al. Sci Immunol. .

Abstract

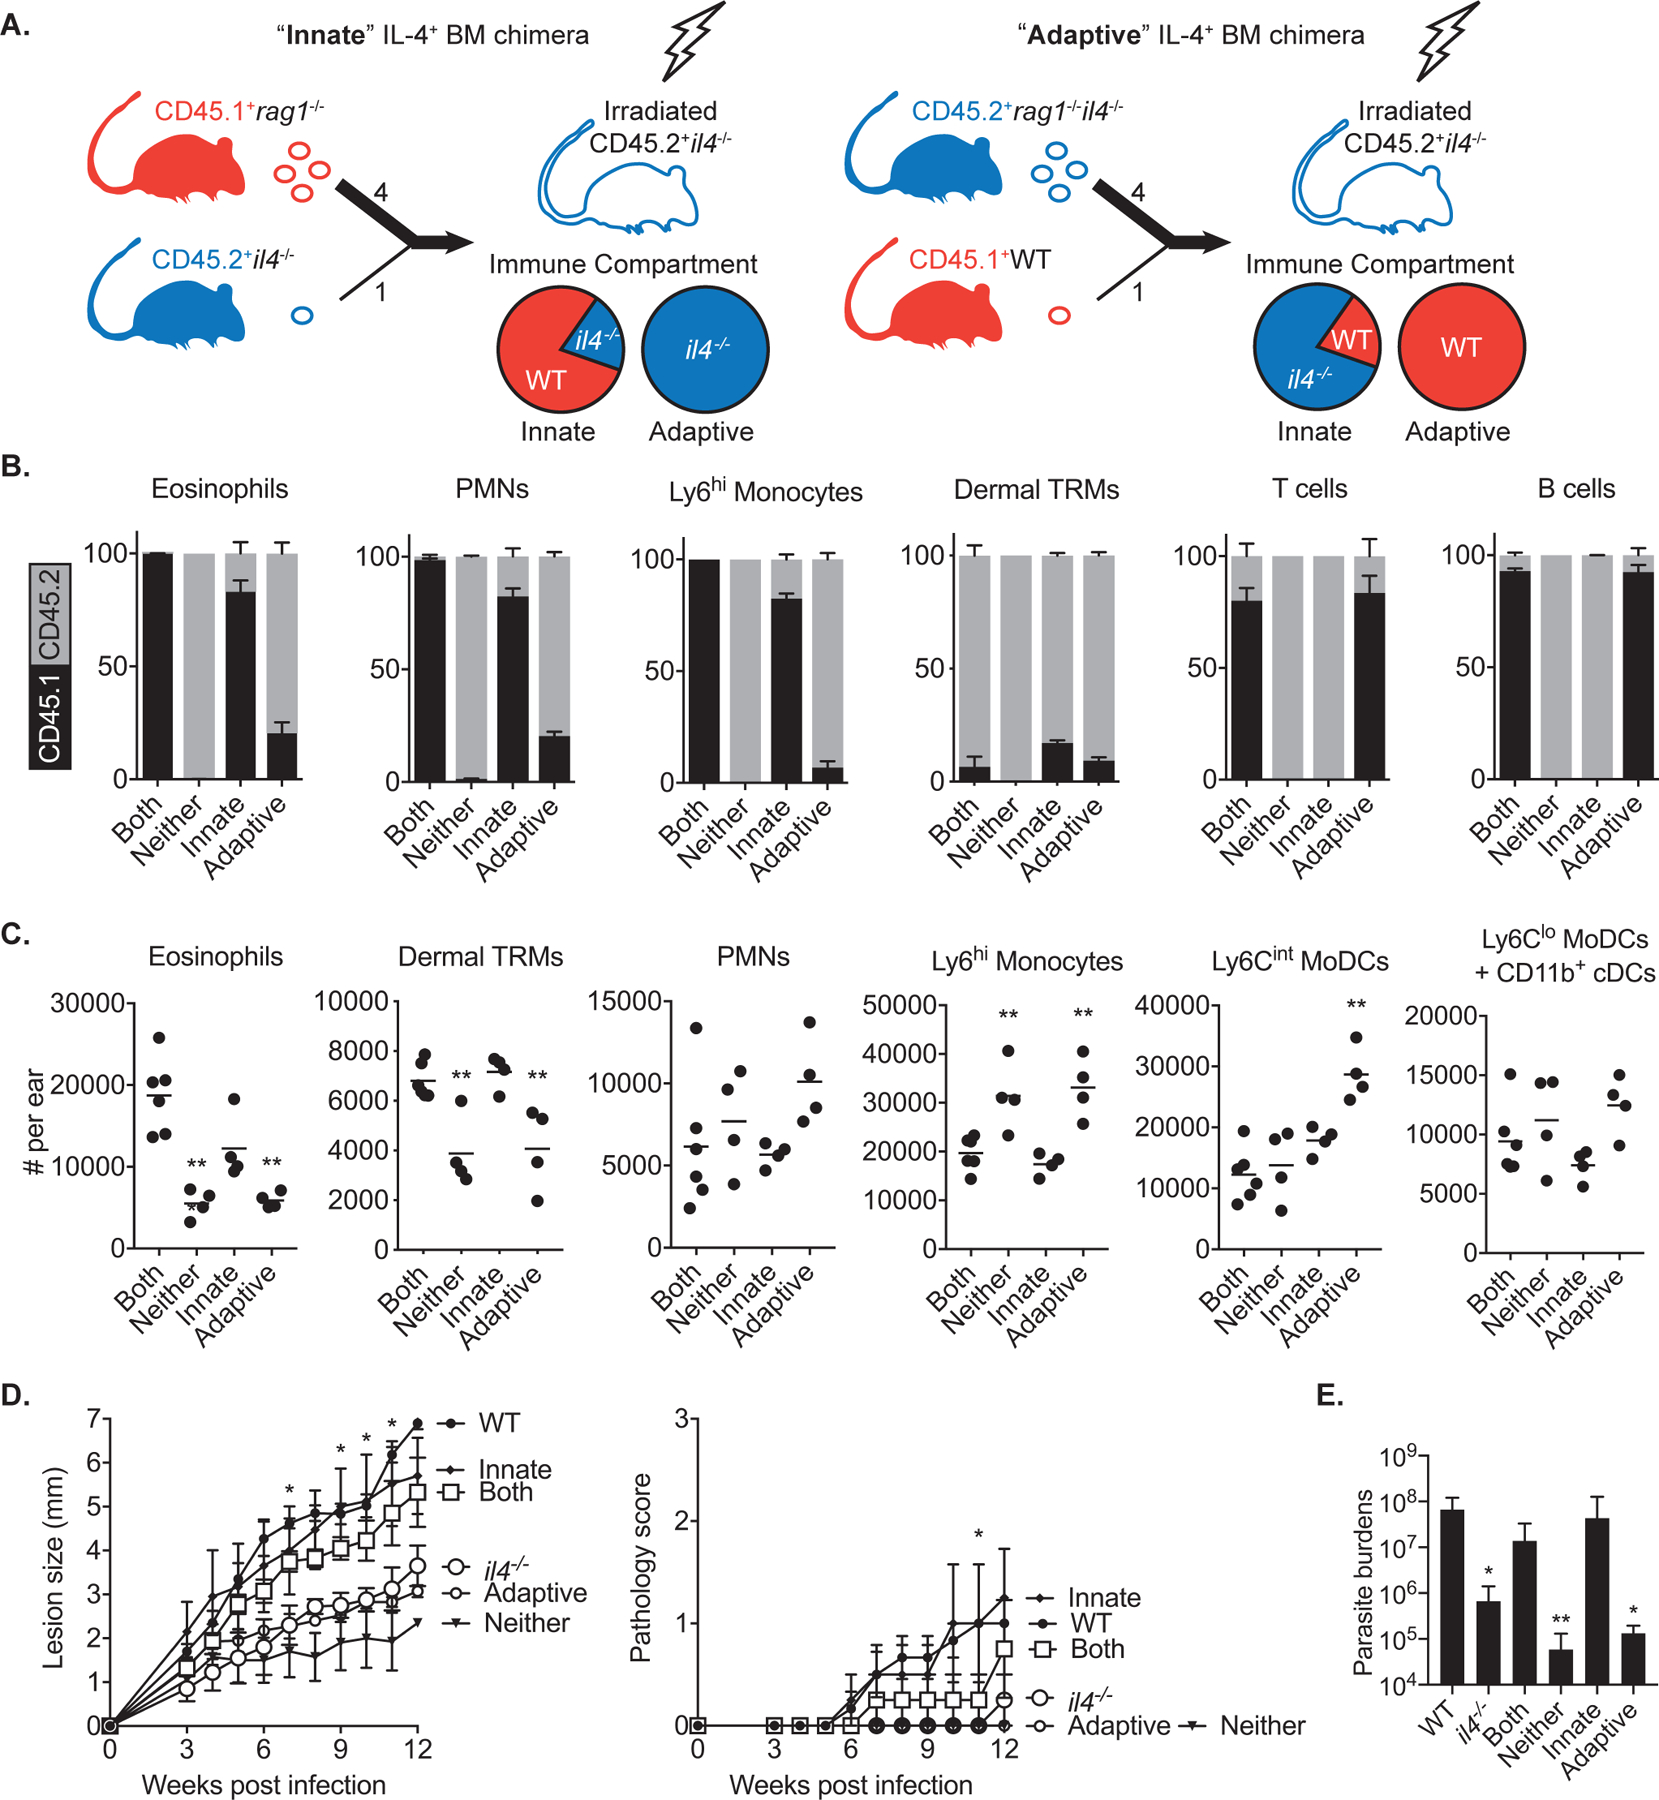
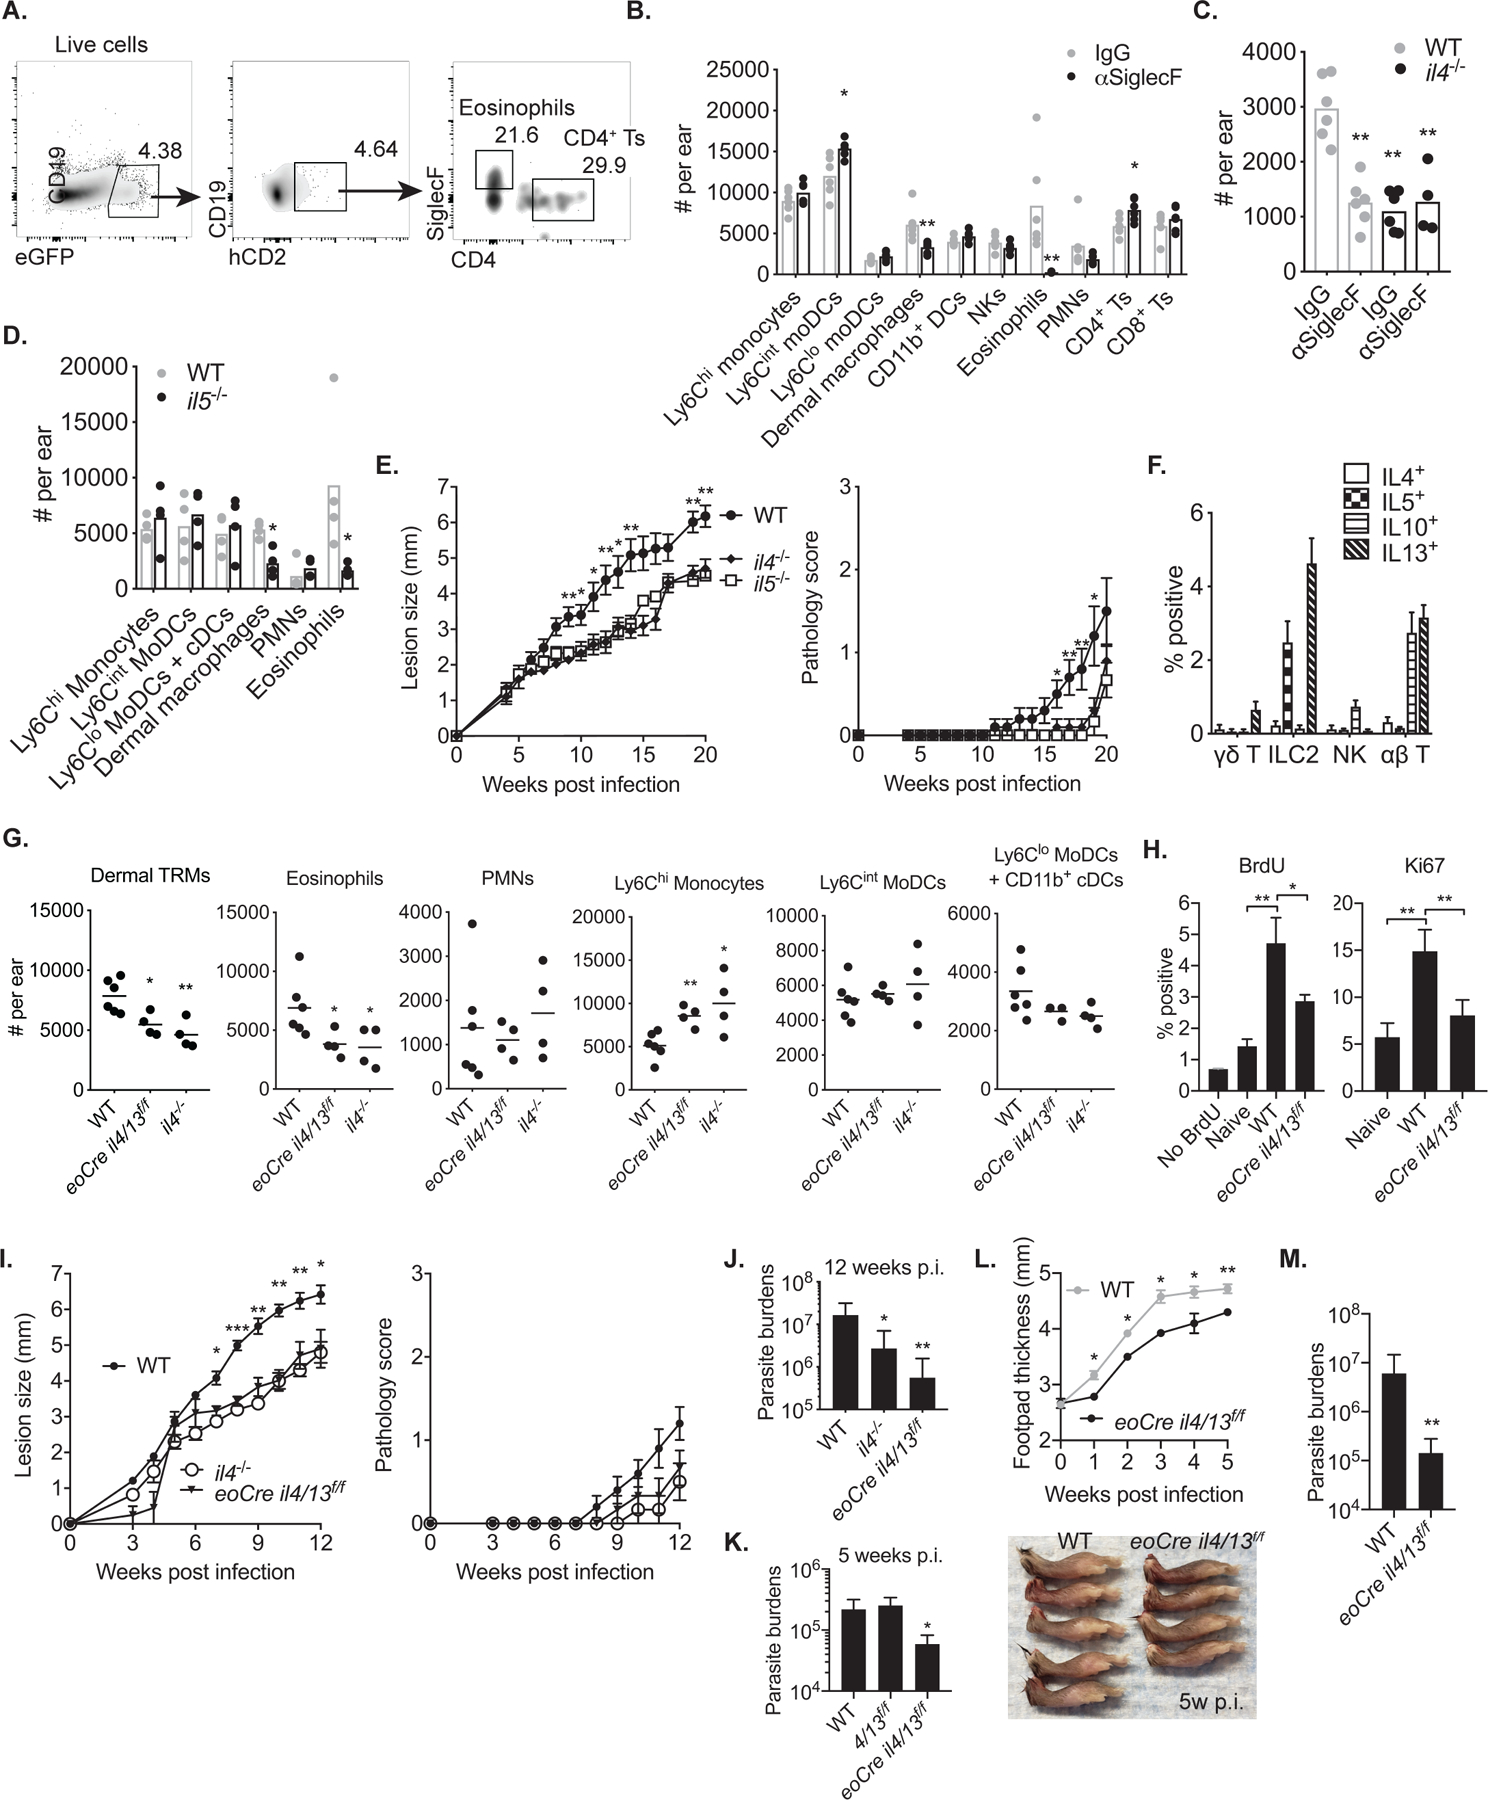
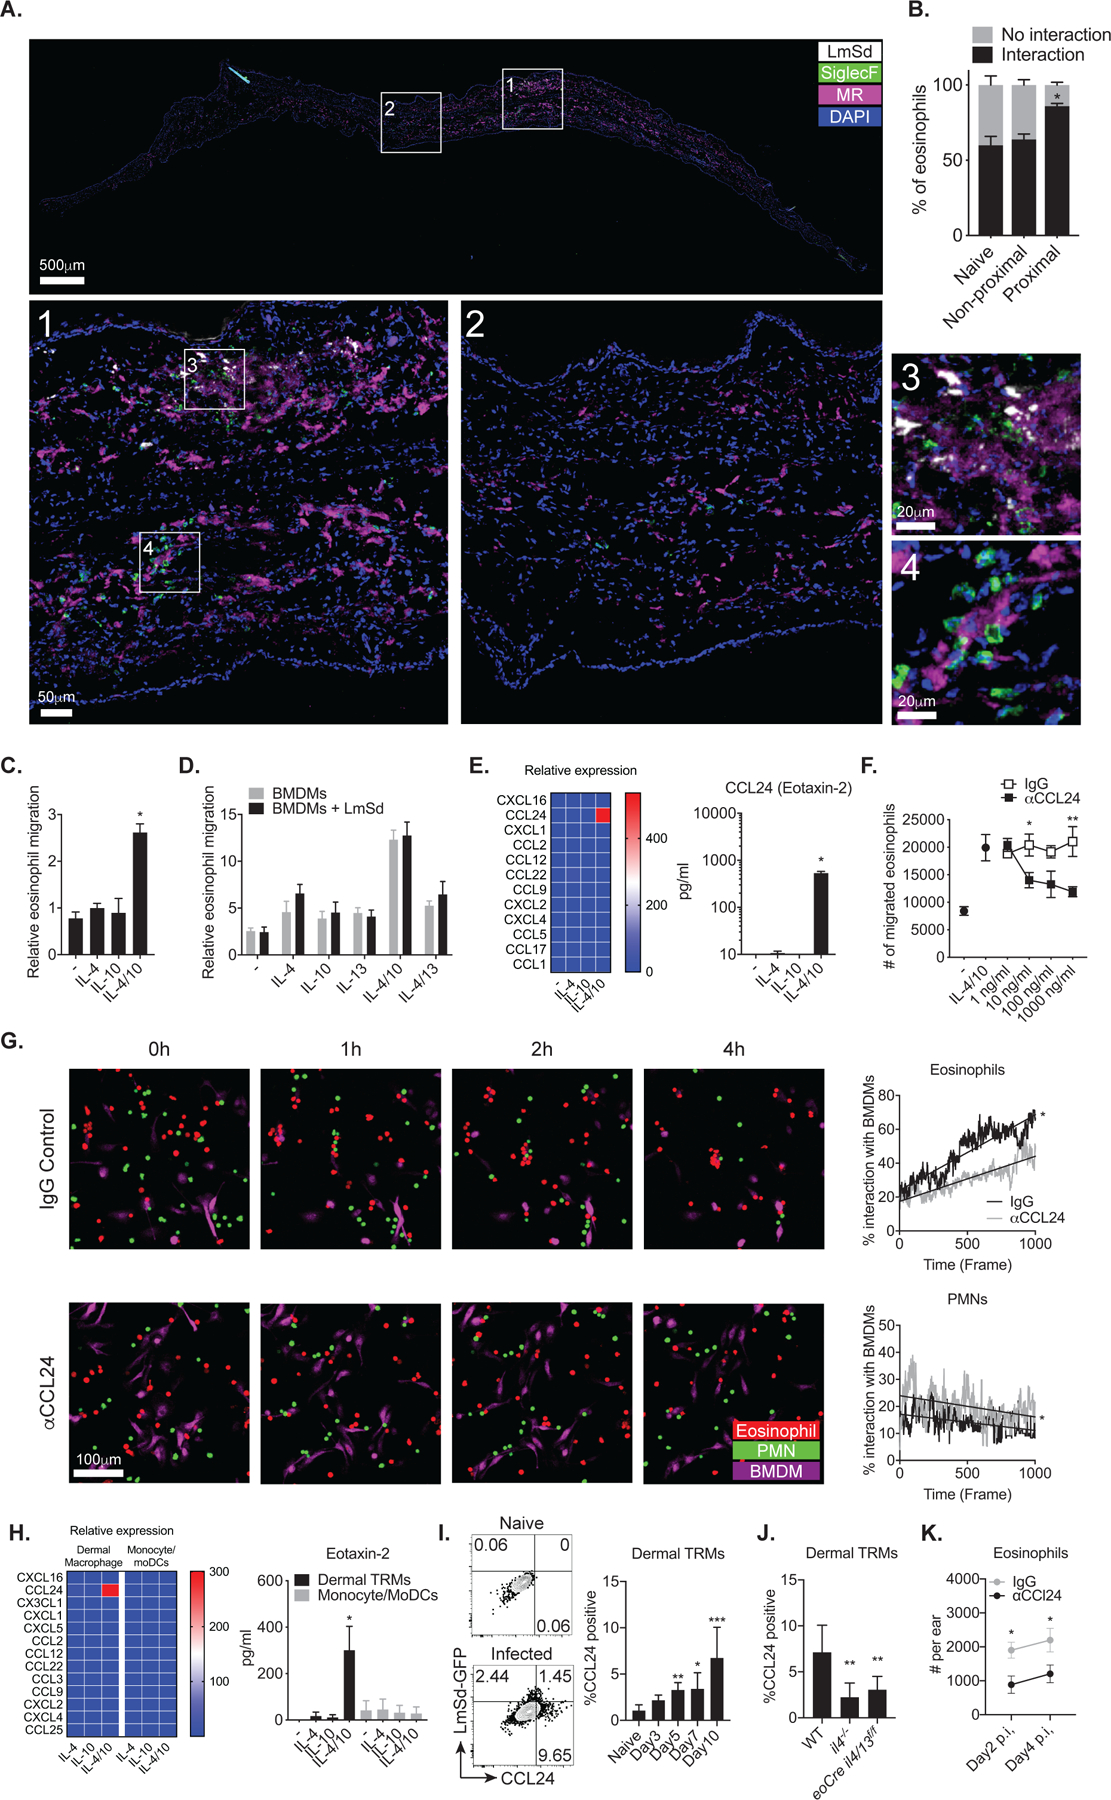
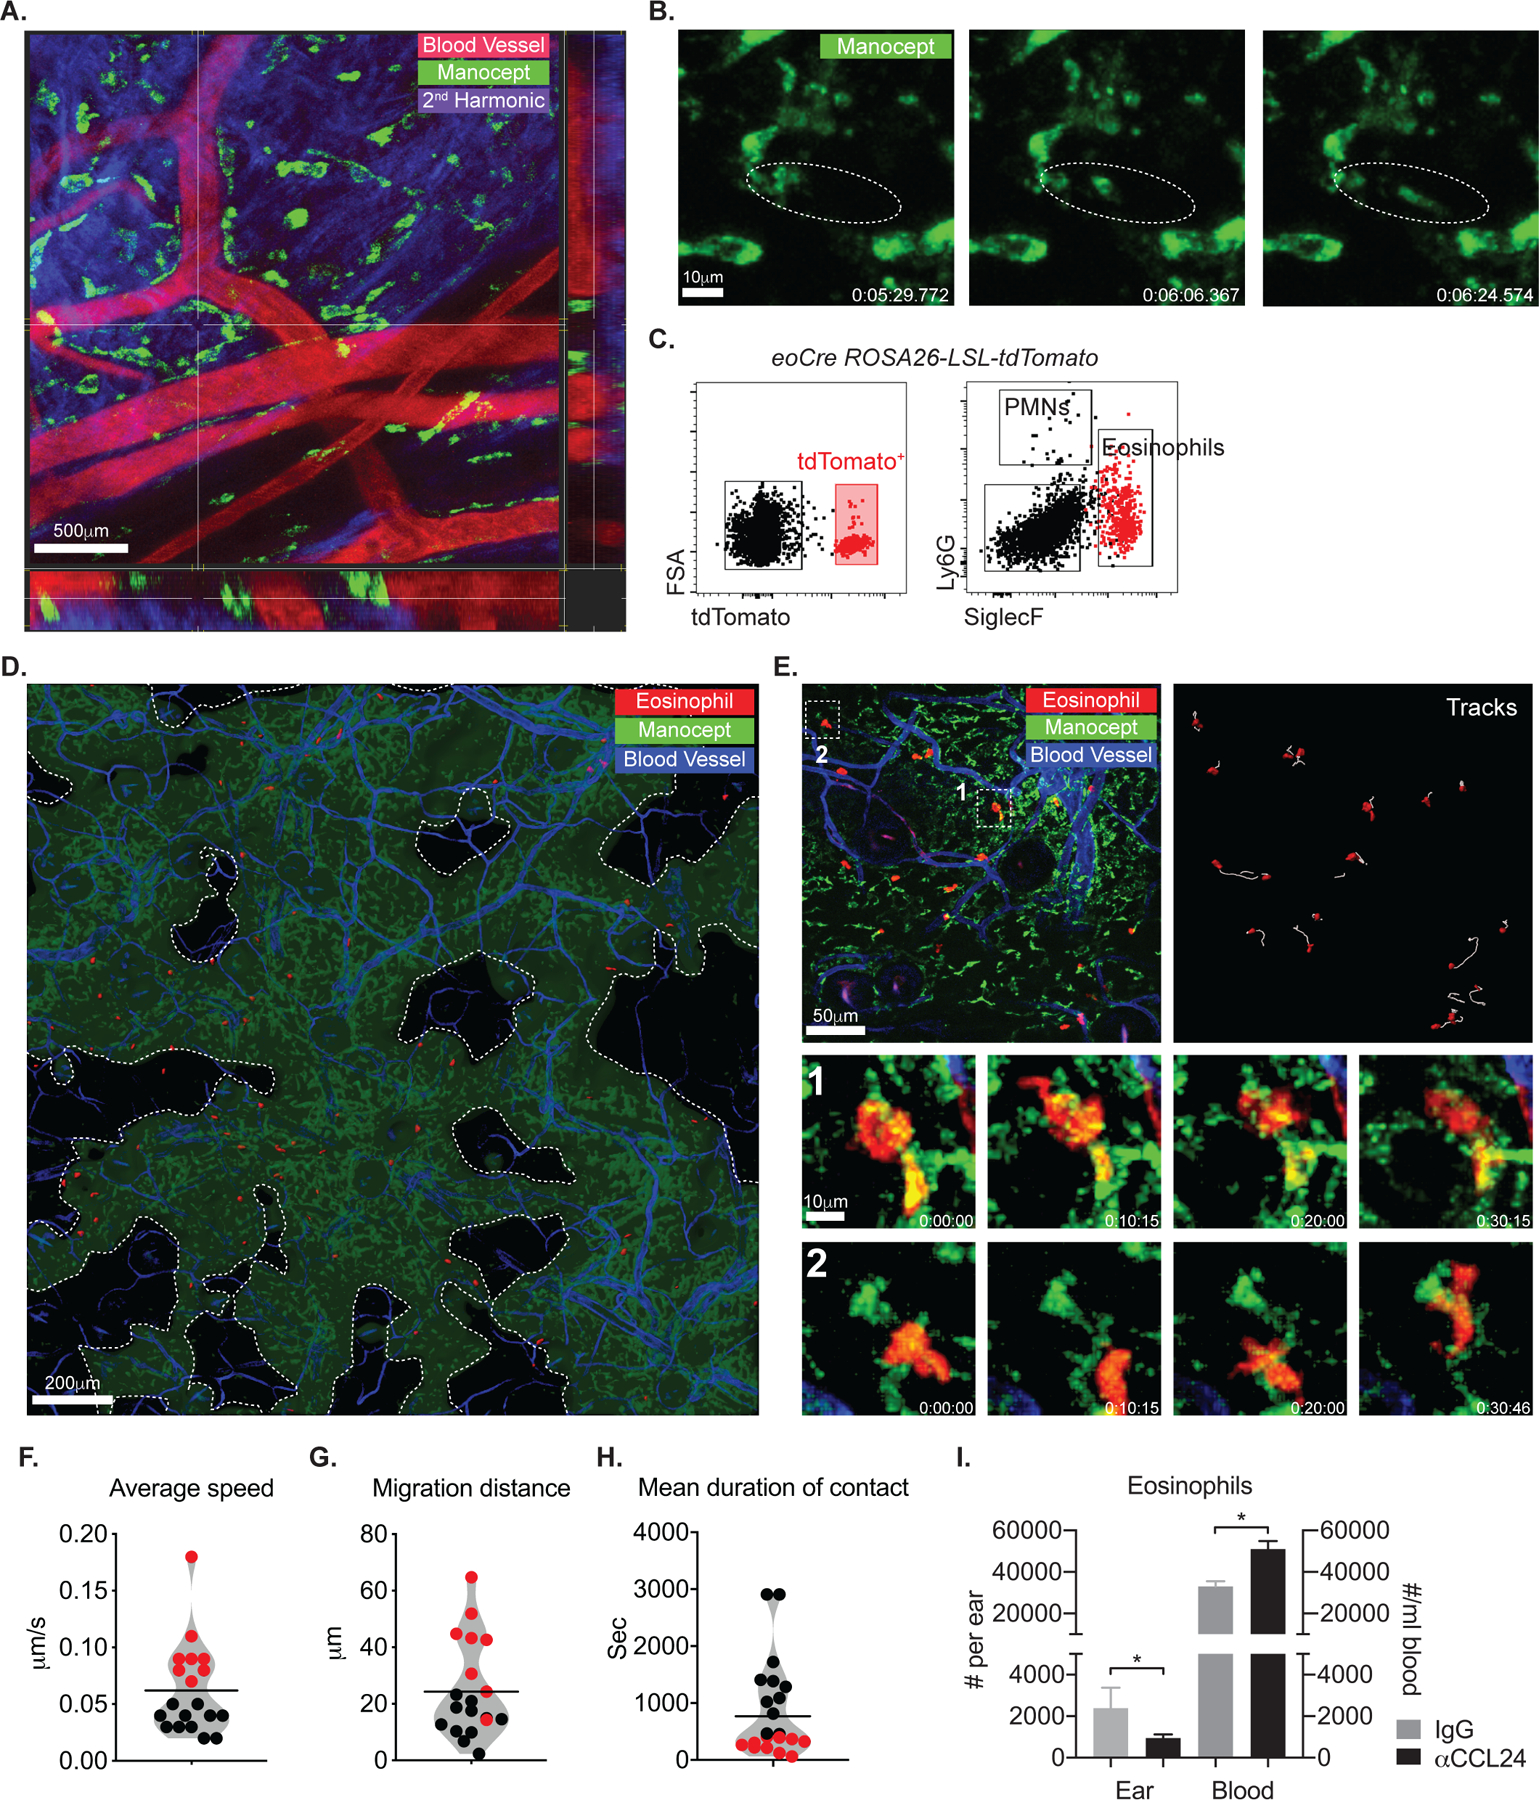
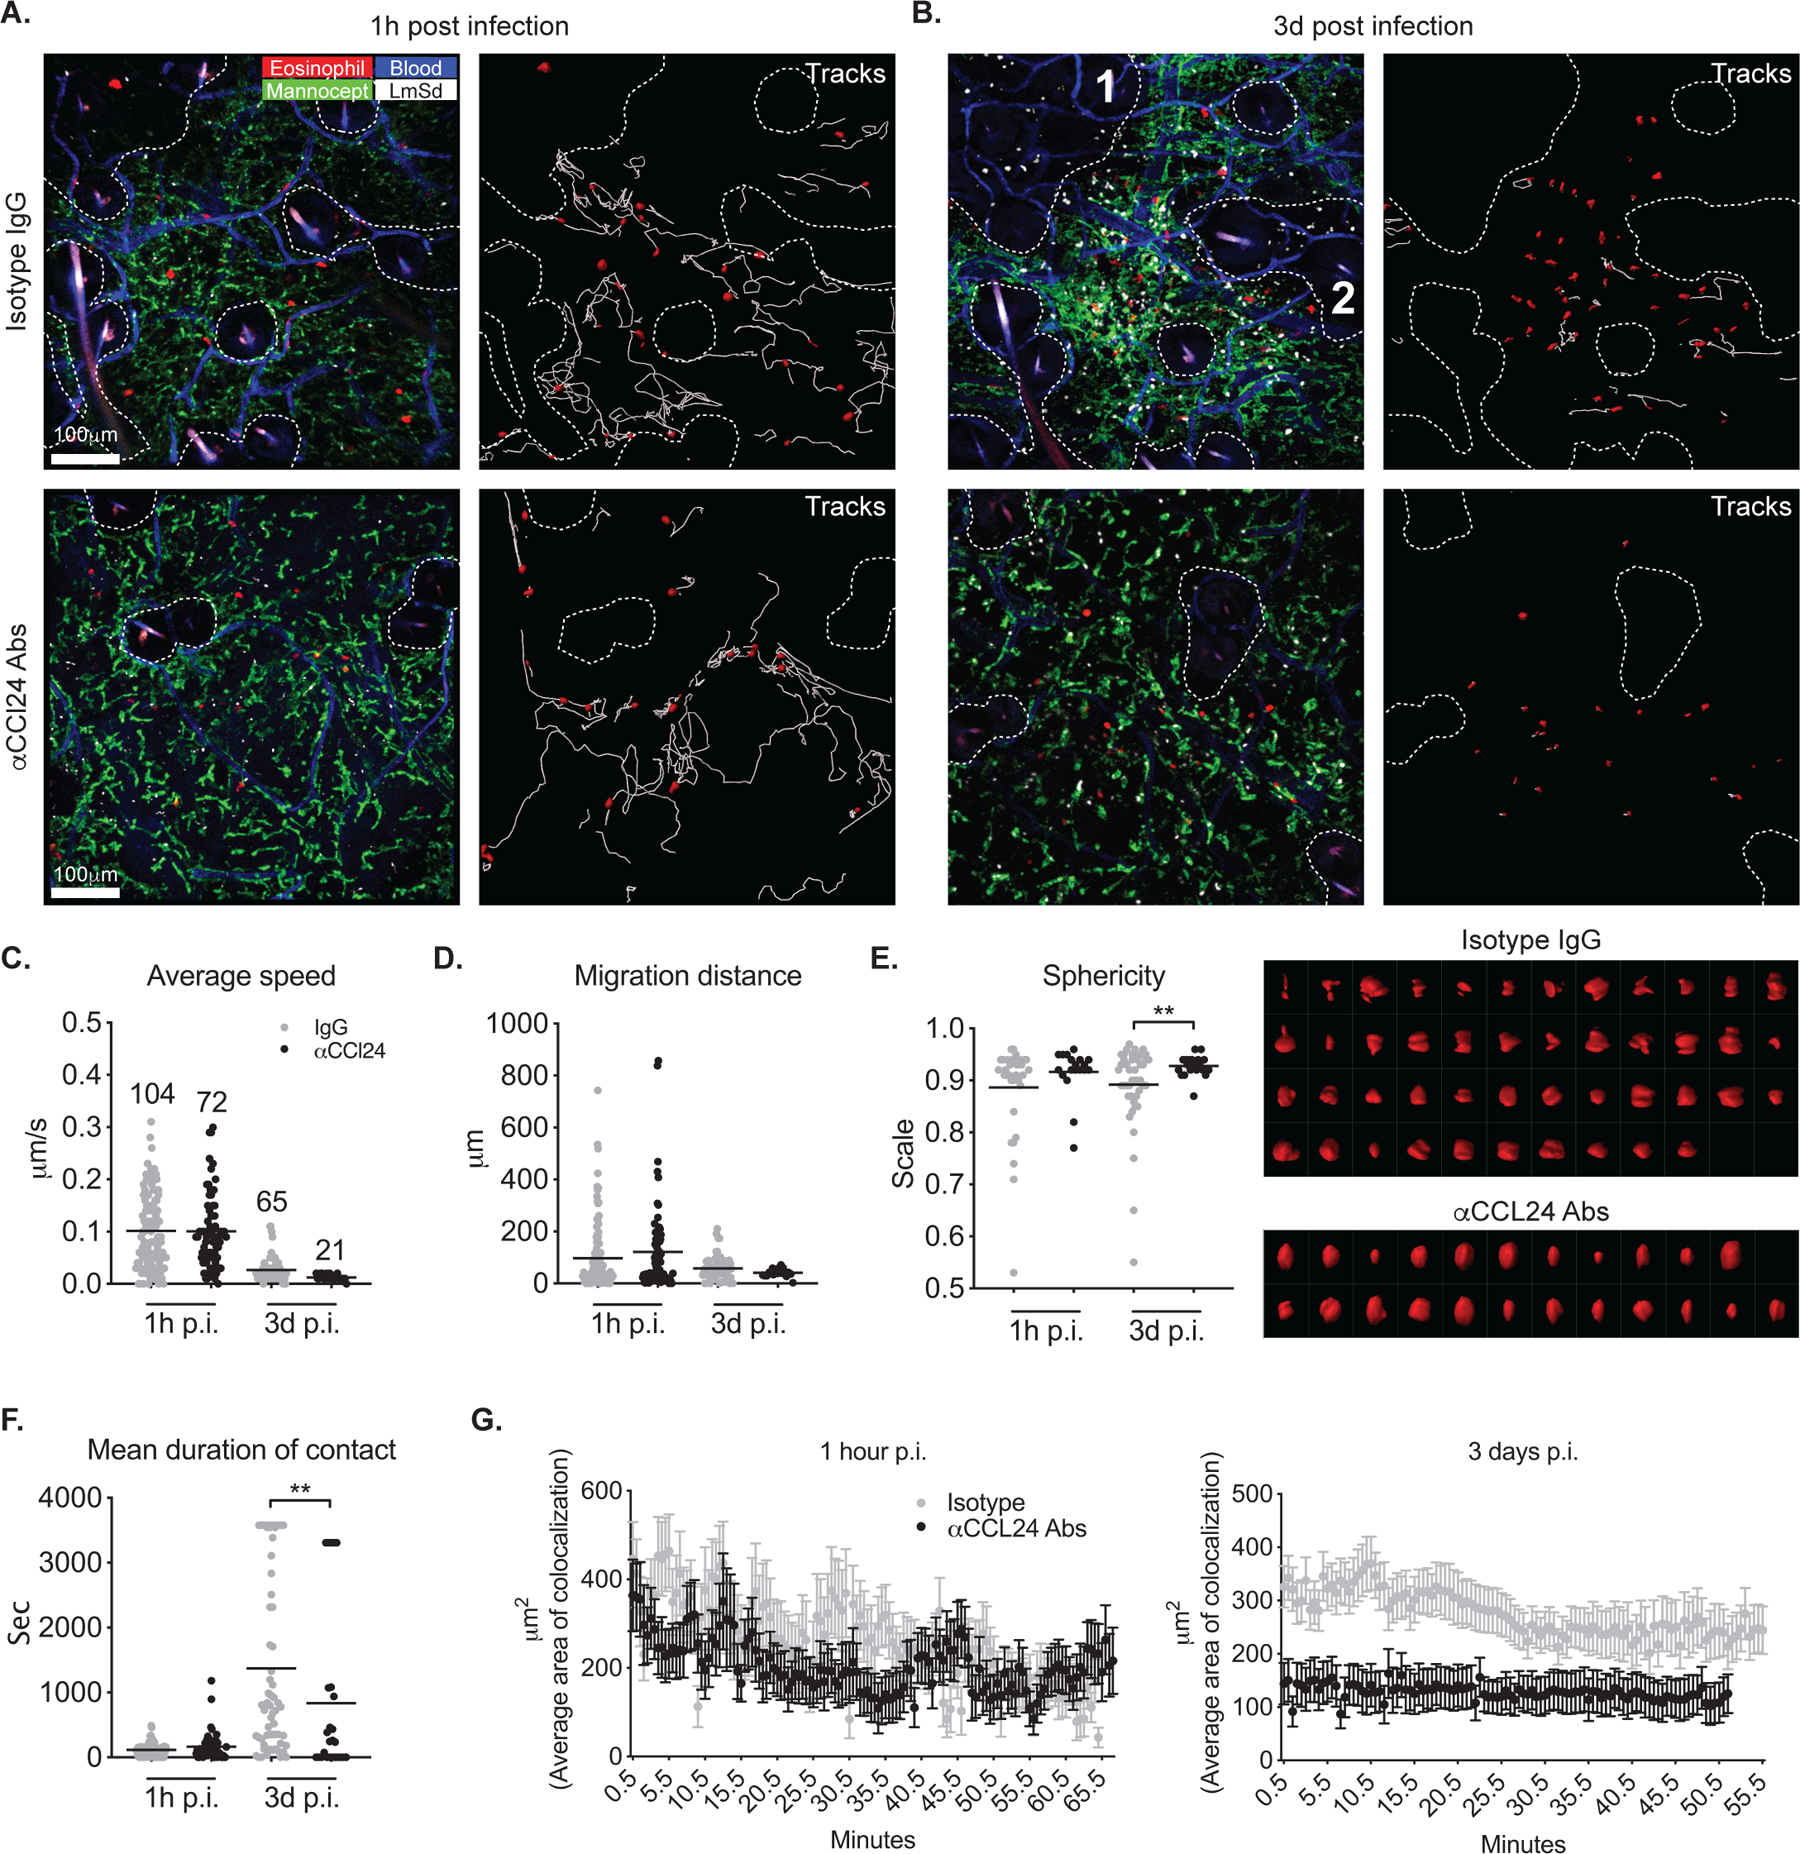
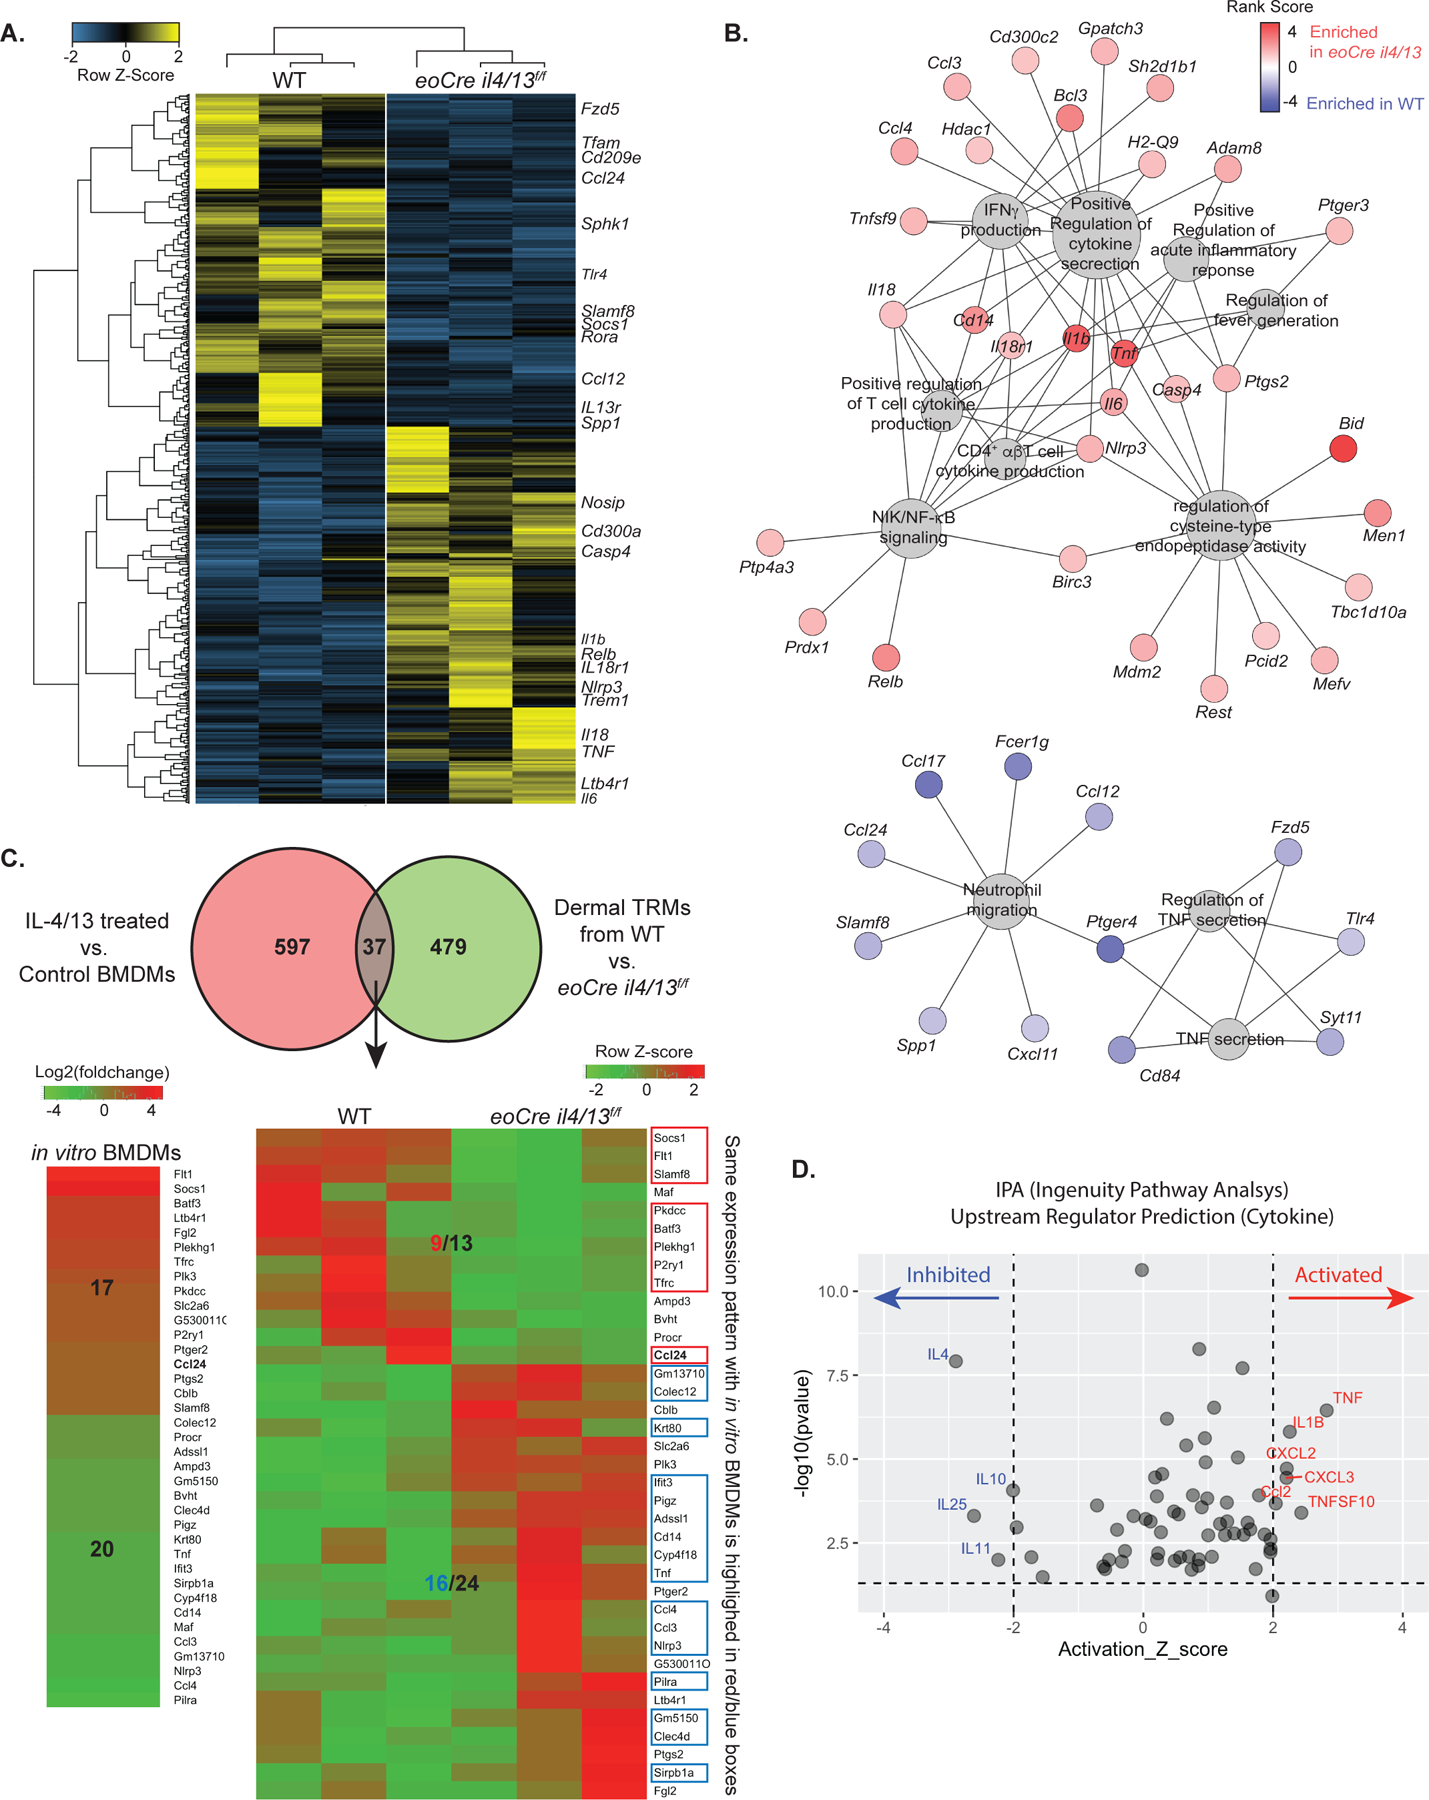
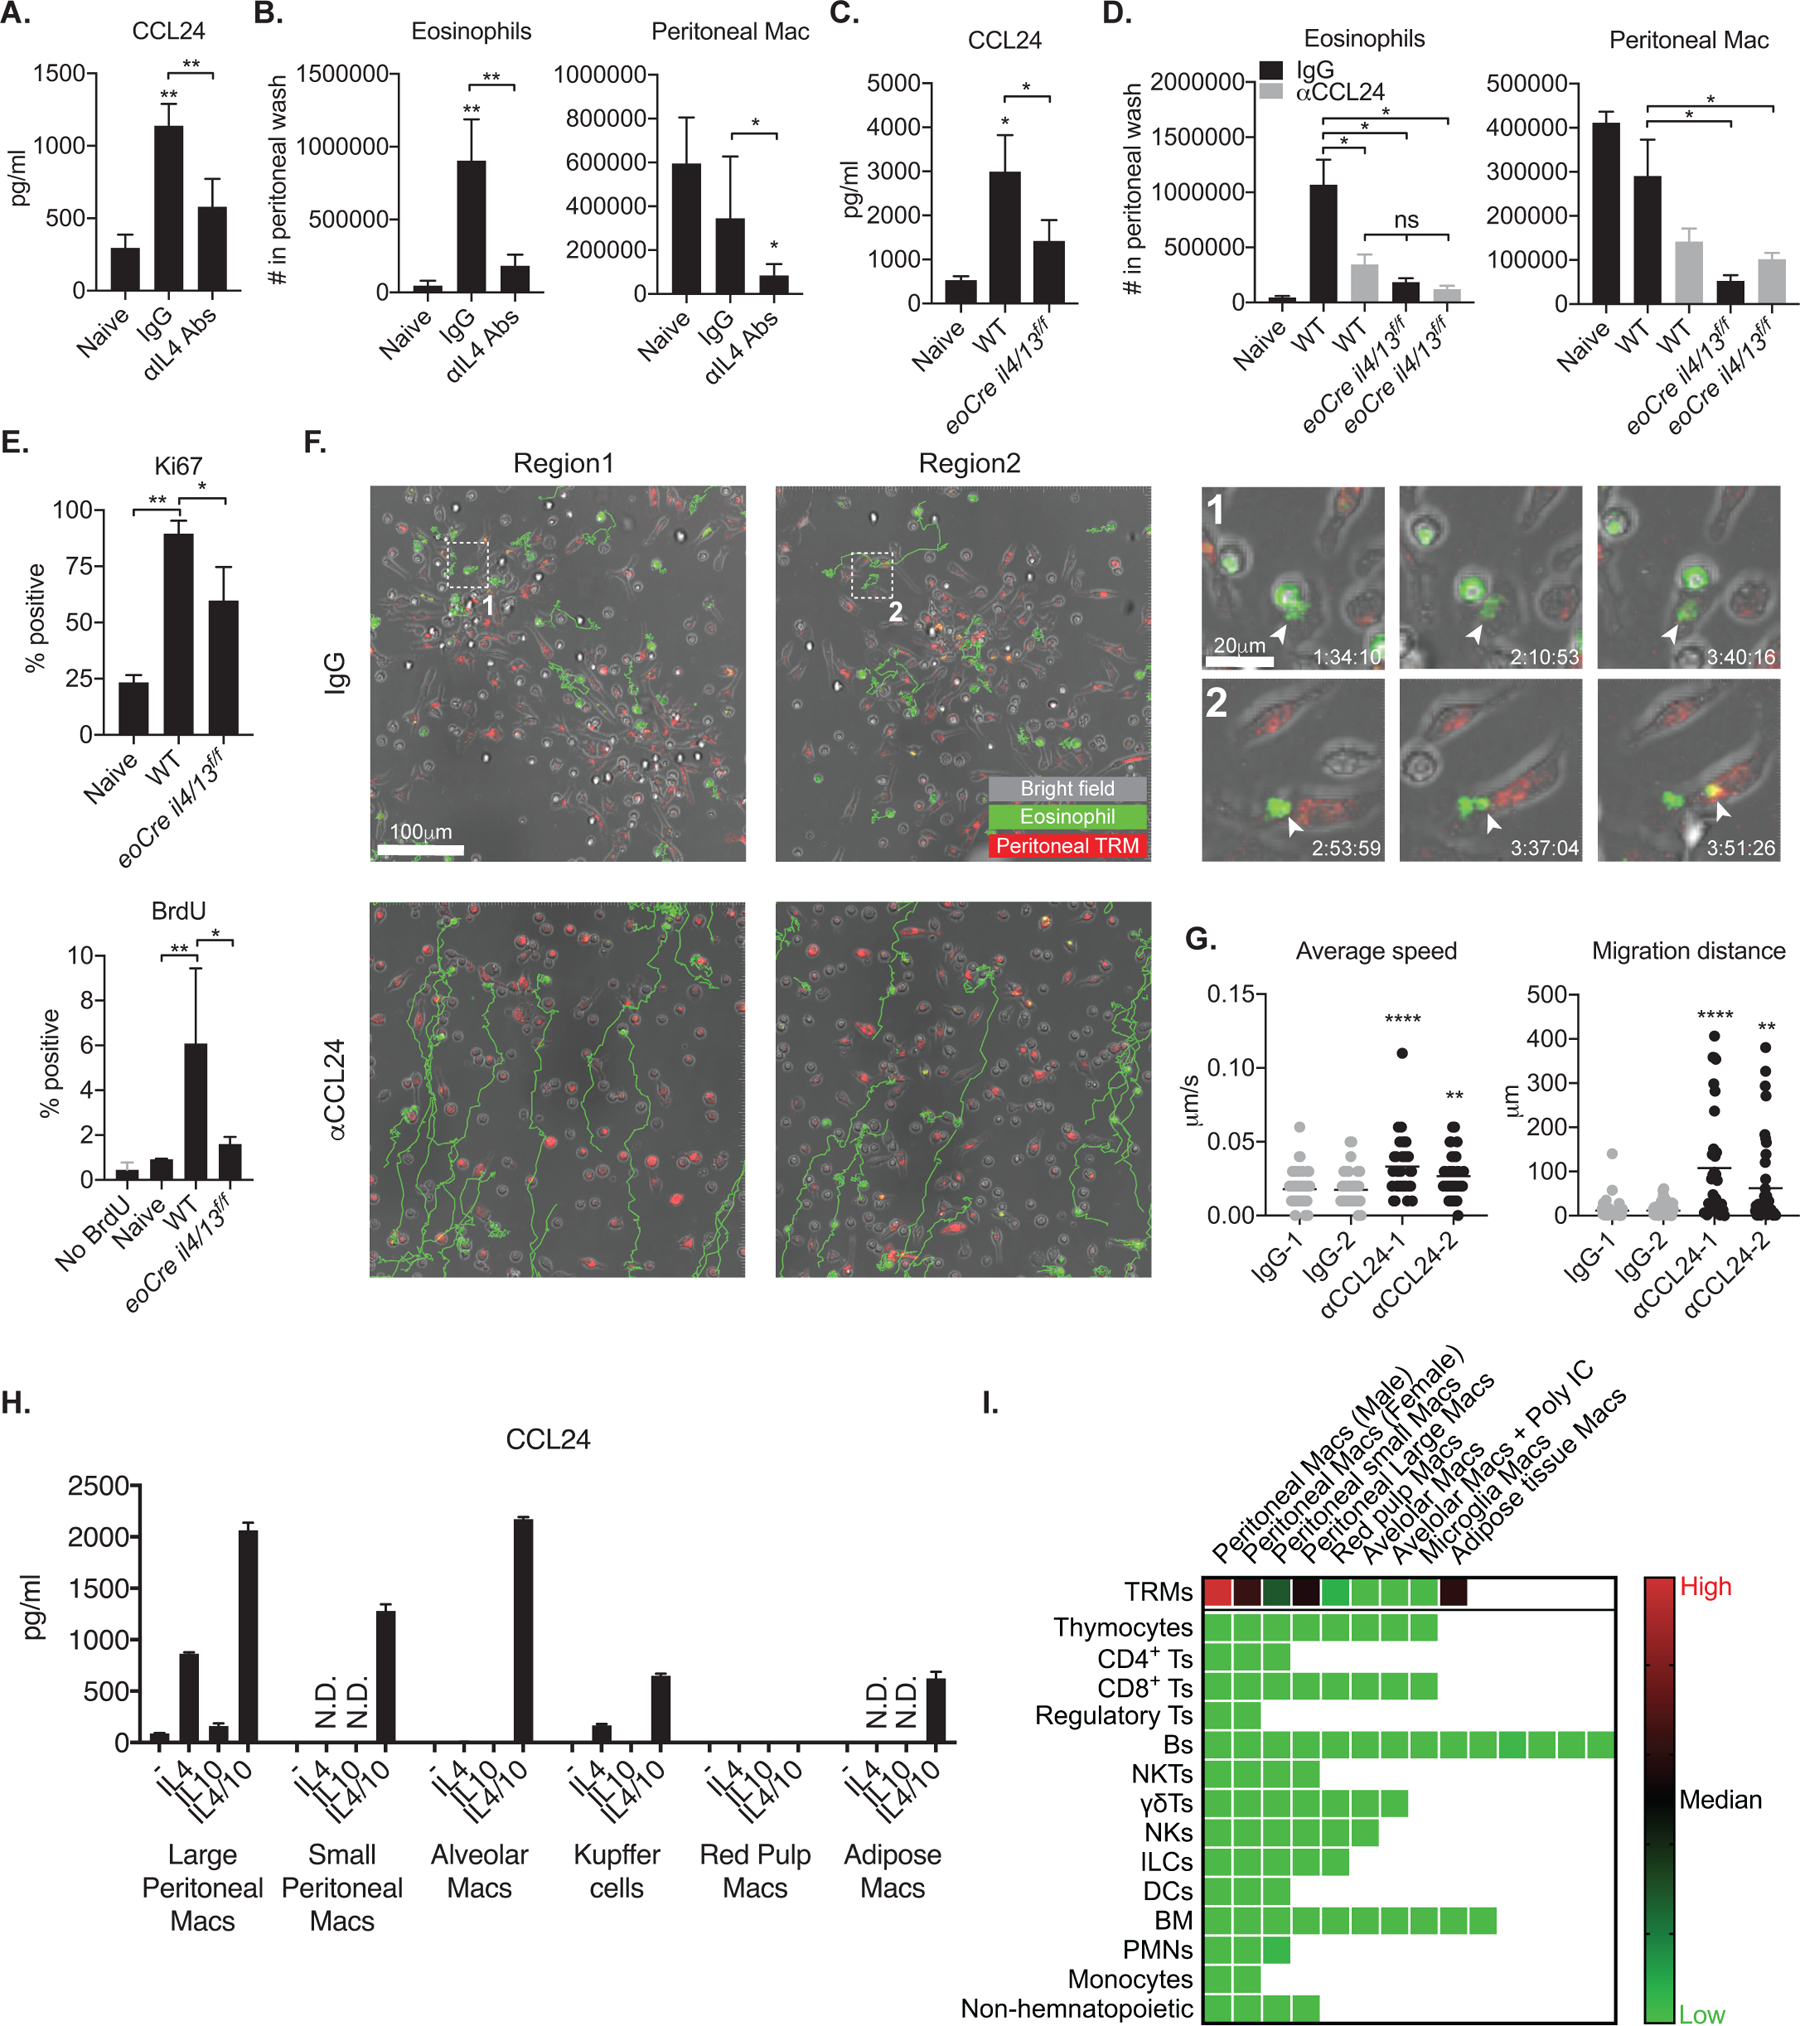
Tissue-resident macrophages (TRMs) maintain tissue homeostasis, but they can also provide a replicative niche for intracellular pathogens such as Leishmania How dermal TRMs proliferate and maintain their M2 properties even in the strong TH1 environment of the L. major infected dermis is not clear. Here, we show that, in infected mice lacking IL-4/13 from eosinophils, dermal TRMs shifted to a proinflammatory state, their numbers declined, and disease was attenuated. Intravital microscopy revealed a rapid infiltration of eosinophils followed by their tight interaction with dermal TRMs. IL-4-stimulated dermal TRMs, in concert with IL-10, produced a large amount of CCL24, which functioned to amplify eosinophil influx and their interaction with dermal TRMs. An intraperitoneal helminth infection model also demonstrated a requirement for eosinophil-derived IL-4 to maintain tissue macrophages through a CCL24-mediated amplification loop. CCL24 secretion was confined to resident macrophages in other tissues, implicating eosinophil-TRM cooperative interactions in diverse inflammatory settings.


Conflict of interest statement

Competing interests: The authors declare no competing interests.

Figures

Fig. 1.
Fig. 1.
Innate cells are the source of IL-4 to maintain dermal TRMs during L. major infection. (A) Transplantation strategy used to generate mixed bone marrow chimeras with selective IL-4 competency within innate or adaptive compartments. BM cells mixed in a ratio of 4:1 were transferred to irradiated recipients. (B) Mixed bone marrow chimeras (n = 4–6) with selective IL-4 expression in innate or adaptive immune cells were generated by reconstitution of irradiated CD45.2+ il4−/− mice with various mixtures of BM cells from CD45.1+ WT, CD45.2+ il4−/−, CD45.1+ rag1−/−, and CD45.2+ rag1−/−il4−/− mice, as described in Results. (C) The absolute numbers of myeloid subsets recovered from ears of mixed BM chimeras at day 12 p.i. with 2 × 10⁵ LmSd. The gating strategy is depicted in Fig. S1. (D) Lesion development and pathology scores over the course of infection with 103 LmSd metacyclic promastigotes in the ear dermis of WT, il4−/−, and mixed BM chimeras (n = 4–6). Parasite burdens were quantified at 12 weeks p.i. (E). Values represent mean +/− standard deviation. *P < 0.05 and **P < 0.01 by one-way ANOVA with Dunn’s post-test compared to ‘both’ chimeras (C, D, E). Data are representative of two independent experiments (B, C, D, E).
Fig. 2.
Fig. 2.
IL-4 production by eosinophils is necessary to maintain dermal TRMs during L. major infection. (A) Representative flow cytometry plots showing eGFP+ and hCD2+ cells from IL-4 dual-reporter mice (4get/KN2) at day 12 p.i. with 2 × 10⁵ LmSd. (B, C) The absolute numbers of lymphoid and myeloid subsets (B) or dermal macrophages (C) recovered from eosinophils-depleted animals using anti-SiglecF antibodies at day 12 p.i. with 2 × 10⁵ LmSd. (D) The absolute numbers of myeloid subsets recovered from il5−/− mice at day 12 p.i. with 2 × 10⁵ LmSd. (E) Lesion development and pathology scores over the course of infection with 103 LmSd metacyclic promastigotes in the ear dermis of C57BL/6, il4−/−, and Il5−/− mice (n = 6–10). (F) Intracellular staining of IL-4, IL-5, IL-10, and IL-13 from indicated populations of ear dermal cells recovered from mice (n = 6) infected with 2 × 10⁵ LmSd for 12 days. (G) The absolute numbers of myeloid subsets recovered from WT, eoCre il4/13f/f, and il4−/− mice at day 12 p.i. with 2 × 10⁵ LmSd. (H) Ki67 expression or BrdU incorporation by dermal TRMs from naive or infected WT and eoCre il4/13f/f mice at 12 d p.i. with 2 × 10⁵ LmSd (n = 4–6). (I) Lesion development and pathology scores over the course of infection with 103 LmSd metacyclic promastigotes in the ear dermis of WT, eoCre il4/13f/f, and il4−/− mice (n = 6–10). Parasite burdens were measured at week 12 p.i. (J). (K) Parasite burdens in WT, il4/13f/f, and il4−/− mice were measured at week 5 p.i. with 103 LmSd metacyclic promastigotes (n=6). (L) Measurement of footpad thickness over the course of infection with 106 LmSd metacyclic promastigotes in the footpads of WT (n=5) and eoCre il4/13f/f (n=4). For reference, the side view of footpads at 5 weeks p.i. is shown in lower panel. (M) Parasite burdens were measured at week 5 p.i. Values represent mean +/− standard deviation. *P < 0.05, **P < 0.01, and ***P < 0.001 by non-parametric Mann-Whitney test (B, D, H, L, M) and by one way ANOVA with Dunn’s post-test compared to IgG control (C) or WT infected with LmSd (E, G, I, J, K). Data are representative of two independent experiments (A, B, C, D, E, F, G, I, J).
Fig. 3.
Fig. 3.
CCL24 produced by dermal macrophages mediates in vitro interaction with eosinophils. (A) Immunofluorescence staining and confocal microscopy on vertical sections of an infected ear showing LmSd-RFP (white), SiglecF (green), MR (magenta) and DAPI (blue). Images in 1–4 show boxed areas at higher magnification. (B) Percentages of eosinophils interacting with dermal macrophages in naïve, non-inflamed, and inflamed regions (n = 6) of ear at 8 days p.i. with 2 × 10⁵ RFP+ LmSd. (C) Trans-well migration of eosinophils from upper chamber to lower chamber containing BMDM treated or non-treated for 72 hours with either IL-4, IL-10, or IL-4/10, compared to cytokine-only controls (n = 6). (D) Trans-well migration of eosinophils from upper chamber to lower chamber containing BMDM treated or non-treated with either IL-4, IL-10, IL-13, IL-4/10, or IL-4/13, compared to cytokine-only controls, and infected or uninfected with LmSd (n = 4). (E) Chemokine array from supernatants of BMDM treated or non-treated for 72 hours with either IL-4, IL-10, or IL-4/10 (n = 6). (F) The number of migrating eosinophils from upper chamber to lower chamber containing IL-4/10 treated BMDMs in the presence of increasing concentrations of anti-CCL24 neutralizing antibodies (n = 6). (G) Representative in vitro live imaging and quantification of interactions between co-cultured eosinophils (red), neutrophils (green), and IL-4/10 stimulated BMDMs (purple) treated with anti-CCL24 antibody or control IgG. (H) Chemokine array from supernatants of dermal macrophages and monocytes/moDCs sorted from naïve wild type mice and mice (n = 4) treated for 72 hr with either IL-4, IL-10, or IL-4/10. (I, J) Representative dot plots and graphs showing the percent of dermal TRMs with intracellular staining of CCL24 in mice (n = 4–6) infected with 2 × 10⁵ LmSd-GFP. (K) The number of eosinophils at days 2 and 4 p.i. with 2 × 10⁵ LmSd in wild type mice (n = 4) treated with anti-CCL24 antibody or control IgG. Values represent mean +/− standard deviation, *P < 0.05, **P < 0.01, and ***P < 0.001 by non-parametric Mann-Whitney test (F, G, K) and by one-way ANOVA with Dunn’s post-test compared to non-treated (C, E, H), naïve (I), or WT (J). Data are representative of over five (A, B), two (C, D, E, F, G, H, I, J, K) independent experiments.
Fig. 4.
Fig. 4.
Eosinophils show stable interaction with dermal TRMs in steady state. (A, B) IVM time-lapse image from the ear of a C57BL/6 mouse injected with manocept-Alexa488 to label MRhi dermal TRMs and Evans blue for blood vessels. Data are representative of over ten independent mouse experiments. (C) Representative flow cytometry plots showing tdTomato+ eosinophils from eoCre ROSA-LSL-tdTomato reporter mouse. (D) Image obtained from a IVM of the ear of naïve eoCre ROSA-LSL-tdTomato reporter mouse. Areas devoid of TRMs are demarcated by dotted lines. (E) IVM images from the ears of a naïve eoCre ROSA-LSL-tdTomato mouse. Panel labeled “Tracks” show the paths followed by tdTomato+ eosinophils over 50 min. Bottom panels labeled “1” and “2” are time-lapse images from boxed region in upper left panel. (F, G, and H) violin plots showing the average speed, migration distance, and mean duration of contact (with dermal TRMs) of eosinophils. Stratification of the cells according to their bimodal distribution of average speed (colored red or black), was applied to the other behavior parameters. Data are representative of over four independent mouse experiments (D, E, F, G, H), (I) The number of eosinophils in ear and peripheral blood in mice (n = 4) following administration of either isotype control or anti-CCL24 Abs for 3 consecutive days. Values represent mean +/− S.D., *P < 0.05 by non-parametric Mann-Whitney test (I). Data are representative of two independent experiments (I).
Fig. 5.
Fig. 5.
CCL24 promotes eosinophil migration, morphological changes, and interaction with dermal TRMs during infection. (A, B) IVM images from the ears of eoCre ROSA-LSL-tdTomato mice infected intradermally with 2 × 10⁵ LmSd and treated with CCL24 neutralizing antibodies or control IgG. Panels labeled “Tracks” show the paths followed by tdTomato+ eosinophils over 50 min. The areas devoid of dermal TRMs are demarcated by dotted lines. (C–G) Eosinophil average speed of movement, migration distance, sphericity, mean duration of contact with dermal TRMs, and average of colocalization with dermal TRMs were analyzed from IVM images represented in panels (A) and (B). The numbers in panel (C) indicate the total number of trackable eosinophils in one field of view. Surface rendered eosinophils at day 3 post infection were plotted in right panel of (E) in order of low to high sphericity. Values represent mean +/− standard deviation. *P < 0.05 and **P < 0.01 by non-parametric Mann-Whitney test (E, F) to compare two samples. Data are representative of three independent experiments (A–G).
Fig. 6.
Fig. 6.
Dermal TRMs from infected eoCre il4/13f/f mice show pro-inflammatory transcriptional profiles compared to dermal TRMs from infected WT mice. (A) Heatmap displaying scaled FPKM expression values of differentially expressed genes (DEGs) of dermal TRMs from L.major infected WT and eoCre il4/13f/f mice. DEGs with absolute fold change > 1.5 and p < 0.05 (total 516 genes) are selected. Genes (row) and samples (column) are clustered using hierarchical clustering based on Pearson Correlation distance. (B) Visualization of results from gene set enrichment analysis using pre-Ranked selected genes (274 upregulated and 242 downregulated DEGs are used). Gene-concept network depicts the linkages of genes and biological GO terms as a network. The size of GO terms (grey) represents the number of genes connected and the color of each genes indicates rank-scores (from −4.79 to 4.79): red, up-regulated and blue, down-regulated in dermal TRMs of eoCre il4/13f/f compared to WT mice. (C) Venn diagram (upper panel) shows 37 overlapping genes between DEGs from IL-4/13 treated vs. non-treated BMDMs and from dermal TRMs of WT vs eoCre il4/13f/f mice. Heatmaps display the differentially expressed values of the overlapping genes from in vitro BMDM on the left (log2(foldchange)) and in vivo dermal TRMs from WT vs eoCre il4/13f/f mice on the right panel (FPKM with Row Z-score). Genes with the same expression pattern between in vitro BMDM and in vivo dermal TRMs are highlighted in red (up) or blue (down) boxes. (D) Plot of upstream regulators predicted using Ingenuity Pathway Analysis (IPA). The 516 DEGs identified between dermal TRMs of infected eoCre il4/13f/f vs WT mice were used as input. Only regulators in the ‘cytokine’ molecular type were selected from the results and used for visualization. Regulators with activation Z score (>2 or <−2, respectively, with 97.72% confidence) and p-value of overlap (<0.05) are considered significantly activated (red) or inhibited (blue) in dermal TRMs from eoCre il4/13f/f mice vs. WT mice.
Fig. 7.
Fig. 7.
The IL4-CCL24 axis mediates eosinophil influx and interaction with peritoneal macrophages in peritoneal Ascaris infection. (A, C) Quantification of CCL24 from peritoneal fluids harvested from naïve mice (n = 3) or (A) mice (n = 6) infected i.p. with 10,000 Ascaris eggs for 72 hours and treated with IL-4 neutralizing mAbs or control IgG, or (C) wild type and eoCre il4/13f/f infected mice (n = 4). (B, D) The number of eosinophils and peritoneal macrophages in peritoneal fluids harvested from naïve mice (n = 3–4) or (B) Ascaris infected mice (n = 6) treated with IL-4 neutralizing mAbs or control IgG, or (D) wild type and eoCre il4/13f/f infected mice treated with CCL24 neutralizing mAbs or control IgG (n =4). (E) Ki67 expression or BrdU incorporation by dermal TRMs from naive or infected WT and eoCre il4/13f/f mice with 10,000 Ascaris eggs for 72 hours (n = 4). (F) Representative ex vivo live imaging of fluorescence antibody-labeled SiglecF+ eosinophils and F4/80+ peritoneal macrophages from Ascaris-infected peritoneal isolates incubated with anti-CCL24 antibody or control IgG. Images in 1 and 2 show boxed areas at higher magnification. Arrow heads indicate eosinophilic materials transferred to or phagocytosed by F4/80+ peritoneal macrophages. Green-colored tracks show the paths followed by SiglecF+ eosinophils over 4-hour imaging. (G) Eosinophil average speed of movement and migration distance were analyzed from live imaging represented in panel (F). (H) Quantification of CCL24 released from various TRMs sorted from naïve animals (n = 2–3) and cultured for 3 days in vitro with indicated cytokines. (I) Comparison of CCL24 transcription from various immune cells published by Immgen(32). The relative expression of CCL24 gene is shown as a heat map among the indicated populations. Each square represents either a specified subset of TRMs (top row) or populations of the specified cells isolated from different organs. Values represent mean +/− standard deviation. *P < 0.05, **P < 0.01, and ****P < 0.0001 by non-parametric Mann-Whitney test (A, B, C, D, E) to compare two samples and by one-way ANOVA with Dunn’s post-test compared to naïve (A, B, C), and IgG (G). Data are representative of two (A–E, H) or four (F) independent experiments.

Similar articles

Cited by

References

    1. Davies LC, Jenkins SJ, Allen JE, Taylor PR, Tissue-resident macrophages. Nat Immunol 14, 986–995 (2013). - PMC - PubMed
    1. Davies LC, Taylor PR, Tissue-resident macrophages: then and now. Immunology 144, 541–548 (2015). - PMC - PubMed
    1. Ginhoux F, Guilliams M, Tissue-Resident Macrophage Ontogeny and Homeostasis. Immunity 44, 439–449 (2016). - PubMed
    1. Gautier EL et al., Gene-expression profiles and transcriptional regulatory pathways that underlie the identity and diversity of mouse tissue macrophages. Nat Immunol 13, 1118–1128 (2012). - PMC - PubMed
    1. Lavin Y et al., Tissue-resident macrophage enhancer landscapes are shaped by the local microenvironment. Cell 159, 1312–1326 (2014). - PMC - PubMed

Publication types