. 2020 Mar 19:14:63.
doi: 10.3389/fncel.2020.00063. eCollection 2020.

Advantages of Acute Brain Slices Prepared at Physiological Temperature in the Characterization of Synaptic Functions

Affiliations

Advantages of Acute Brain Slices Prepared at Physiological Temperature in the Characterization of Synaptic Functions

Kohgaku Eguchi et al. Front Cell Neurosci. .

Abstract

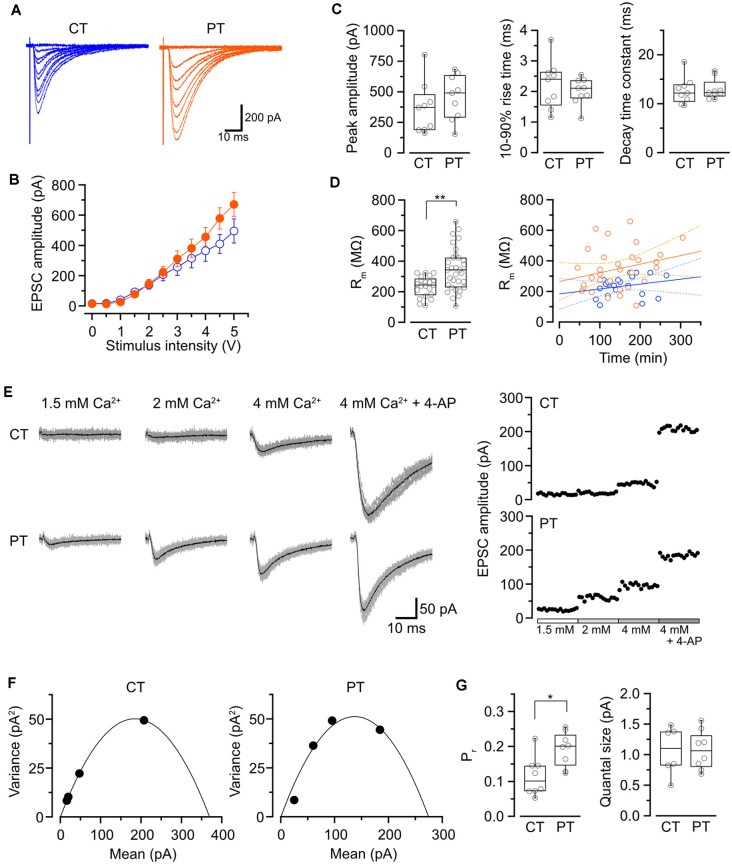
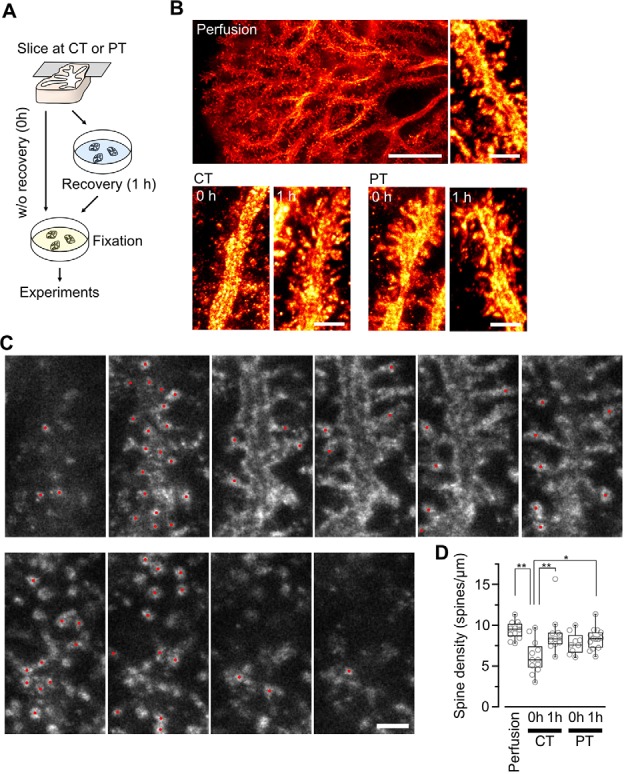
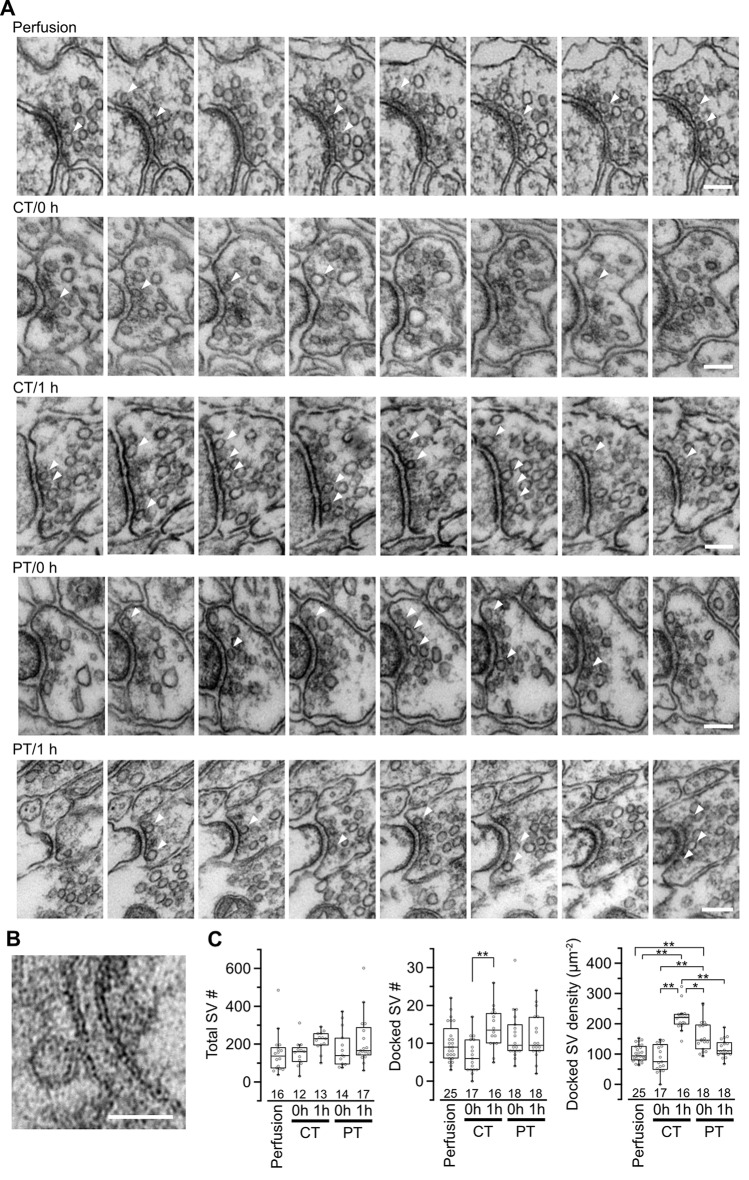
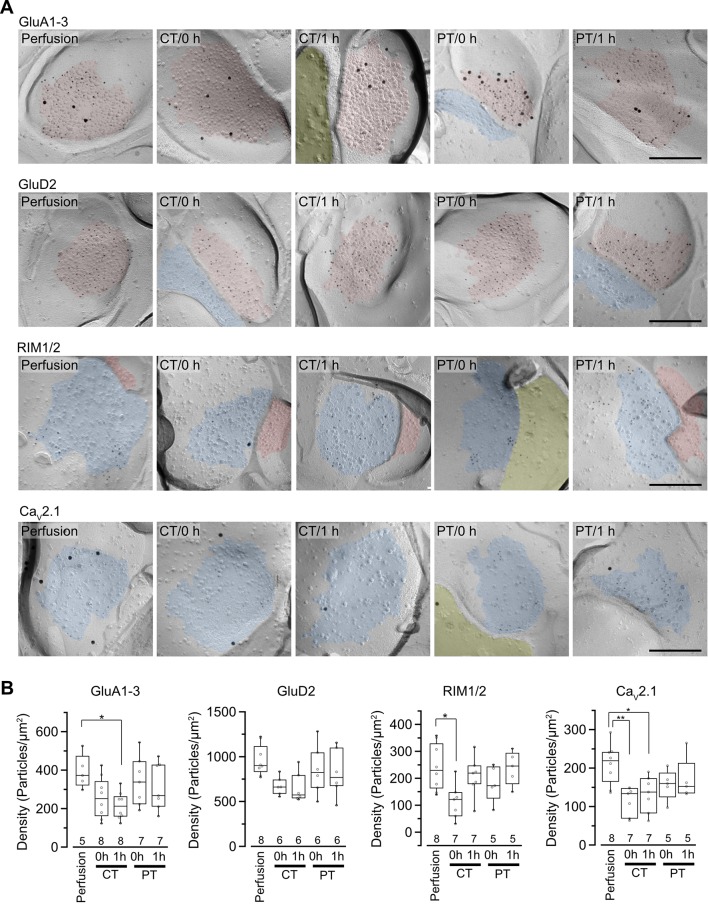
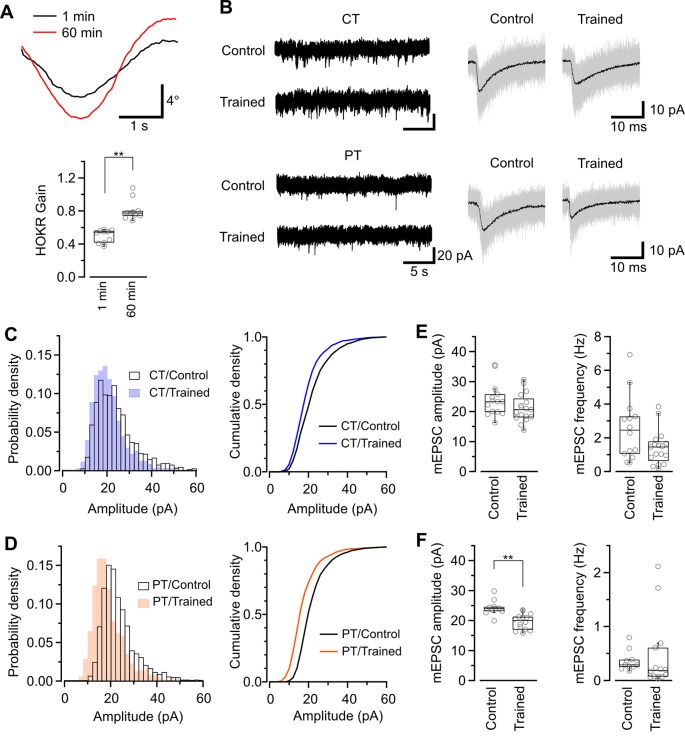
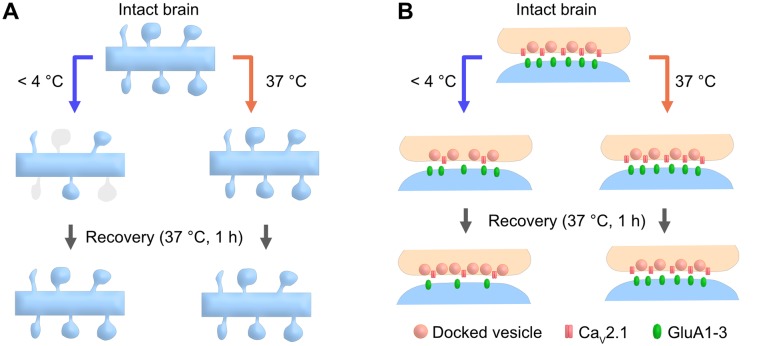
Acute brain slice preparation is a powerful experimental model for investigating the characteristics of synaptic function in the brain. Although brain tissue is usually cut at ice-cold temperature (CT) to facilitate slicing and avoid neuronal damage, exposure to CT causes molecular and architectural changes of synapses. To address these issues, we investigated ultrastructural and electrophysiological features of synapses in mouse acute cerebellar slices prepared at ice-cold and physiological temperature (PT). In the slices prepared at CT, we found significant spine loss and reconstruction, synaptic vesicle rearrangement and decrease in synaptic proteins, all of which were not detected in slices prepared at PT. Consistent with these structural findings, slices prepared at PT showed higher release probability. Furthermore, preparation at PT allows electrophysiological recording immediately after slicing resulting in higher detectability of long-term depression (LTD) after motor learning compared with that at CT. These results indicate substantial advantages of the slice preparation at PT for investigating synaptic functions in different physiological conditions.

Keywords: acute brain slices; cerebellum; electron microscopy; patch-clamp recording; super-resolution microscopy; synaptic plasticity; synaptic transmission.


Figures

Figure 1
Figure 1
Influence of the temperatures during slicing on synaptic transmission in PC-PF synapses. (A) Representative evoked EPSC traces elicited by several stimulus intensities (0–5 V, 0.5 V steps, superimposed) recorded from PCs in the slices prepared at CT (left) and PT (right). (B) The relationship of evoked EPSC amplitude and stimulus intensity recorded from PCs in the slices prepared at CT (blue, n = 9 cells) and PT (orange, n = 9 cells). (C) Summary of the peak amplitude (left), 10–90% rise time (middle) and decay time constant (right) of EPSCs (evoked by a 4-V stimulation) in cold- and warm-cut cerebellar slices. Each scatter indicates the mean value obtained from an individual PC (n = 9 cells for each). No significant difference was detected between CT and PT (amplitude: P = 0.34, rise time: P = 0.49, decay time constant: P = 0.82, n = 9 cells each, Welch’s t-test). (D) Left, membrane resistance (Rm) of PCs in the slices prepared at CT (n = 23) and PT (n = 33). The PCs in warm-cut slices showed higher Rm than that in cold-cut slices (P < 0.01, Welch’s t-test). Right, the relationship between Rm vs. time after slicing (CT: n = 21, blue; PT: n = 30, orange) with linear fits (solid lines) and 95% confidence interval (dashed lines). Neither slices prepared at CT nor PT showed significance of the correlation coefficient (CT: r = 0.24, P = 0.29; PT: r = 0.32, P = 0.08). (E) Representative evoked EPSC traces (left) and plots of the amplitude (right) in various [Ca2+]out recorded from a PC in the slice prepared at CT (top) and PT (bottom). In the EPSC traces, gray traces show the individual 15 traces and black traces indicate their averages. (F) Mean-variance (M-V) relationship of evoked EPSCs obtained from the amplitudes shown in (E). The plots were fitted by a parabola equation. (G) Summary of the release probability at 2 mM [Ca2+]out (Pr, left) and the quantal size (right) of PF-PC synapses in slices prepared at CT or PT estimated by M-V analysis. Each scatter indicates the mean value obtained from an individual PC. Pr recorded from the warm-cut slices (n = 8 cells) shows a significantly higher value than that from the cold-cut slices (n = 8 cells, P < 0.05, Welch’s t-test), whereas no significant difference in quantal size was detected between slices prepared at CT and PT (CT: n = 6 cells, PT: n = 8 cells, P = 0.96). Asterisks indicate significant differences (*P < 0.05, **P < 0.01, Welch’s t-test).
Figure 2
Figure 2
Spine density of Purkinje cells in acute cerebellar slices prepared at CT and physiological temperatures (PT). (A) A scheme of the experimental procedure for brain slicing and fixation. Acute cerebellar slices prepared at CT and PT were immersion-fixed in the fixatives immediately after slicing without recovery (0 h) or after recovery in normal ACSF at 37°C for 1 h (1 h). This procedure was common with the other experiments shown in Figures 3, 4. (B) Representative super-resolution STED image of PC dendrites and spines in perfusion-fixed cerebellar tissue (top, scale bar = 10 μm for left, 2 μm for right) and in immersion-fixed acute cerebellar slices (bottom, scale bar = 2 μm). The images show maximum projections of 20 z-slices, corresponding to 1.8 μm. (C) Counting dendritic spines observed with a 3D STED microscope. Representative z-stack images of a PC dendrite with spines. Red circles indicate individual spines. Scale bar = 1 μm. Optical sections are spaced by 90 nm in the z-direction. (D) Summary of the dendritic spine density of PCs in perfusion-fixed, cold-cut and warm-cut slice preparations. Each scatter indicates a value obtained from an individual dendrite (perfusion-fixed: n = 12 dendrites, CT/0 h: n = 12 dendrites, CT/1 h: n = 11 dendrites, PT/0 h: n = 9 dendrites, PT/1 h: n = 14 dendrites). Asterisks indicate significant differences (*P < 0.05, **P < 0.01, one-way ANOVA with post hoc Tukey–Kramer test).
Figure 3
Figure 3
Synaptic vesicle distribution in parallel fiber boutons on PF-PC synapses. (A) Example images of serial ultrathin sections (40-nm interval) of PF boutons in perfusion-fixed tissue and immersion-fixed acute cerebellar slices with (1 h) or without (0 h) 1-h recovery time. Arrowheads indicate dSVs. Scale bar = 100 nm. (B) An example image of a dSV, which is located within 5 nm from the AZ membrane in the perfusion-fixed tissue. Scale bar = 50 nm. (C) Summary of the total SV number in presynaptic boutons (left), the dSV number (middle) and density (right) at AZs. Each scatter indicates a value obtained from an individual bouton. Numerals in the plot indicate the numbers of analyzed boutons for each group. Asterisks indicate significant differences (*P < 0.05, **P < 0.01, Kruskal–Wallis H test with post hoc Mann-Whitney U-test with Bonferroni correction).
Figure 4
Figure 4
Distribution of synaptic proteins in postsynaptic density (PSD) and AZs. (A) Representative images of freeze-fracture replicas of PF-PC synapses labeled for GluA1–3, GluD2, RIM1/2 and CaV2.1 (5-nm gold) with PF-PC markers (GluD2 for GluA1–3, VGluT1 for RIM1/2 and CaV2.1, 15-nm gold). PSD on the exoplasmic face (E-face), AZs on the protoplasmic face (P-face) and cross-fractured cytoplasm were indicated with red, blue and yellow, respectively. Scale bar = 200 nm. (B) Summary of gold particle density for GluA1–3, GluD2, RIM1/2, and CaV2.1 on PSD or AZs. Each scatter indicates the mean value obtained from an individual replica. Numerals in the plot indicate the numbers of analyzed replicas for each group. Asterisks indicate significant differences (*P < 0.05, **P < 0.01, one-way ANOVA with post hoc Tukey–Kramer test).
Figure 5
Figure 5
Application of warm-cutting slice preparation method to the detection of long-term depression (LTD) by HOKR training. (A) HOKR adaptation. Top, representative eye-movement traces of a mouse before and after 1-h HOKR training. Bottom, HOKR gain changes induced by 1-h HOKR training (P < 0.01, paired t-test). Each scatter indicates the mean value obtained from individual animals (n = 10 animals for each). (B) Representative traces of spontaneous mEPSC events recorded from PCs at cerebellar flocculus of untrained (control) and trained mice. Right, superimposed mEPSC traces (50 events, gray). and average of the events (black traces). (C,D) Histogram (left) and cumulative curve (right) of mEPSC amplitude distribution recorded from PCs in cold-cut (C) and warm-cut (D) slices of control and HOKR-trained mice. (E,F) Box plot of mEPSC amplitudes (left) and frequency (right) recorded from PCs in cold-cut (E) and warm-cut (F) slices of control and HOKR-trained mice. Each scatter indicates the mean amplitude and frequency of mEPSCs obtained from an individual PC (CT/control: n = 14 cells, CT/trained: n = 17 cells, PT/control: n = 10 cells, PT/trained: n = 14 cells). Asterisks indicate significant differences (**P < 0.01, Welch’s t-test).
Figure 6
Figure 6
Cartoon schematic demonstrating the advantages of the warm-cutting method compared to the cold-cutting method. (A) In cold-cut cerebellar slices, a part of dendritic spines along the PC dendrite transiently disappear by exposure to cold temperature and then recover after 1-h incubation at 37°C, whereas slicing at PT does not cause any changes in spine density. (B) In cold-cut cerebellar slices, pre- and postsynaptic components including docked SV density, CaV2.1 density and AMPAR density change during slicing and/or recovery time, whereas slicing at PT does not cause these changes.

Similar articles

Cited by

References

    1. Aziz W., Wang W., Kesaf S., Mohamed A. A., Fukazawa Y., Shigemoto R. (2014). Distinct kinetics of synaptic structural plasticity, memory formation and memory decay in massed and spaced learning. Proc. Natl. Acad. Sci. U S A 111, E194–E202. 10.1073/pnas.1303317110 - DOI - PMC - PubMed
    1. Bischofberger J., Engel D., Li L., Geiger J. R. P., Jonas P. (2006). Patch-clamp recording from mossy fiber terminals in hippocampal slices. Nat. Protoc. 1, 2075–2081. 10.1038/nprot.2006.312 - DOI - PubMed
    1. Bissen D., Foss F., Acker-Palmer A. (2019). AMPA receptors and their minions: auxiliary proteins in AMPA receptor trafficking. Cell. Mol. Life Sci. 76, 2133–2169. 10.1007/s00018-019-03068-7 - DOI - PMC - PubMed
    1. Bourne J. N., Kirov S. A., Sorra K. E., Harris K. M. (2007). Warmer preparation of hippocampal slices prevents synapse proliferation that might obscure LTP-related structural plasticity. Neuropharmacology 52, 55–59. 10.1016/j.neuropharm.2006.06.020 - DOI - PubMed
    1. Cingolani L. A., Goda Y. (2008). Actin in action: the interplay between the actin cytoskeleton and synaptic efficacy. Nat. Rev. Neurosci. 9, 344–356. 10.1038/nrn2373 - DOI - PubMed

LinkOut - more resources