

Paclitaxel-Loaded Macrophage Membrane Camouflaged Albumin Nanoparticles for Targeted Cancer Therapy
- PMID: 32256068
- PMCID: PMC7090179
- DOI: 10.2147/IJN.S244849
Paclitaxel-Loaded Macrophage Membrane Camouflaged Albumin Nanoparticles for Targeted Cancer Therapy
Abstract
Background: Melanoma is the most common symptom of aggressive skin cancer, and it has become a serious health concern worldwide in recent years. The metastasis rate of malignant melanoma remains high, and it is highly difficult to cure with the currently available treatment options. Effective yet safe therapeutic options are still lacking. Alternative treatment options are in great demand to improve the therapeutic outcome against advanced melanoma. This study aimed to develop albumin nanoparticles (ANPs) coated with macrophage plasma membranes (RANPs) loaded with paclitaxel (PTX) to achieve targeted therapy against malignant melanoma.
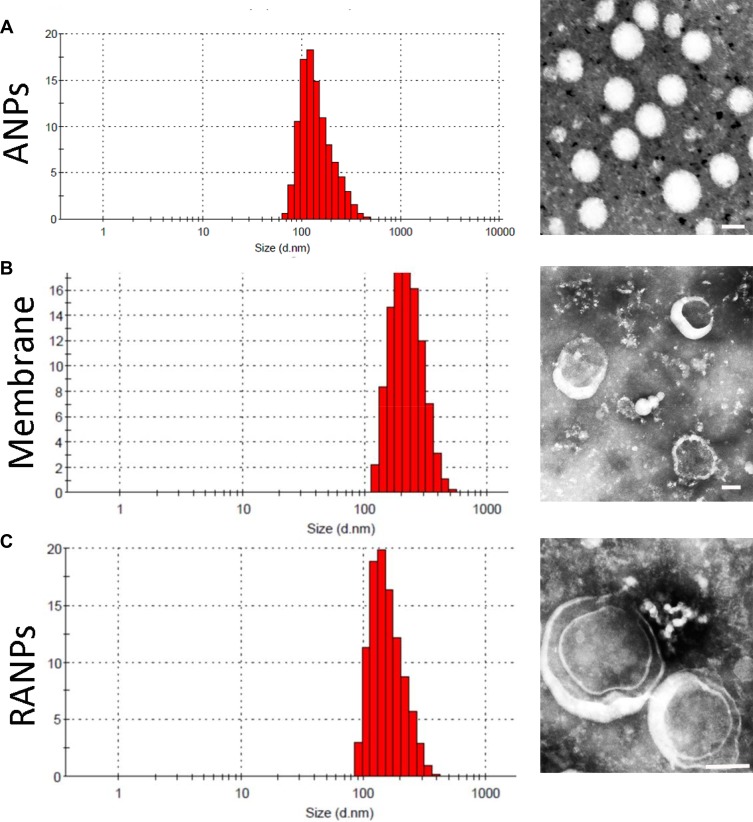
Methods: Membrane derivations were achieved by using a combination of hypotonic lysis, mechanical membrane fragmentation, and differential centrifugation to empty the harvested cells of their intracellular contents. The collected membrane was then physically extruded through a 400 nm porous polycarbonate membrane to form macrophage cell membrane vesicles. Albumin nanoparticles were prepared through a well-studied nanoprecipitation process. At last, the two components were then coextruded through a 200 nm porous polycarbonate membrane.
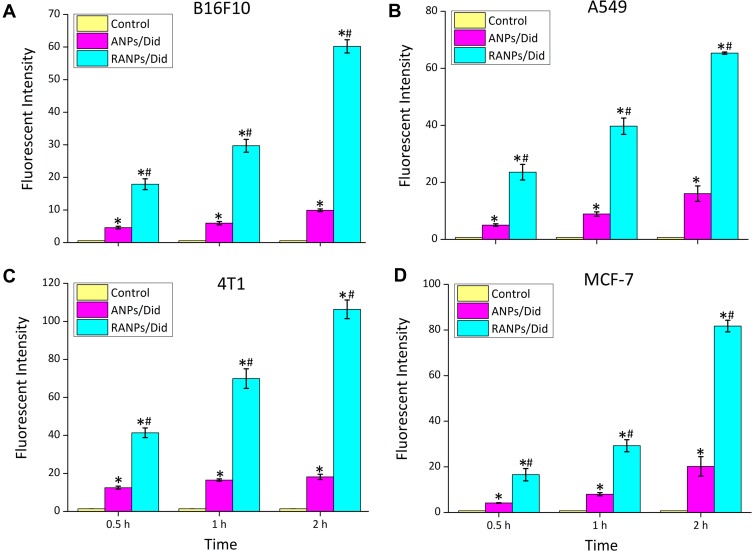
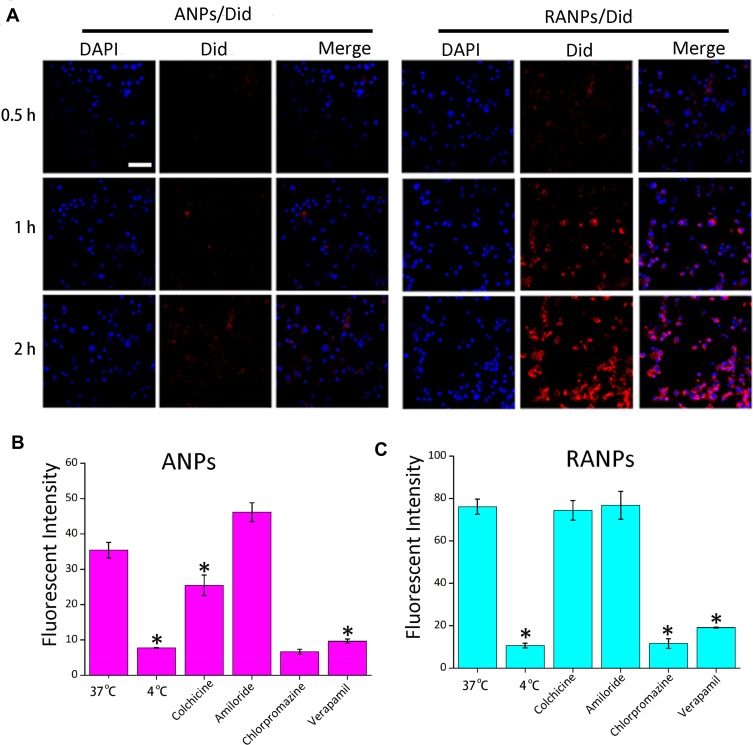
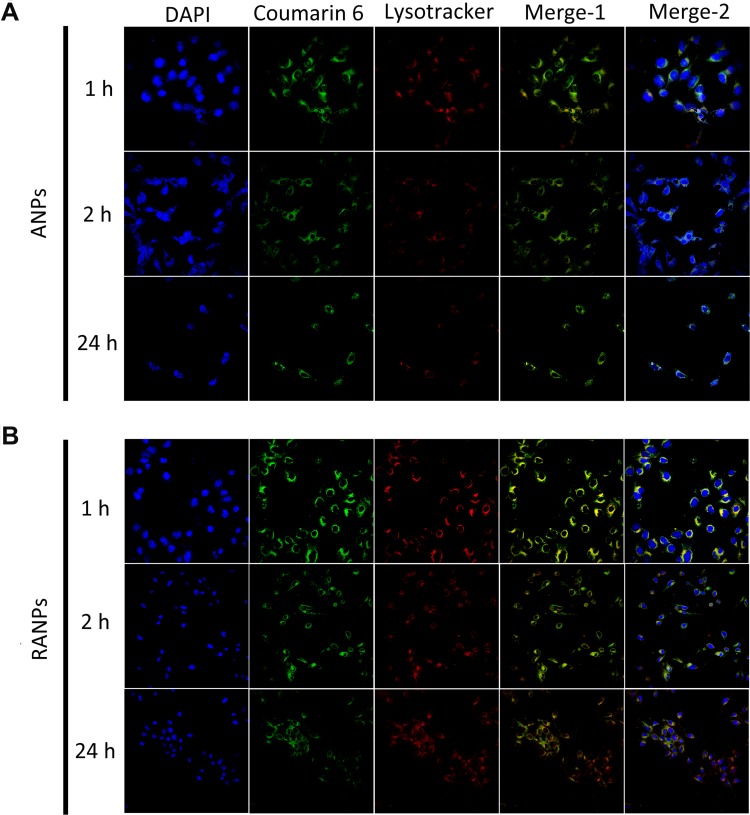
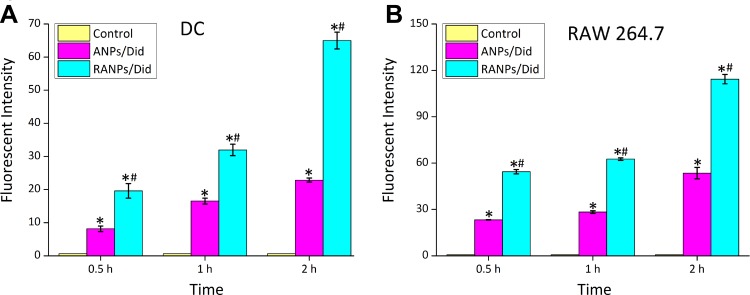
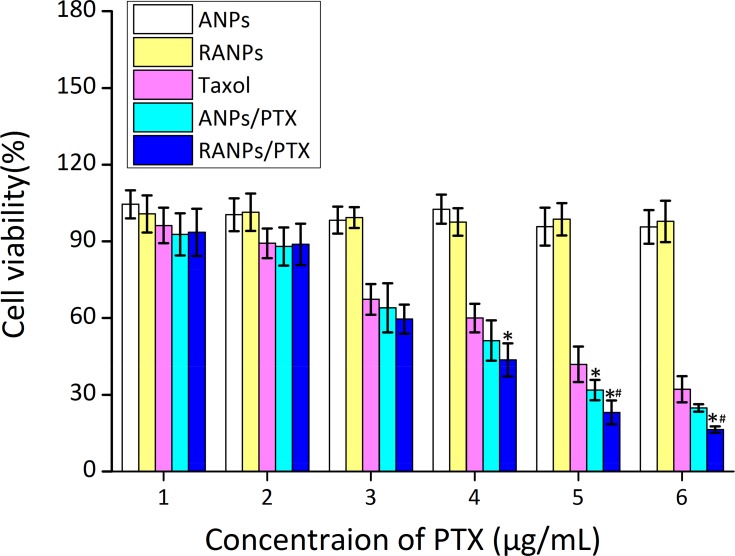
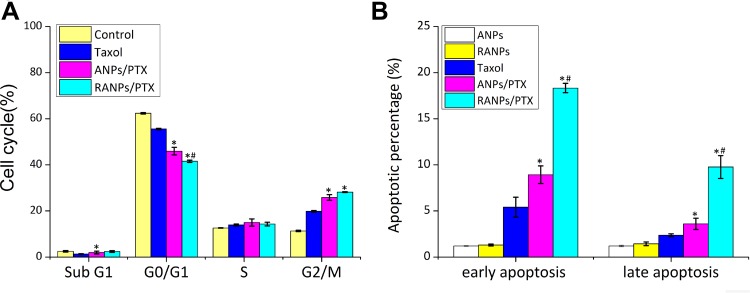
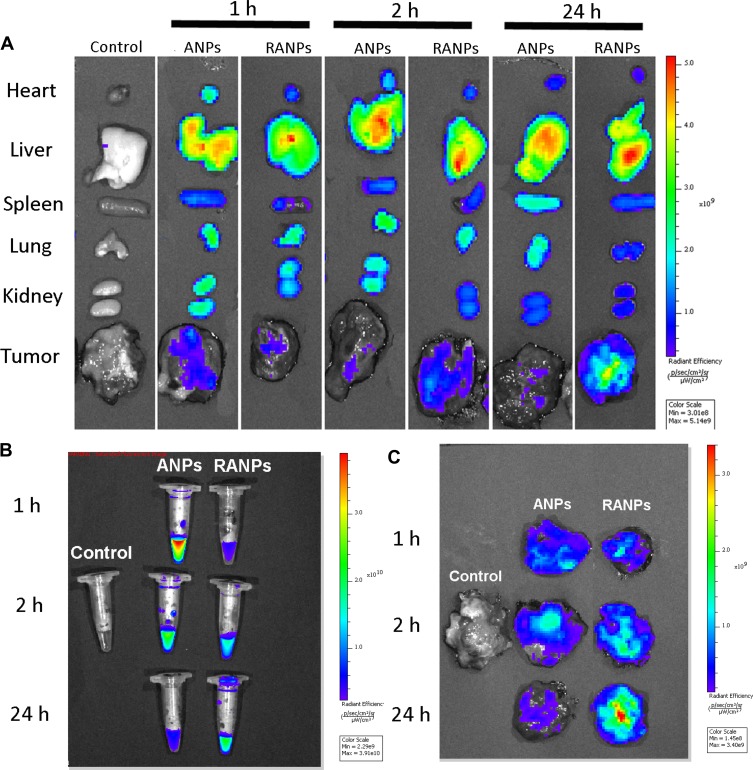
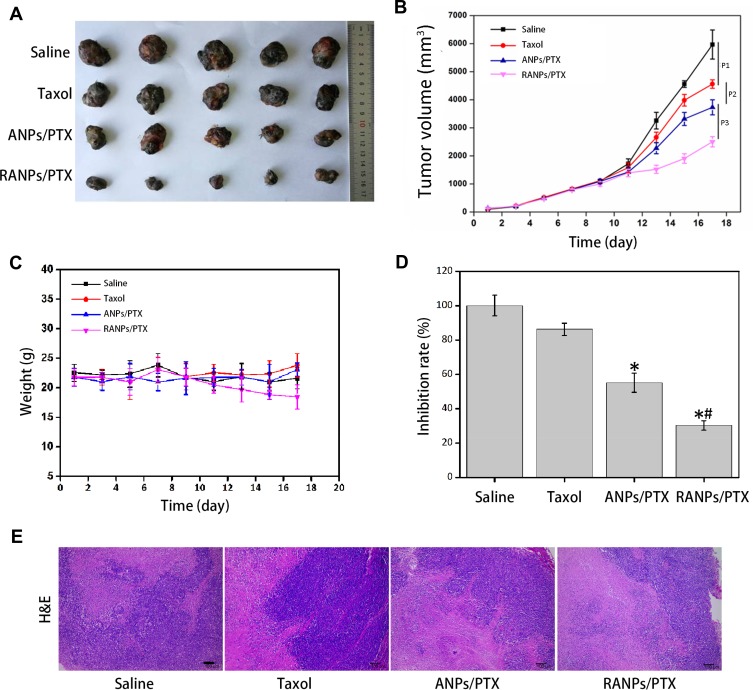
Results: Using paclitaxel as the model drug, PTX-loaded RANPs displayed significantly enhanced cytotoxicity and apoptosis rates compared to albumin nanoparticles without membrane coating in the murine melanoma cell line B16F10. RANPs also exhibited significantly higher internalization efficiency in B16F10 cells than albumin nanoparticles without a membrane coating. Next, a B16F10 tumor xenograft mouse model was established to explore the biodistribution profiles of RANPs, which showed prolonged blood circulation and selective accumulation at the tumor site. PTX-loaded RANPs also demonstrated greatly improved antitumor efficacy in B16F10 tumor-bearing mouse xenografts.
Conclusion: Albumin-based nanoscale delivery systems coated with macrophage plasma membranes offer a highly promising approach to achieve tumor-targeted therapy following systemic administration.
Keywords: albumin nanoparticles; macrophage membrane; melanoma; paclitaxel; tumor-targeted therapy.
© 2020 Cao et al.
Conflict of interest statement
The authors report no conflicts of interest in this work.
Figures
Similar articles
-
Bioinspired tumor-homing nanoplatform for co-delivery of paclitaxel and siRNA-E7 to HPV-related cervical malignancies for synergistic therapy.Theranostics. 2020 Feb 10;10(7):3325-3339. doi: 10.7150/thno.41228. eCollection 2020. Theranostics. 2020. PMID: 32194871 Free PMC article.
-
Liposome encapsulated albumin-paclitaxel nanoparticle for enhanced antitumor efficacy.Pharm Res. 2015 Mar;32(3):1002-16. doi: 10.1007/s11095-014-1512-2. Epub 2014 Sep 12. Pharm Res. 2015. PMID: 25213777
-
Bio-Mimicking Nanoparticles for Targeted Therapy of Malignant Melanoma.J Biomed Nanotechnol. 2019 May 1;15(5):993-1004. doi: 10.1166/jbn.2019.2739. J Biomed Nanotechnol. 2019. PMID: 30890230
-
Therapeutic Potential of Silver Nitroprusside Nanoparticles for Melanoma.ACS Appl Bio Mater. 2024 Aug 19;7(8):5057-5075. doi: 10.1021/acsabm.4c00597. Epub 2024 Aug 8. ACS Appl Bio Mater. 2024. PMID: 39115261 Review.
-
Cell Membrane-Coated Nanoparticles for Precision Medicine: A Comprehensive Review of Coating Techniques for Tissue-Specific Therapeutics.Int J Mol Sci. 2024 Feb 8;25(4):2071. doi: 10.3390/ijms25042071. Int J Mol Sci. 2024. PMID: 38396747 Free PMC article. Review.
Cited by
-
Macrophages as Promising Carriers for Nanoparticle Delivery in Anticancer Therapy.Int J Nanomedicine. 2023 Aug 8;18:4521-4539. doi: 10.2147/IJN.S421173. eCollection 2023. Int J Nanomedicine. 2023. PMID: 37576466 Free PMC article. Review.
-
Erythrocyte membrane-camouflaged nanoparticles as effective and biocompatible platform: Either autologous or allogeneic erythrocyte-derived.Mater Today Bio. 2022 May 5;15:100279. doi: 10.1016/j.mtbio.2022.100279. eCollection 2022 Jun. Mater Today Bio. 2022. PMID: 35601893 Free PMC article.
-
M1 Macrophage-Biomimetic Targeted Nanoparticles Containing Oxygen Self-Supplied Enzyme for Enhancing the Chemotherapy.Pharmaceutics. 2023 Aug 30;15(9):2243. doi: 10.3390/pharmaceutics15092243. Pharmaceutics. 2023. PMID: 37765212 Free PMC article.
-
Engineered extracellular vesicles-like biomimetic nanoparticles as an emerging platform for targeted cancer therapy.J Nanobiotechnology. 2023 Aug 22;21(1):287. doi: 10.1186/s12951-023-02064-1. J Nanobiotechnology. 2023. PMID: 37608298 Free PMC article. Review.
-
Immunocyte Membrane-Coated Nanoparticles for Cancer Immunotherapy.Cancers (Basel). 2020 Dec 30;13(1):77. doi: 10.3390/cancers13010077. Cancers (Basel). 2020. PMID: 33396603 Free PMC article. Review.
References
MeSH terms
Substances
LinkOut - more resources
Full Text Sources
