. 2020 Apr 2;9(4):1004.
doi: 10.3390/jcm9041004.

Axonopathy and Reduction of Membrane Resistance: Key Features in a New Murine Model of Human GM1-Gangliosidosis

Affiliations

Axonopathy and Reduction of Membrane Resistance: Key Features in a New Murine Model of Human GM1-Gangliosidosis

Deborah Eikelberg et al. J Clin Med. .

Abstract

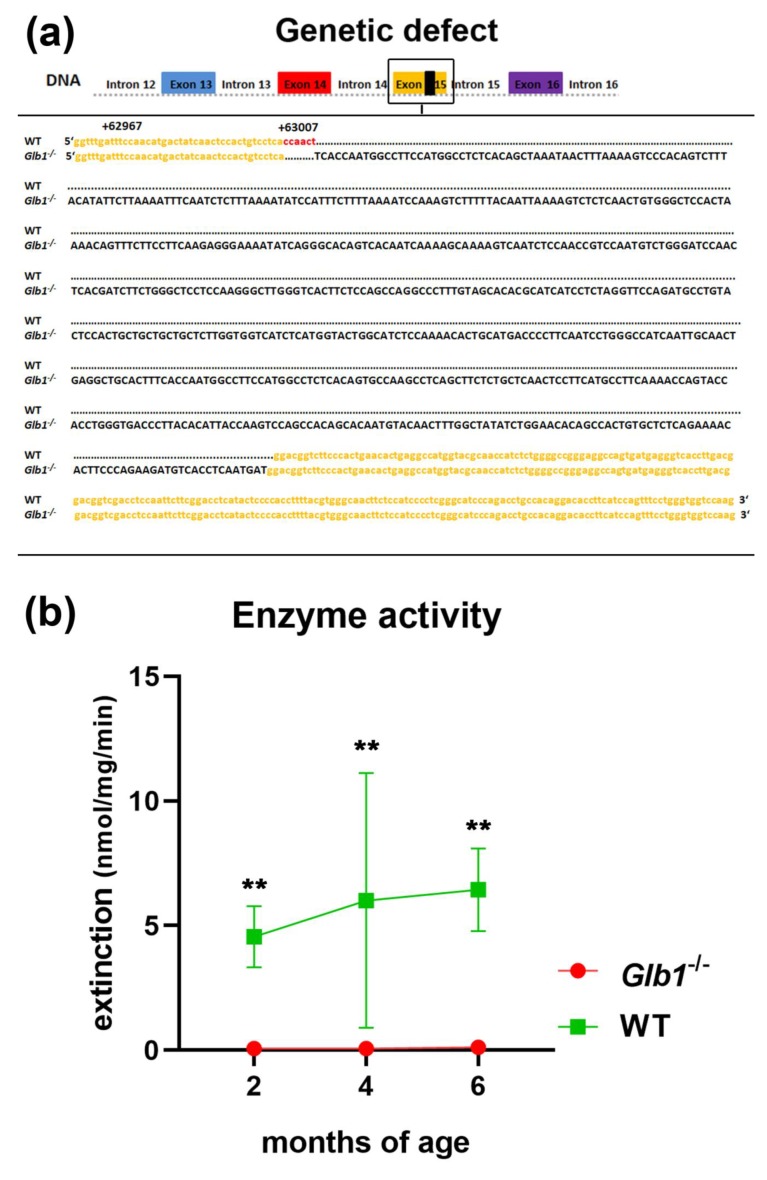
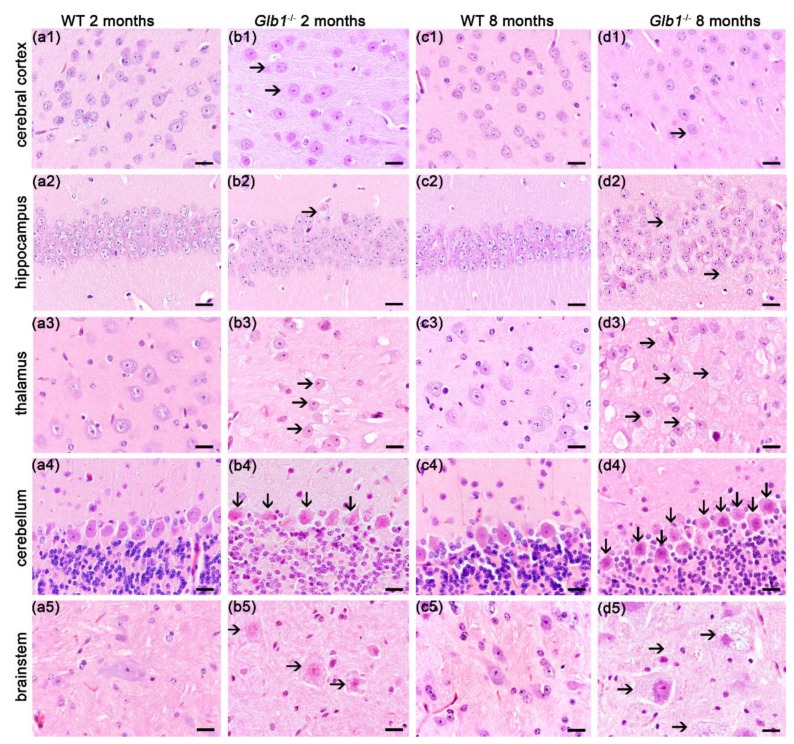
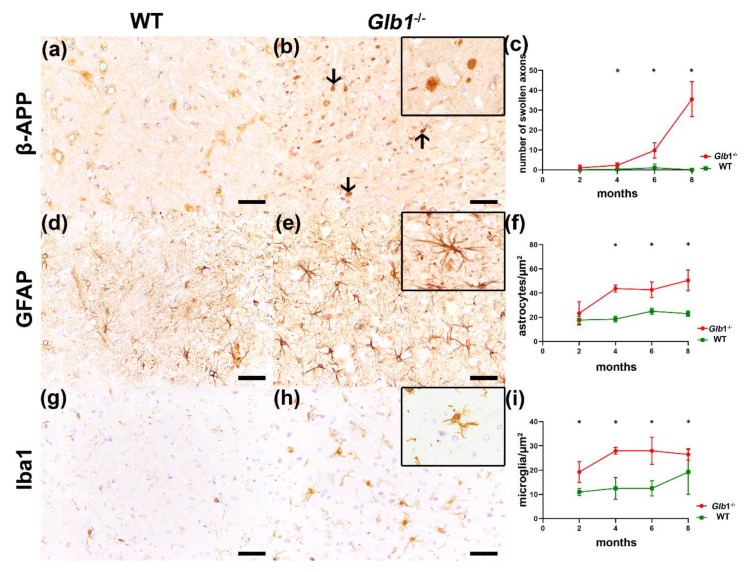
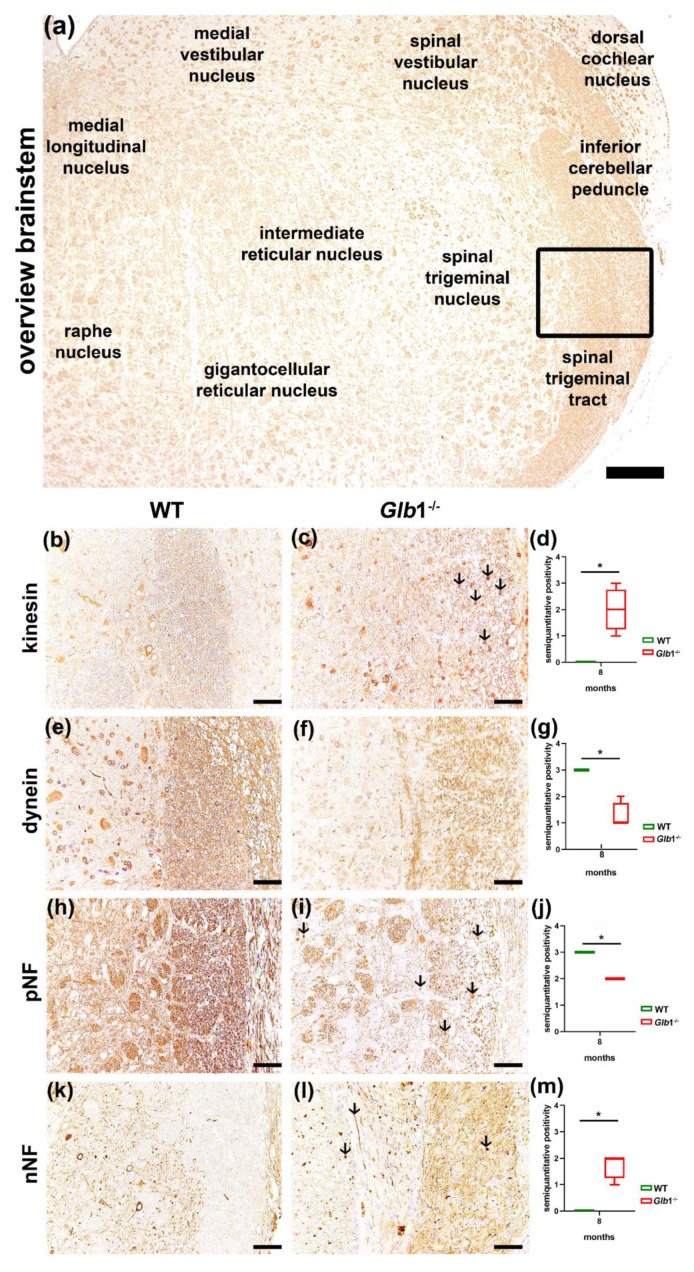
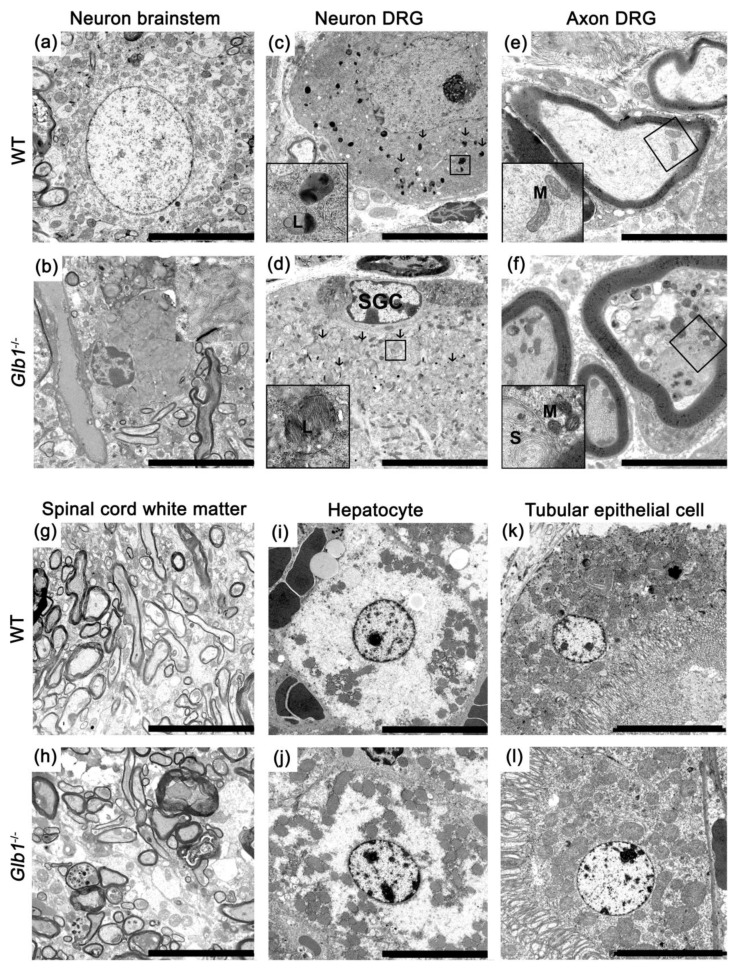
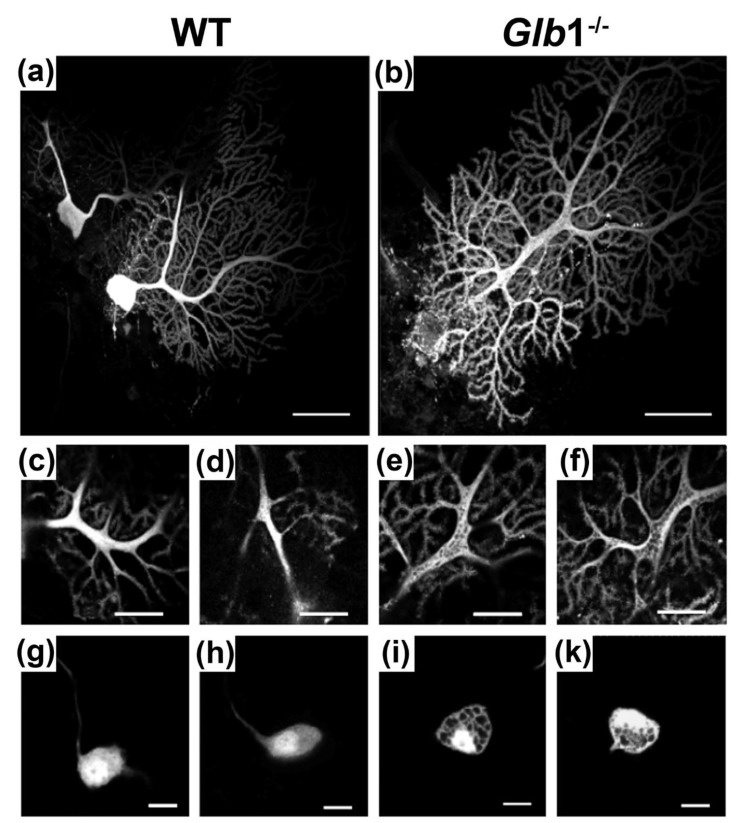
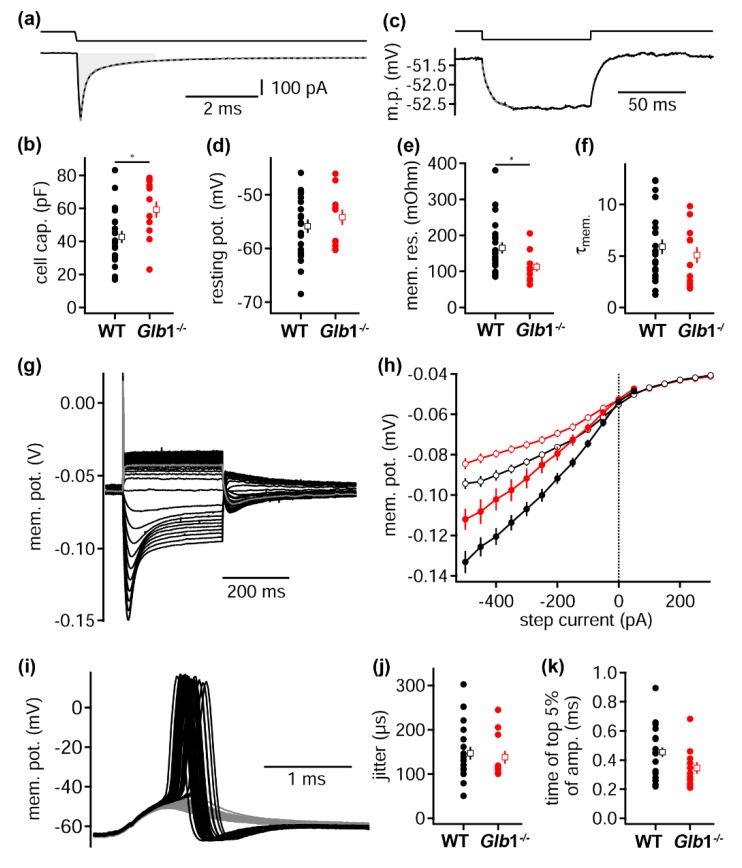
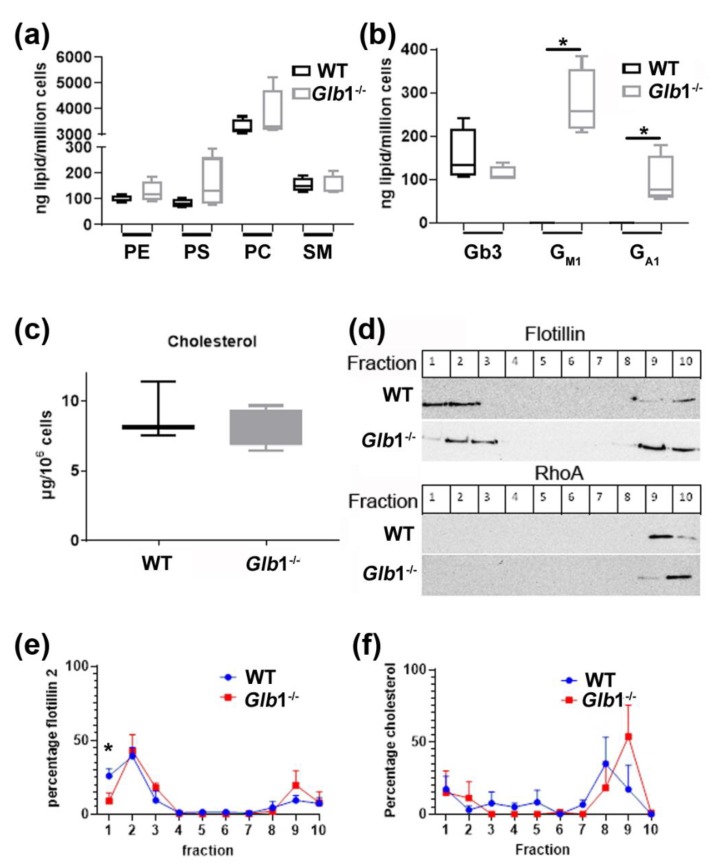
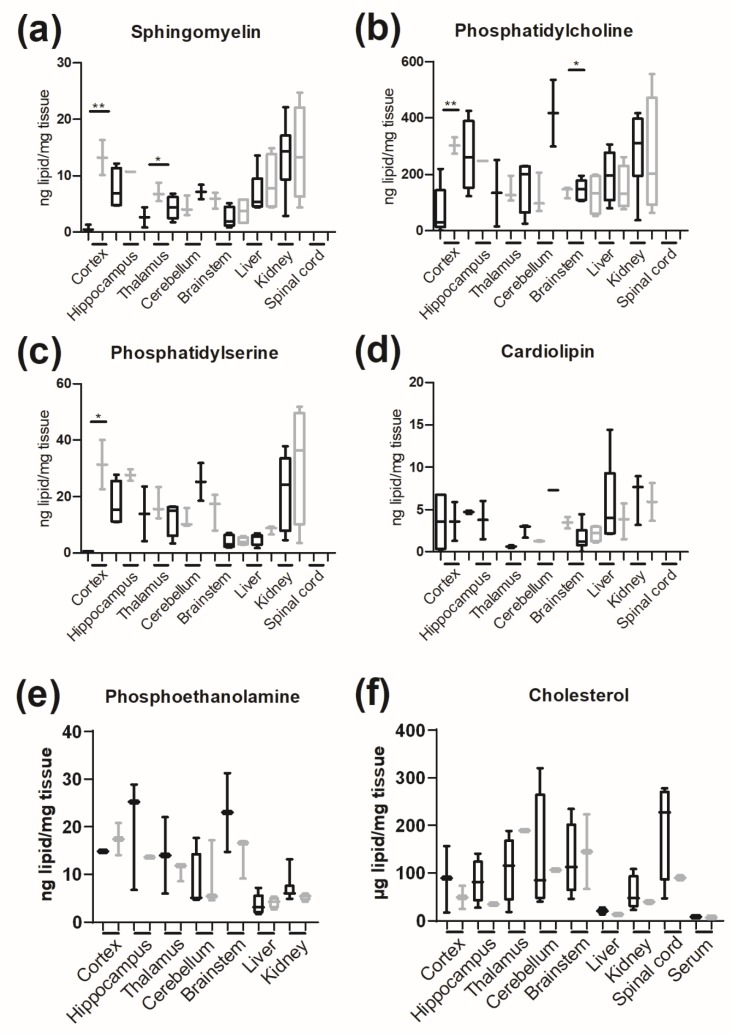
GM1-gangliosidosis is caused by a reduced activity of β-galactosidase (Glb1), resulting in intralysosomal accumulations of GM1. The aim of this study was to reveal the pathogenic mechanisms of GM1-gangliosidosis in a new Glb1 knockout mouse model. Glb1-/- mice were analyzed clinically, histologically, immunohistochemically, electrophysiologically and biochemically. Morphological lesions in the central nervous system were already observed in two-month-old mice, whereas functional deficits, including ataxia and tremor, did not start before 3.5-months of age. This was most likely due to a reduced membrane resistance as a compensatory mechanism. Swollen neurons exhibited intralysosomal storage of lipids extending into axons and amyloid precursor protein positive spheroids. Additionally, axons showed a higher kinesin and lower dynein immunoreactivity compared to wildtype controls. Glb1-/- mice also demonstrated loss of phosphorylated neurofilament positive axons and a mild increase in non-phosphorylated neurofilament positive axons. Moreover, marked astrogliosis and microgliosis were found, but no demyelination. In addition to the main storage material GM1, GA1, sphingomyelin, phosphatidylcholine and phosphatidylserine were elevated in the brain. In summary, the current Glb1-/- mice exhibit a so far undescribed axonopathy and a reduced membrane resistance to compensate the functional effects of structural changes. They can be used for detailed examinations of axon-glial interactions and therapy trials of lysosomal storage diseases.

Keywords: GM1-gangliosidosis; astrogliosis; axonopathy; electrophysiology; knockout mouse model; lipid analysis; microgliosis; neuronal vacuolation; β-galactosidase deficiency.


Conflict of interest statement

The authors declare no conflict of interest. The funders had no role in the study design; in the collection, analyses, or interpretation of data; in the writing of the manuscript, or in the decision to publish the results.

Figures

Figure 1
Figure 1
Sequence of the Glb1−/− mice in exon 15 with the insert and enzyme activity of the β-galactosidase. (a) DNA sequence of parts of the exon 15 (yellow) with the knock-in (black). (b) Minimal β-galactosidase enzyme activity in Glb1−/− mice compared to wildtype (WT) control mice. ** p < 0.01. Graphs represent mean ± SD; n = 2 (WT at two and four months of age, Glb1−/− at four and six months of age), n = 3 (Glb1−/− at two months of age), n = 4 (WT at six months of age).
Figure 2
Figure 2
Histology of the brain in all examined areas in two- and eight-month-old mice. (a1a5, c1c5): Neurons of wildtype (WT) mice; (b1b5, d1d5): Neurons of Glb1−/− mice with vacuolated neurons in all areas of the brain. Bars: 20 µm.
Figure 3
Figure 3
Axonal alterations, astrogliosis and microgliosis in Glb1−/− mice. (ac) β-APP protein in the brainstem: (a) Eight-month-old wildtype (WT); (b) eight-month-old Glb1−/− mouse, arrows indicate β-APP positive spheroids; (c) quantification of β-APP positive spheroids in WT and Glb1−/− mice from two to eight-months of age. (df) GFAP protein in the brainstem: (d) Eight-month-old WT; (e) eight-month-old Glb1−/− mouse with an increase of GFAP positive astrocytes; (f) quantification of GFAP positive astrocytes in WT and Glb1−/− mice from two to eight-months of age. (gi) Iba1 protein in the brainstem: (g) Eight-month-old WT; (h) eight-month-old Glb1−/− mouse with an increase of Iba1 positive microglia/macrophages; (i) quantification of Iba1 positive microglia/macrophages in WT and Glb1−/− mice from two to eight months of age. Bars: 50 µm. red: Glb1−/− mice, green: WT. * p < 0.05. Graphs represent mean ± SD; n = 4.
Figure 4
Figure 4
Immunohistochemistry of the brainstem with axonal damage. (a) Overview of the brainstem (eight-month-old wildtype (WT), kinesin). (bm): Brainstem of an eight-month-old Glb1−/− mouse compared to an eight-month-old WT. (bd) Kinesin protein in brainstem axons; (b) eight-month-old WT; (c) eight-month-old Glb1−/− mouse with several swollen axons (arrows); (d) quantification of kinesin positive axons in eight-month-old WT and Glb1−/− mice; (eg) Dynein protein in brainstem axons: (e) eight-month-old WT; (f) eight-month-old Glb1−/− with decreased dynein-positivity; (g) quantification of dynein positive axons in eight-month-old WT and Glb1−/− mice; (hj) pNF in brainstem axons: (h) eight-month-old WT; (i) eight-month-old Glb1−/− with decreased pNF positive axons; (j) quantification of pNF positive axons in eight-month-old WT and Glb1−/− mice; (km) nNF in brainstem axons: (k) Eight-month-old WT; (l) eight-month-old Glb1−/− with increased nNF positive axons; (m) quantification of nNF positive axons in eight-month-old WT and Glb1−/− mice. Bars: (a): 200 µm; (b), (c), (e), (f), (h), (i), (k), (l): 50 µm. red: Glb1−/− mice, green: WT. * p < 0.05. Box plots are used to show data; n = 4.
Figure 5
Figure 5
Transmission electron microscopy. (a) Brainstem neuron of a wildtype (WT); (b) brainstem neuron of an eight-month-old Glb1−/− mouse; (c) dorsal root ganglion (DRG) neuron of a WT with normal lysosomes (L, insert); (d) DRG neuron of a Glb1−/− mouse with lysosomal lamellated storage material (arrows and insert); adjacent satellite glial cell (SGC) without storage material; (e) axons from WT DRG with regularly structured neurofilaments and microtubules with few mitochondria (M, insert); (f) axons in a DRG from an 8-month-old Glb1−/− mouse with lamellar storage material in lysosomes (S) and a relatively high number of mitochondria (M, insert); (g, h) myelin in the spinal cord white matter of eight-month-old WT and Glb1−/− mice; (i, j) hepatocytes of eight-month-old WT and Glb1−/− mice; (k, l) renal tubular epithelial cells of eight-month-old WT and Glb1−/− mice. Bars: (ad), (gl): 10 µm, (e, f): 5 µm.
Figure 6
Figure 6
Electroporation: Single cell stainings of 3.5 to five-month-old Glb1−/− and wildtype (WT) neurons. (a) Purkinje cell of a WT mouse; (b) Purkinje cell of a Glb1−/− mouse; (c, d) single optical sections of Purkinje cell dendrites of the WT animal; (e, f) single optical sections of Purkinje cell dendrites of the Glb1−/− animal; (g, h) dendrites of principal cells of the medial nucleus of the trapezoid body of the WT; (i, k) vacuolation of dendrites of principal cells of the medial nucleus of the trapezoid body of the Glb1−/− mouse. Bars: (a, b): 60 µm, (cf): 20 µm, (gi, k): 10 µm.
Figure 7
Figure 7
Electrophysiological characterization of GM1-gangliosidosis-associated lesions. Sub- and supra-threshold properties of 3.5 to five-month-old Glb1−/− and WT neurons of the medial nucleus of the trapezoid body. (a) Voltage steps from −60 to −65 mV (top) induce a charging transient (bottom) used to calculate the cell capacitance (b). The gray shaded area indicates the region of the charge transfer (tauweighted × 5) that was used to calculate the membrane capacitance. The gray dotted line represents the bi-exponential fit to the average trace. * p = 0.0147 (b) Cell capacitance of WT and Glb1−/− MNTB neurons. Round symbols represent single cells, and open squares the average (mean ± sem). (c) Current injections of −10 pA (top) induce a small hyperpolarization (bottom) used to extract the membrane resistance (e) and the time constant (f). Trace represents the average of 100 repetitions; the gray dotted line is an exponential fit from start to the maximal deflection. (d) Resting membrane potential of WT and Glb1−/− MNTB neurons. (e) Membrane resistance of WT and Glb1−/− MNTB neurons. Symbols as in (b), * p = 0.0128. (f) Membrane time constant (τmem) of WT and Glb1−/− MNTB neurons. Symbols as in (b). (g) Sub- and supra-threshold voltage response to current injections. Gray trace represents first supra-threshold current injection. (h) Sub-threshold input–output function of WT (black) and Glb1−/− (red) MNTB neurons extracted from voltage response shown in (g). Closed symbols depict the maximal voltage deflection; open symbols the voltage response of the steady state level at the end of the current injection. (i) Threshold current injection trigger supra- (black) and sub- (gray) threshold voltage responses. (j) Action potential jitter, defined as the standard deviation of the peak time of supra-threshold events of experiments as shown in (i). Symbols as in (b). (k) Time the sub-threshold events stay above the top 5% of the voltage amplitude. Symbols as in (b).
Figure 8
Figure 8
Biochemical characterization of fibroblasts. (a) TLC analysis of 3.5 to five-month-old Glb1−/− and wildtype (WT) fibroblasts for phosphatidylserine (PS), phosphatidylcholine (PC) and sphingomyelin (SM); (b) presence of Gb3, GM1 and GA1 in Glb1−/− mice and Gb3 in WT mice; (c) cholesterol concentration in WT and Glb1−/− mice determined by HPLC; (d) Western blot of sucrose density gradient fractions for flotillin 2 and RhoA; (e, f) HPLC analysis of the same fractions for flotillin 2 and cholesterol distribution. * p < 0.05. Box plots are used to show data; n = 4.
Figure 9
Figure 9
Lipid content of tissues. (ae) TLC analysis of four-month-old Glb1−/− and wildtype (WT) fibroblasts; (f) HPLC analysis for cholesterol. * p < 0.05; ** p < 0.01. Box plots are used to show data; n = 4.

Similar articles

Cited by

References

    1. Okada S., O’Brien J.S. Generalized Gangliosidosis: Beta-Galactosidase Deficiency. Science. 1968;160:1002–1004. doi: 10.1126/science.160.3831.1002. - DOI - PubMed
    1. Baker H.J., Lindsey J.R. Animal Model: Feline Gm1 Gangliosidosis. Am. J. Pathol. 1974;74:649–652. - PMC - PubMed
    1. Barker C.G., Blakemore W.F., Dell A., Palmer A.C., Tiller P.R., Winchester B.G. Gm1 Gangliosidosis (Type 1) in a Cat. Biochem. J. 1986;235:151–158. doi: 10.1042/bj2350151. - DOI - PMC - PubMed
    1. Baker H.J., Jr., Lindsey J.R., McKhann G.M., Farrell D.F. Neuronal Gm1 Gangliosidosis in a Siamese Cat with Beta-Galactosidase Deficiency. Science. 1971;174:838–839. doi: 10.1126/science.174.4011.838. - DOI - PubMed
    1. De Maria R., Divari S., Bo S., Sonnio S., Lotti D., Capucchio M.T., Castagnaro M. Β-Galactosidase Deficiency in a Korat Cat: A New Form of Feline Gm1-Gangliosidosis. Acta Neuropathol. 1998;96:307–314. doi: 10.1007/s004010050899. - DOI - PubMed

LinkOut - more resources