. 2020 Jan-Dec;12(1):1743053.
doi: 10.1080/19420862.2020.1743053.

Predicting Antibody Developability Profiles Through Early Stage Discovery Screening

Affiliations

Predicting Antibody Developability Profiles Through Early Stage Discovery Screening

Marc Bailly et al. MAbs. 2020 Jan-Dec.

Abstract

Monoclonal antibodies play an increasingly important role for the development of new drugs across multiple therapy areas. The term 'developability' encompasses the feasibility of molecules to successfully progress from discovery to development via evaluation of their physicochemical properties. These properties include the tendency for self-interaction and aggregation, thermal stability, colloidal stability, and optimization of their properties through sequence engineering. Selection of the best antibody molecule based on biological function, efficacy, safety, and developability allows for a streamlined and successful CMC phase. An efficient and practical high-throughput developability workflow (100 s-1,000 s of molecules) implemented during early antibody generation and screening is crucial to select the best lead candidates. This involves careful assessment of critical developability parameters, combined with binding affinity and biological properties evaluation using small amounts of purified material (<1 mg), as well as an efficient data management and database system. Herein, a panel of 152 various human or humanized monoclonal antibodies was analyzed in biophysical property assays. Correlations between assays for different sets of properties were established. We demonstrated in two case studies that physicochemical properties and key assay endpoints correlate with key downstream process parameters. The workflow allows the elimination of antibodies with suboptimal properties and a rank ordering of molecules for further evaluation early in the candidate selection process. This enables any further engineering for problematic sequence attributes without affecting program timelines.

Keywords: CMC; Monoclonal antibodies; antibody discovery; antibody screening; biophysical properties; developability; manufacturability; protein analytics; protein engineering.


Figures

Figure 1.
Figure 1.
Drug discovery, sequence selection, and developability workflow.
Figure 2.
Figure 2.
High-Throughput Analytical Characterization, Developability, and Data Management System.
Figure 3.
Figure 3.
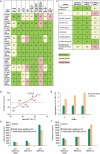
a Distribution plots of physicochemical properties of 152 monoclonal antibodies from multiple biophysical assays. The box and whisker plot to the right of each panel indicates the distribution of the properties which were evaluated. The box runs from the 1 st to the 3rd quartile, with the center line at the median. Whiskers extend to the farthest points from the box not more than 1.5 interquartile ranges from the box. A 95% confidence diamond is given for the mean. The red bracket outside the box marks the shortest regions that includes 50% of the observations. b Correlation clustered colored map of Spearman correlations (ρ). Negative correlations between assays (−1 to 0) are shown in a blue rectangle. Positive correlations (−1 to 0) are shown in a red triangle. c Protein property descriptors and HIC predicted retention times (HIC RT-PRED) vs. HIC RT for the 152 tested sequences. HIC RT expressed in minutes is the x-axis throughout. Antibodies that did not elute were set to the maximum of 50 min. Pearson correlation r2 for HIC RT vs the indicated descriptor is reported on each scatter plot. i) The upper panel plots HIC RT-PRED colored by patch_cdr_ion and its associated binned histogram. ii) The average sum of the ensemble surface area patches for the whole Fab (patch), and CDR (patch_cdr) for each of hydrophobic (hyd) and ionic (ion) on the homology model are indicated and colored by the HIC RT-PRED as derived from the QSPR-4pt model equation as is its associated histogram.
Figure 3.
Figure 3.
(Continued).
Figure 3.
Figure 3.
(Continued).
Figure 4.
Figure 4.
Distribution plots of selected physicochemical properties for panel 152 monoclonal antibodies segregated in IgG1 s and IgG4 s. a-% of main peak by UP-SEC after protein A purification b- % of main peak by UP-SEC after low pH stress, c- Tonset by nano DSF, λmax shift by AC-SINS in acetate pH 5.5, e- pI by cIEF. Color of the dots in Figure 4 a-e indicates different molecules properties: green color indicates % of mean peak by UP-SEC >95%, Tonset >65°C, λmax by AC-SINS <540 nm, (pI>7.5) f- dendrogram of properties for mAb panel segregated by isotype (IgG1 s and IgG4 s) g- Dendrogram highlighting three mAb clusters (Cluster 1, 2, and 3). 100% of IgG1s are found in cluster 3, while IgG4 s are found in clusters 1 and 2.
Figure 5.
Figure 5.
UP-SEC, HIC, and molecular surface analysis of a family of affinity matured antibodies. a- UP-SEC, b- HIC, c- Plot of retention times (RT) by UP-SEC vs. HIC,d- Surface patch analysis using homology models of affinity matured mutants (mAb32,15,22,23,19,40, and 24) e- Overall biophysical properties (UP-SEC, HP-RP, CE-SDS, Tm/Tagg, HIC, SINS, low pH hold UP-SEC, cIEF) for mAb 40.
Figure 6.
Figure 6.
Case Study mAb A and humanized variants. a- % aggregation by UP-SEC vs. Tm by DSF for mAb A humanized variants ordered by VL chain. Each cluster represents the combinatorial pairing of the specified VL chain with multiple VH designs (VH1, VH2, VH1 M64 V, VH2 M64 V, VH1 M64 L, and VH2 M64 L). The antibodies are VH chimera/VL (mAb75), VH chimera M64 V/VL (mAb76), VH chimera M64 L/VL (mAb77) variants, VH1/VL1 (mAb78), VH1 M64 V/VL1 (mAb86), VH1 M64 L/VL1(mAb94), VH2/VL1 (mAb82), VH2 M64 V/VL1 (mAb90), VH2 M64 L/VL1(mAb 98), VH1/VL2 (mAb79), VH1 M64 V/VL2 (mAb87), VH1 M64 L/VL2 (mAb83), VH2 M64 V/VL2 (mAb91), VH2 M64 L/VL2 (mAb99), VH1/VL3 (mAb80), VH1 M64 V/VL3 (mAb88), VH1 M64 L/VL3 (mAb96), VH2/VL3 (mAb84), VH2 M64 V/VL3 (mAb92), and VH2 M64 L/VL3 (mAb100).b- Effects of mouse backmutation on the Tm of mAb A humanized variants ordered by VL chain. c- Comparison of Asn (N) deamidation across all mAb A humanized variants (mAbs 78–111) within the Fc region (PENNYK peptide) and at VL-CDR1 N34 after 1-week incubation at 4°C, 7 days incubation at 50°C in 20 mM sodium acetate pH 5.5, and after 7 days incubation at pH 10 at 25°C. The reported percentage of Asn deamidation was assessed using peptide mapping by MS as described in Materials and Methods d- Level of Trp oxidation at W101 in VH-CDR3 for mAb A humanized variants (mAb78-111) under various stress conditions (1 M 2,2ʹ-azobis(2-amidinopropane) dihydrochloride for 6 hours, exposure to 1x light stress, and 50°C incubation for 7 days in 20 mM sodium acetate pH 5.5)
Figure 7.
Figure 7.
Case study Humanized mAb A incorporating variants with higher isoelectric point. a- Comparison of developability attributes for higher pI mAb A variants VH1 M64 V/VL5-VL8 (mAb103-111) and lower pI variant VH1 M64 V/VL2 (mAb87). Properties are color-coded as follows. Properties are separated in to 3 groups – optimal (light green), intermediate (gray), and suboptimal (dark pink). Optimal properties include UP-SEC >95%, Tm onset >55°C, Tm Fab >65°C, Tagg >64°C, 7.5 > pI <9, HP-RP purity >95%, purity by CE-SDS non-reduced >98%. Intermediate properties include 90% < UP-SEC <95%, 50°C < Tm onset <55°C, 60°C < Tm Fab <65°C, 60°C < Tagg <64°C, pI ~7.0–7.5 and ~9.0–9.5, 90% < HP-RP purity <95%, 95% > purity by CE-SDS non-reduced<98%. Suboptimal properties have UP-SEC <90%, Tm onset <50°C, Tm Fab <60°C, Tagg <60°C, 6 < pI >9.5, HP-RP purity <90%, purity by CE-SDS non-reduced <90% b- Aggregation by UP-SEC vs. Tm determined by nano-DSF for VH1 M64 V/VL1-VL8 variants (mAb103-111). c- Comparison of higher pI VH1 M64 V/VL5 (mAb107) and VH1 M64 V/VL5 N34Q (mAb111) vs lower pI VH1 M64 V/VL2 (mAb87) IgG4 variants across several manufacturability attributesd- Aggregation measured by UP-SEC for VH1/VL5 N34Q IgG4 (mAb111) (higher pI) and VH1 M64 V/VL2 (mAb87) (lower pI) IgG4 in accelerated stability test in 20 mM Acetate pH 5.5 at 40°C for up to 4 weeks E- Determination of sub-visible particles (≥0.88 μm and ≥0.45 μm) for VH1/VL5 N34Q IgG4 (mAb111) (higher pI) and VH1 M64 V/VL2 (mAb87) (lower pI) IgG4 variants at 10 mM acetate buffer at pH 5.6 (black solid bar) and 10 mM citrate buffer at pH 6.8 with 50 mM NaCl (white bar).
Figure 8.
Figure 8.
Case study Humanized mAb B: Analytical characterization and homology model. a- Analytical characterization data for all mAb B W104 mutantsAffinity was measured by SPR (KD), Hydrodynamic radius (Rh) by DLS, kD (coefficient diffusion) by DLS, and AC-SINS in PBS pH 7.4 and sodium acetate pH 5.5.AC-SINS Δλmax values were obtained by subtracting λmax values of the samples from λmax values for buffer only samples (λmax (PBS) = 531 nm and λmax (Na Acetate) = 535 nm). Optimal properties (green) are defined by Rh <6 nm, kD < −15 ml/g, AC-SINS Δλmax <10 nm, intermediate properties (gray) are Rh ~6–7 nm, kD −15 to −25 ml/g, AC-SINS Δλmax ~10–20 nm, and suboptimal properties (red) are Rh >7, kD < −25 ml/g, AC-SINS Δλmax >20 nm.b- Homology model of mAb B (PyMOL). Aromatic residues in the light chain (green) and heavy chain (blue) are highlighted.
Figure 9.
Figure 9.
Case study Humanized mAb B: correlating HT predictive self-association methods with CMC endpoints for W104 and selected W104X variants formulated in PBS pH 7.4. a- Comparison of AC-SINS and kDb- Comparison of kD, AC-SINS, and Rh by DLS at 2 mg/mlc- Comparison of AC-SINS and viscosity d- Comparison of kD and viscosity e- Comparison of PEG 6000 solubility and viscosity

Similar articles

Cited by

References

    1. Kaplon H, Reichert JM.. Antibodies to watch in 2019. MAbs. 2019;11:219–28. doi:10.1080/19420862.2018.1556465. - DOI - PMC - PubMed
    1. Goulet DR, Atkins WM. Considerations for the design of antibody-based therapeutics. J Pharm Sci. 2019. - PMC - PubMed
    1. Fogel DB. Factors associated with clinical trials that fail and opportunities for improving the likelihood of success: A review. Contemp Clin Trials Commun. 2018;11:156–64. doi:10.1016/j.conctc.2018.08.001. - DOI - PMC - PubMed
    1. Kola I, Landis J. Can the pharmaceutical industry reduce attrition rates? Nat Rev Drug Discov. 2004;3:711–15. doi:10.1038/nrd1470. - DOI - PubMed
    1. Tomar DS, Singh SK, Li L, Broulidakis MP, Kumar S. In silico prediction of diffusion interaction parameter (kD), a key indicator of antibody solution behaviors. Pharm Res. 2018;35(10):193. doi: 10.1007/s11095-018-2466-6. - DOI - PubMed

Substances

LinkOut - more resources