

B cell rich meningeal inflammation associates with increased spinal cord pathology in multiple sclerosis
- PMID: 32243032
- PMCID: PMC8018043
- DOI: 10.1111/bpa.12841
B cell rich meningeal inflammation associates with increased spinal cord pathology in multiple sclerosis
Abstract
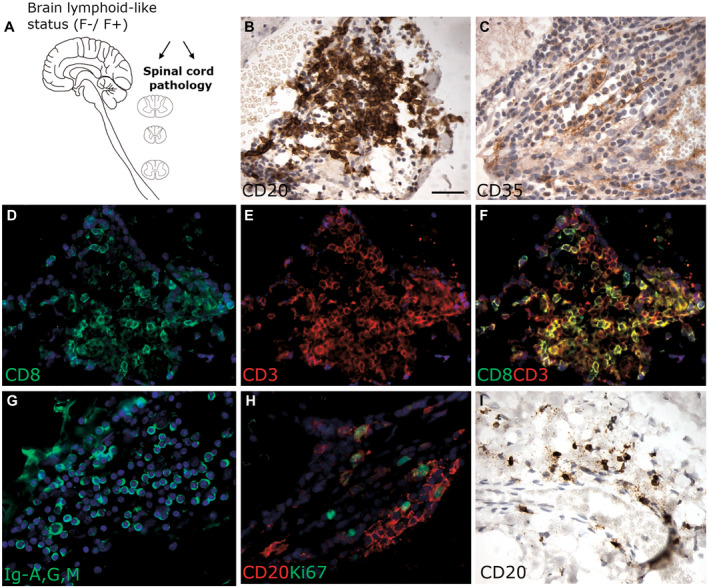
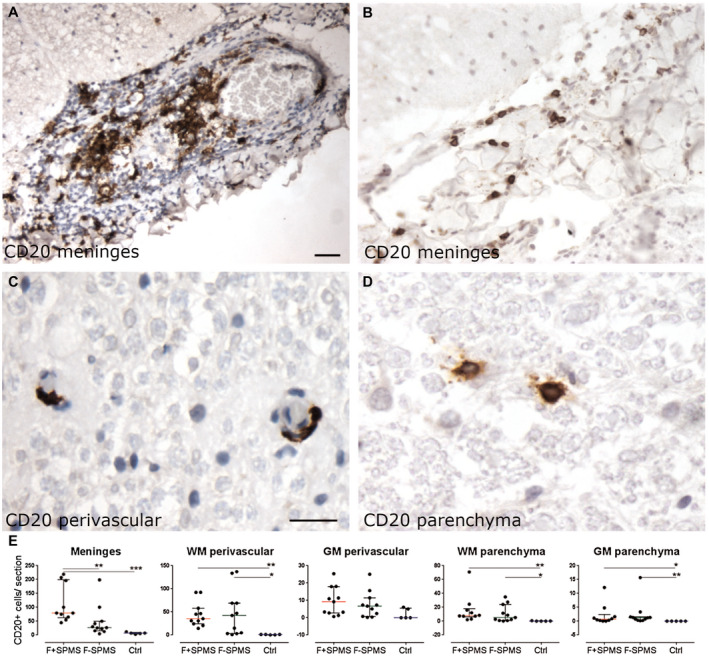
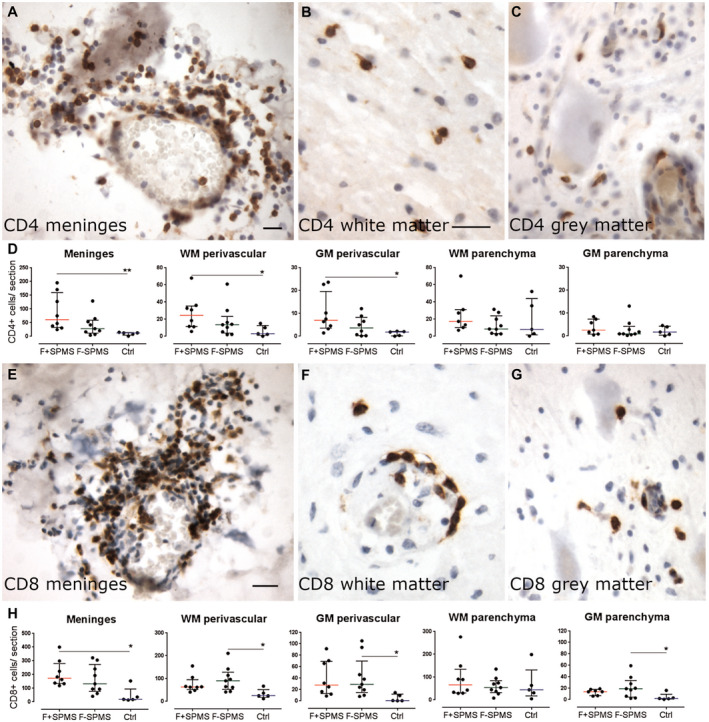
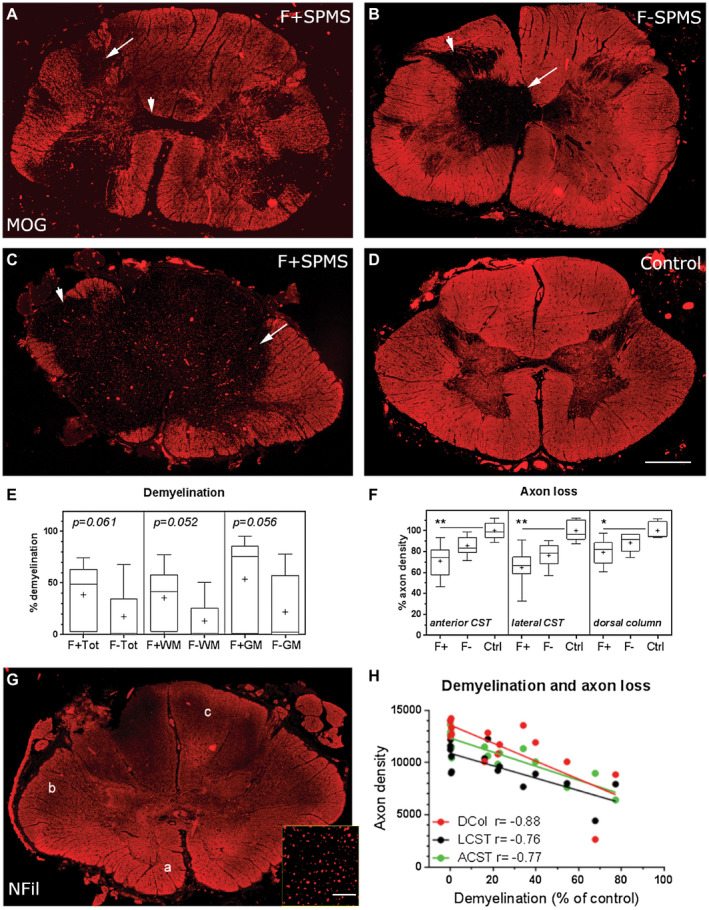
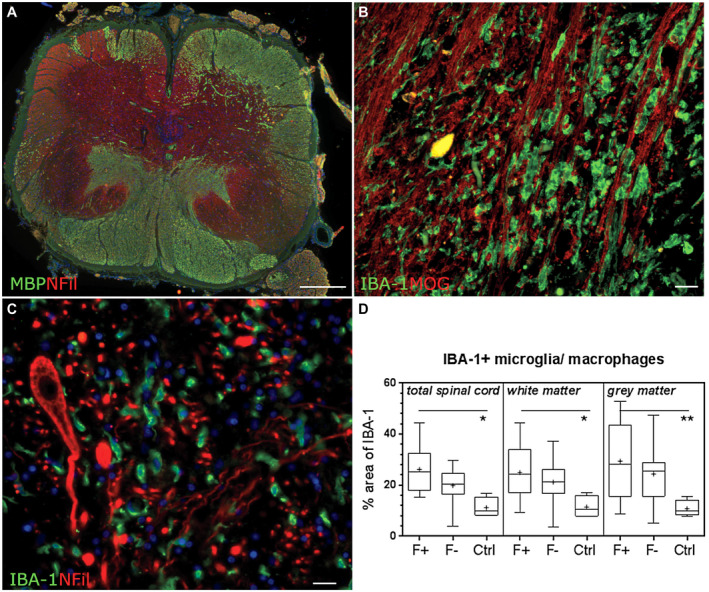
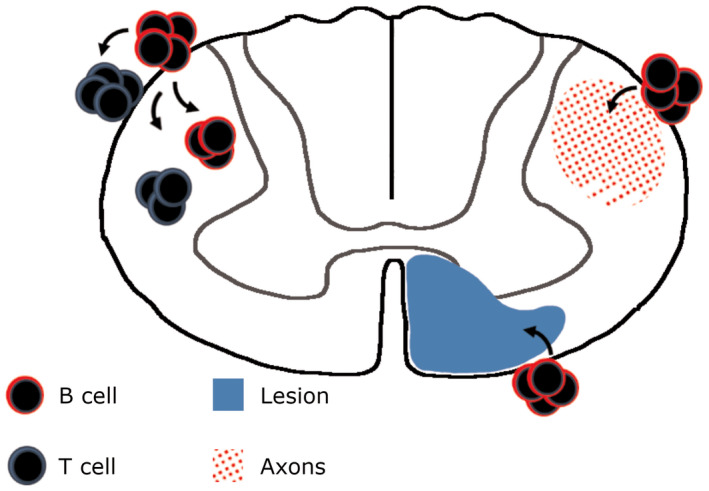
Increased inflammation in the cerebral meninges is associated with extensive subpial cortical grey matter pathology in the forebrain and a more severe disease course in a substantial proportion of secondary progressive multiple sclerosis (SPMS) cases. It is not known whether this relationship extends to spinal cord pathology. We assessed the contribution of meningeal and parenchymal immune infiltrates to spinal cord pathology in SPMS cases characterized in the presence (F+) or absence (F-) of lymphoid-like structures in the forebrain meninges. Transverse cryosections of cervical, thoracic and lumbar cord of 22 SPMS and five control cases were analyzed for CD20+ B cells, CD4+ and CD8+ T cells, microglia/macrophages (IBA-1+), demyelination (myelin oligodendrocyte glycoprotein+) and axon density (neurofilament-H+). Lymphoid-like structures containing follicular dendritic cell networks and dividing B cells were seen in the spinal meninges of 3 out of 11 F+ SPMS cases. CD4+ and CD20+ cell counts were increased in F+ SPMS compared to F- SPMS and controls, whilst axon loss was greatest in motor and sensory tracts of the F+ SPMS cases (P < 0.01). The density of CD20+ B cells of the spinal leptomeninges correlated with CD4+ T cells and total B and T cells of the meninges; with the density of white matter perivascular CD20+ and CD4+ lymphocytes (P < 0.05); with white matter lesion area (P < 0.05); and the extent of axon loss (P < 0.05) in F+ SPMS cases only. We show that the presence of lymphoid-like structures in the forebrain is associated with a profound spinal cord pathology and local B cell rich meningeal inflammation associates with the extent of cord pathology. Our work supports a principal role for B cells in sustaining inflammation and tissue injury throughout the CNS in the progressive disease stage.
Keywords: B-cell follicle; axon loss; demyelination; lymphoid-like structures.
© 2020 The Authors. Brain Pathology published by John Wiley & Sons Ltd on behalf of International Society of Neuropathology.
Conflict of interest statement
RR has received speaking honoraria from Roche, Novartis and ECTRIMS and grant funding from MedImmune plc. OWH has received travel reimbursement or speaking honoria (paid to Swansea University) from Roche, the Neurology Academy and ECTRIMS. All other authors have no relevant disclosures.
Figures
Comment in
-
B cells and multiple sclerosis spinal cord pathology.Brain Pathol. 2020 Jul;30(4):730-731. doi: 10.1111/bpa.12840. Epub 2020 Apr 14. Brain Pathol. 2020. PMID: 32285483 Free PMC article. No abstract available.
Similar articles
-
A Gradient of neuronal loss and meningeal inflammation in multiple sclerosis.Ann Neurol. 2010 Oct;68(4):477-93. doi: 10.1002/ana.22230. Ann Neurol. 2010. PMID: 20976767
-
Meningeal B-cell follicles in secondary progressive multiple sclerosis associate with early onset of disease and severe cortical pathology.Brain. 2007 Apr;130(Pt 4):1089-104. doi: 10.1093/brain/awm038. Brain. 2007. PMID: 17438020
-
Meningeal inflammation is widespread and linked to cortical pathology in multiple sclerosis.Brain. 2011 Sep;134(Pt 9):2755-71. doi: 10.1093/brain/awr182. Epub 2011 Aug 11. Brain. 2011. PMID: 21840891
-
Pathogenic Mechanisms Associated With Different Clinical Courses of Multiple Sclerosis.Front Immunol. 2019 Jan 10;9:3116. doi: 10.3389/fimmu.2018.03116. eCollection 2018. Front Immunol. 2019. PMID: 30687321 Free PMC article. Review.
-
Ectopic lymphoid follicles in progressive multiple sclerosis: From patients to animal models.Immunology. 2021 Nov;164(3):450-466. doi: 10.1111/imm.13395. Epub 2021 Aug 2. Immunology. 2021. PMID: 34293193 Free PMC article. Review.
Cited by
-
The CXCL13/CXCR5 Immune Axis in Health and Disease-Implications for Intrathecal B Cell Activities in Neuroinflammation.Cells. 2022 Aug 25;11(17):2649. doi: 10.3390/cells11172649. Cells. 2022. PMID: 36078057 Free PMC article. Review.
-
Beyond T cell toxicity - Intrathecal chemokine CXCL13 indicating B cell involvement in immune-related adverse events following checkpoint inhibition: A two-case series and literature review.Eur J Neurol. 2024 Jul;31(7):e16279. doi: 10.1111/ene.16279. Epub 2024 Mar 31. Eur J Neurol. 2024. PMID: 38556899 Free PMC article.
-
An "Outside-In" and "Inside-Out" Consideration of Complement in the Multiple Sclerosis Brain: Lessons From Development and Neurodegenerative Diseases.Front Cell Neurosci. 2021 Jan 7;14:600656. doi: 10.3389/fncel.2020.600656. eCollection 2020. Front Cell Neurosci. 2021. PMID: 33488361 Free PMC article. Review.
-
Deconvolution of B cell receptor repertoire in multiple sclerosis patients revealed a delay in tBreg maturation.Front Immunol. 2022 Aug 16;13:803229. doi: 10.3389/fimmu.2022.803229. eCollection 2022. Front Immunol. 2022. PMID: 36052064 Free PMC article.
-
Disentangling the heterogeneity of multiple sclerosis through identification of independent neuropathological dimensions.Acta Neuropathol. 2024 May 21;147(1):90. doi: 10.1007/s00401-024-02742-w. Acta Neuropathol. 2024. PMID: 38771530 Free PMC article.
References
-
- Aloisi F, Serafini B, Magliozzi R, Howell OW, Reynolds R (2010) Detection of Epstein‐Barr virus and B‐cell follicles in the multiple sclerosis brain: what you find depends on how and where you look. Brain 133:e157. - PubMed
-
- Androdias G, Reynolds R, Chanal M, Ritleng C, Confavreux C, Nataf S (2010) Meningeal T cells associate with diffuse axonal loss in multiple sclerosis spinal cords. Ann Neurol 68:465–476. - PubMed
-
- Bar‐Or A, Fawaz L, Fan B, Darlington PJ, Rieger A, Ghorayeb C et al (2010) Abnormal B‐cell cytokine responses a trigger of T‐cell‐mediated disease in MS? Ann Neurol 67:452–461. - PubMed
Publication types
MeSH terms
Grants and funding
LinkOut - more resources
Full Text Sources
Research Materials
