. 2020 Apr 2;12(7):5590-5611.
doi: 10.18632/aging.102977. Epub 2020 Apr 2.

Down-regulation of AMPK signaling pathway rescues hearing loss in TFB1 transgenic mice and delays age-related hearing loss

Affiliations

Down-regulation of AMPK signaling pathway rescues hearing loss in TFB1 transgenic mice and delays age-related hearing loss

Jingjing Zhao et al. Aging (Albany NY). .

Abstract

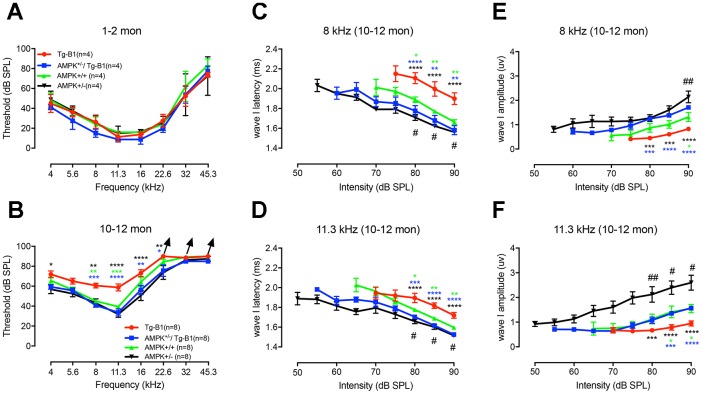
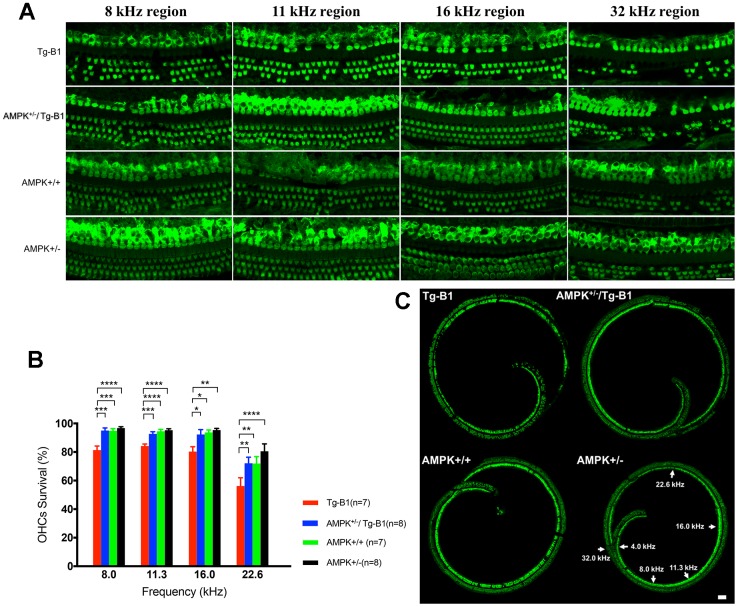
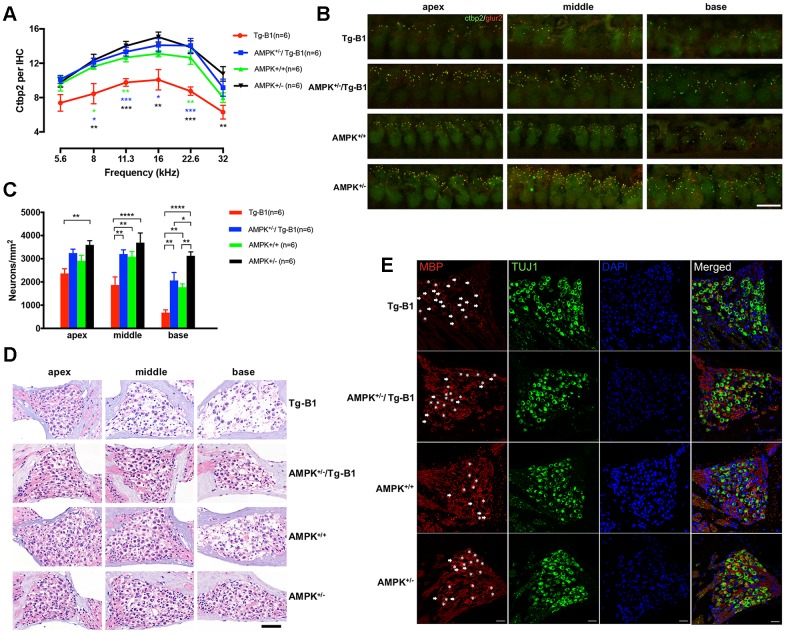
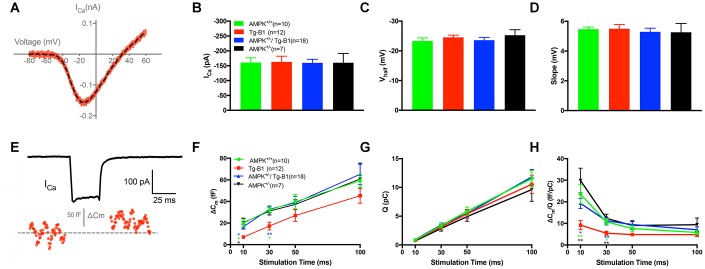
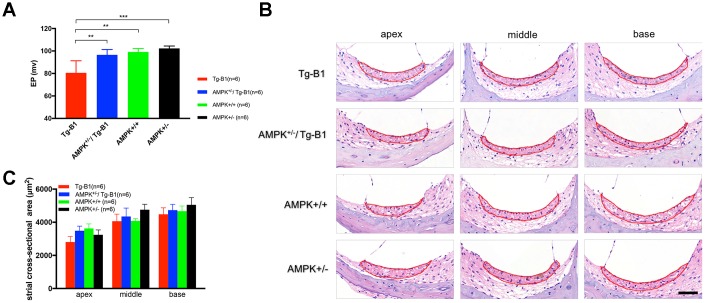
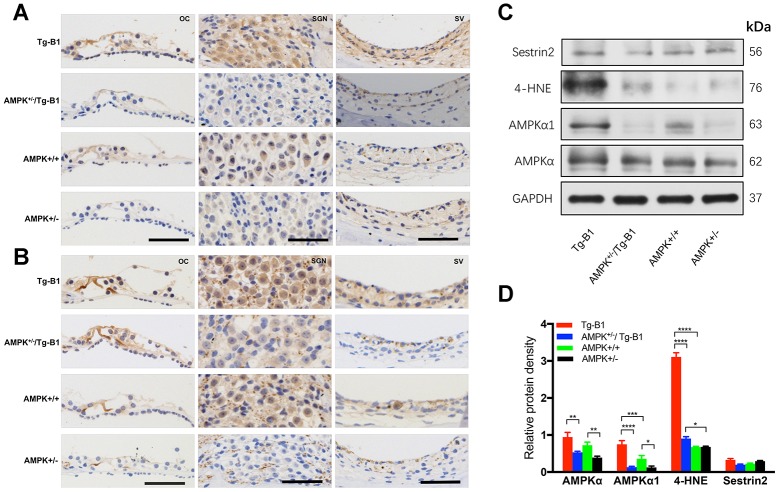
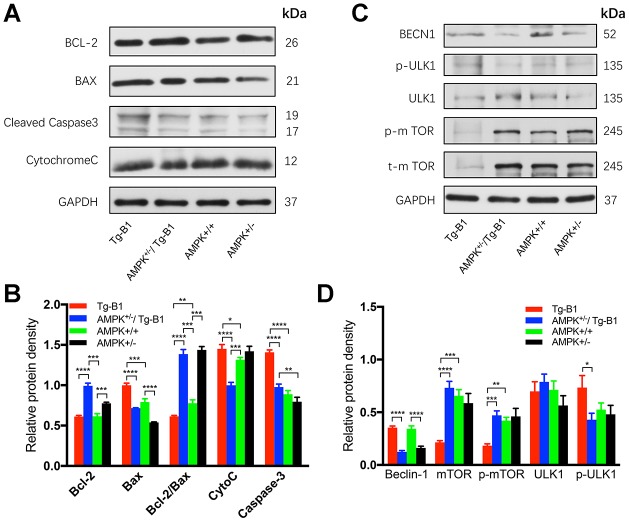
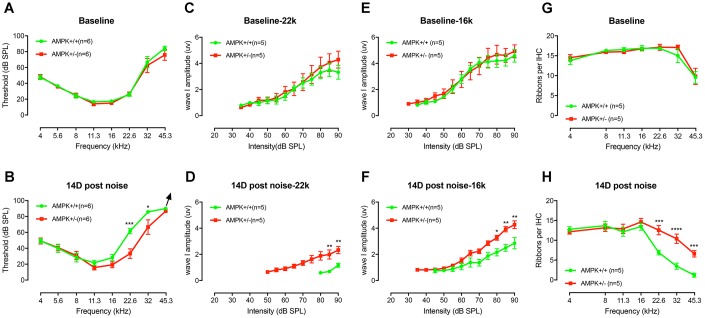
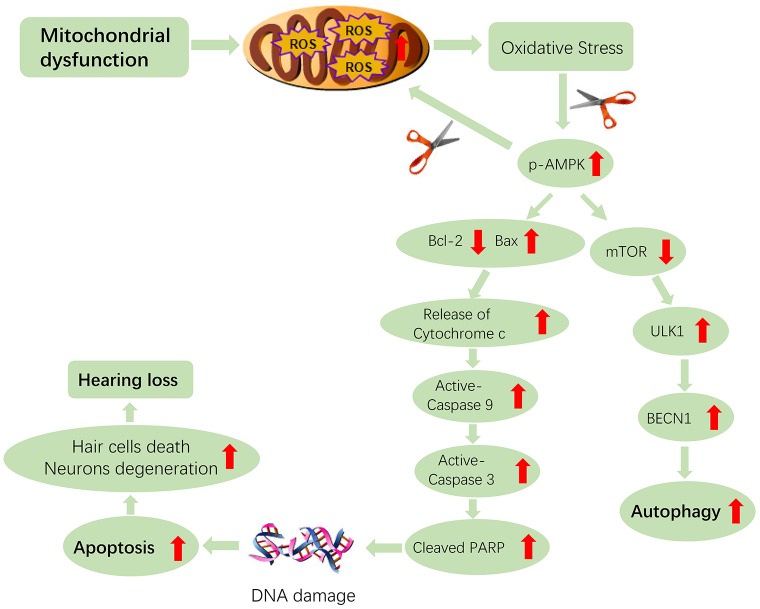
AMP-activated protein kinase (AMPK) integrates the regulation of cell growth and metabolism. AMPK activation occurs in response to cellular energy decline and mitochondrial dysfunction triggered by reactive oxygen species (ROS). In aged Tg-mtTFB1 mice, a mitochondrial deafness mouse model, hearing loss is accompanied with cochlear pathology including reduced endocochlear potential (EP) and loss of spiral ganglion neurons (SGN), inner hair cell (IHC) synapses and outer hair cells (OHC). Accumulated ROS and increased apoptosis signaling were also detected in cochlear tissues, accompanied by activation of AMPK. To further explore the role of AMPK signaling in the auditory phenotype, we used genetically knocked out AMPKα1 as a rescue to Tg-mtTFB1 mice and observed: improved ABR wave I, EP and IHC function, normal SGNs, IHC synapses morphology and OHC survivals, with decreased ROS, reduced pro-apoptotic signaling (Bax) and increased anti-apoptotic signaling (Bcl-2) in the cochlear tissues, indicating that reduced AMPK attenuated apoptosis via ROS-AMPK-Bcl2 pathway in the cochlea. To conclude, AMPK hyperactivation causes accelerated presbycusis in Tg-mtTFB1 mice by redox imbalance and dysregulation of the apoptosis pathway. The effects of AMPK downregulation on pro-survival function and reduction of oxidative stress indicate AMPK serves as a target to rescue or relieve mitochondrial hearing loss.

Keywords: AMPK; NIHL; ROS; apoptosis; mitochondrial deafness.


Conflict of interest statement

CONFLICTS OF INTEREST: The authors declared that no conflict of interest exists.

Figures

Figure 1
Figure 1
General ABR findings reveal the protective effect of AMPK KO. Auditory thresholds were evaluated by ABRs at age of 1-2 months (A) and 10-12 months (B) for four genotype groups. There is no significant difference in ABR thresholds for all four genotypes at 1-2 months (F(3,12)=2.972, p=0.0744, two-way ANOVA followed by Bonferroni post-test), while at 10-12 months of age, around 20dB threshold elevation was observed in Tg-B1 mice (red) at 8 kHz (Tg-B1 vs. WT, F(1,14)=28.974, p<0.001), 11.3 kHz (Tg-B1 vs. WT, F(1,14)=21.912, p<0.001, one-way ANOVA followed by Bonferroni post-test) compared to age-matched WT controls (green), and a moderate increase of thresholds at low frequencies. Age-matched AMPK+/−/Tg-B1 mice (blue) showed significantly lower ABR thresholds compared to Tg-B1 mice at 10-12 month, for 8 kHz (Tg-B1 vs. AMPK+/−/Tg-B1, F(1,14) =50.479, p<0.001), 11.3 kHz (F(1,14)=25.455, p<0.001) and 16 kHz (F(1,14)=8.463, p=0.011, one-way ANOVA followed by Bonferroni post-test) and showed similar ABR thresholds to wild type controls (AMPK+/−/Tg-B1 vs. WT, F(5,84)=0.3781, p=0.8625, two-way ANOVA followed by Bonferroni post-test). However, there were no significant differences in ABR thresholds among AMPK+/−/Tg-B1 (blue), wild type controls (green) and AMPK+/− (black) groups (F(10,126)=0.392, p=0.9482, two-way ANOVA followed by Bonferroni post-test). Arrowhead points excluded mice that showed no response at 90 dB SPL, the upper limit of the ABR recording. Number of mice with “no response” at 90 dB SPL: Tg-B1 mice at 22.6 kHz, n=2, 32 kHz, n=2, 45.3 kHz, n=3; AMPK+/−/Tg-B1 mice at 22.6 kHz, n=0, 32 kHz, n=1, 45.3 kHz, n=3; WT mice at 22.6 kHz, n=0, 32 kHz, n=1, 45.3 kHz, n=4 and AMPK+/− mice at 22.6 kHz, n=0, 32 kHz, n=0, 45.3 kHz, n=3. (CF) Amplitudes and latencies of ABR wave I in different genotype groups aged 10-12 months from 50-90 dB SPL (8 and 11.3 kHz) were computed from sorted ABR wave traces. In contrast to the AMPK+/−/Tg-B1 and wild type mice, latencies of ABR wave I are remarkably prolonged in Tg-B1 mice at 8 kHz (Tg-B1 vs. WT, F(1,14)=11.7, p=0.0041; Tg-B1 vs. AMPK+/−/Tg-B1, F(1,14)=15.71, p=0.0014; AMPK+/− vs. WT, F(1,14)=19.84, p=0.0005, Figure 1C) and 11.3 kHz (Tg-B1 vs. WT, F(1,14)=14.91, p=0.0017; Tg-B1 vs. AMPK+/−/Tg-B1, F(1,14)=40.26, p<0.0001; AMPK+/− vs. WT, F(1,14)=8.752, p=0.0104, two-way ANOVA followed by Bonferroni post-test, Figure 1D). Besides, significantly decreased amplitude of peak I was noticed in Tg-B1 mice at 8 kHz (F(1,14)=6.091, p=0.0271, Figure 1E) and 11.3 kHz (F(1,14)=7.792, p=0.0144, two-way ANOVA followed by Bonferroni post-test, Figure 1F) as compared to wild type controls. Significant increases of ABR wave I amplitude in AMPK+/−/Tg-B1 mice at both 8 kHz (F(1,14)=63.76, p<0.0001) and 11.3 kHz (F(1,14)=27.82, p=0.0001, two-way ANOVA followed by Bonferroni post-test) were also observed as compared to Tg-B1 mice. Briefly, AMPK+/−/Tg-B1 mice exhibited significantly increased wave I amplitudes (E, F) and shorter wave I latencies (C, D) as compared to those in Tg-B1 mice. Furthermore, AMPK+/− mice (black) showed increased wave I amplitudes as compared to wild type mice (green) at both 8 kHz (F(1,14)=7.653, p=0.0151) and 11.3 kHz (F(1,14)=8.656, p=0.0107, two-way ANOVA followed by Bonferroni post-test), as marked with a pound sign (#). The bar graph represents the mean threshold/wave I amplitude or latency ± SEM (n=8). Asterisks symbolized statistically significant differences at the indicated frequencies and sound intensities.
Figure 2
Figure 2
AMPK KO protects OHCs from damages and losses. (A) Representative immunofluorescent surface preparation images of OHCs from four genotype mice aged 10-12 months were captured at the frequency-specific regions (8, 11.3, 16, and 32 kHz) of the cochleae. The OC was dissected for the staining of hair cells with Myosin7a (green). Scale bar=20 μm. (B) Quantification of OHCs survivals in four genotype mice aged 10-12 months. AMPK knockouts increased the number of surviving OHCs in cochlea, differed significantly between Tg-B1 (red bars) and AMPK+/−/Tg-B1 (blue bars) mice at 8, 11.3, 16 and 22.6 kHz regions. Values are presented as mean ± SEM and evaluated with two-way ANOVA followed by Bonferroni post-test. (* P<0.05, ** P<0.01, ***P<0.001, **** P<0.0001; n=7 or 8). (C) Representative confocal microscopy images from four genotypes of the cochleae. For reference, frequency regions of interest were indicated by the arrowheads. Scale bar=50 μm.
Figure 3
Figure 3
Downregulation of AMPK protects IHC ribbon synapses and SGNs. (A) Aging Tg-B1 mice showed reduced number of IHC synapses across all frequencies ranged from 5.6 to 32 kHz (F(1,10)=25.6, p=0.0005, two-way ANOVA followed by Bonferroni post-test) as compared to wild type controls. Significant increases of ribbon counts in IHCs at 8, 11.3, 16 and 22.6 kHz regions were observed in AMPK+/−/Tg-B1 (blue) mice compared to Tg-B1 (red) mice (F(1,10)=34.23, p=0.0002, two-way ANOVA followed by Bonferroni post-test) and the former showed almost similar numbers of ribbons to that in WT controls (green). Data are presented as the mean ± SEM, * P<0.05, ** P<0.01, ***P<0.001. n=6. (B) Representative z-stack confocal images in the IHC synapse areas from apical, middle and basal cochlear turns in four genotype groups aged 10-12 months showed co-staining in cochlear whole mount preparations with the presynaptic (CtBP2 for RIBEYE, Green puncta) and postsynaptic marker (GluR2, red puncta). CtBP2 in the IHC areas, seen as a cloud of ~0.4-0.6 um puncta, clustered at the basolateral pole. The IHC nuclei were also labeled due to the nuclear expression of CtBP2. Scale Bar=10 μm. (C) Statistics of SGN density (Number of SGNs/Area of Rosenthal’s canal) showing the significant SGNs degeneration in Tg-B1 (red bars) mice as compared to WT controls (green bars) (F(1,10) =40.67, p<0.0001, two-way ANOVA followed by Bonferroni post-test), especially in the middle (p=0.0016) and basal turns (p=0.0045) of the cochleae. SGNs survival in AMPK+/−/Tg-B1 mice (blue bars) has a remarkable increase compared to Tg-B1 mice (F(1,10)=59.99, p<0.0001, two-way ANOVA followed by Bonferroni post-test), especially in the middle (p=0.0017) and basal turns (p=0.0011) of cochleae. (D) Representative H&E staining images of SGNs taken from cochleae of aging mice at 10-12 months. The neurons in AMPK KO mice were arranged tightly whereas significant reduction of SGN number occurred in the basal turn of WT controls and more aggravated in the middle and basal turns in Tg-B1 mice. Scale bar=50 μm. (E) Representative immunostaining for MBP expression in SGN in four genotype mice. MBP+ myelin sheaths (red) enclose type I SGNs (green) in Rosenthal’s canal of the middle turn of the cochlea. SGNs are co-identified with DAPI (blue) and TUJ1(green) staining. The MBP+ myelin sheath was considered intact if enveloped more than 80% of the outline of the perikarya. Intact MBP+ myelin sheaths are marked by asterisks while broken MBP+ myelin sheaths are indicated by arrows. A decline of intact MBP+ myelin sheath was found in Tg-B1 mice cochlea. Scale bar=20 μm.
Figure 4
Figure 4
IHC patch clamp recordings reveal normal calcium current but reduced vesicle release in Tg-B1 mice. (A) Representative trace for voltage-dependent calcium current (ICa) of WT controls mice (red curve) showed I-V relationship of calcium current in IHCs after leakage subtraction and fitted with a double exponential function (dotted line in black). (BD) The Ca2+ current amplitude (ICa, Panel B), the voltage of half-maximal activation (Vhalf, Panel C) and the slope of the calcium activation curve (Panel D) were obtained from the current-voltage relationship fitted with Boltzmann function. No significant differences of ICa (F(3,43)=0.0074, p=0.9991), Vhalf (F(3,43)=0.5325, p=0.6624) and Slope of ICa (F(3,43)=0.2187, p=0.8829, one-way ANOVA followed by Bonferroni post-test) were found in IHCs of each group. (E) Representative trace of whole-cell membrane capacitance (Cm) shows measurements of exocytosis of IHC. The depolarization step stimulus induced ICa and triggered exocytosis (ΔCm) in WT. (F-H) Stimulus durations from 10 to 100 ms were applied to examine the release of synaptic vesicles. (F): The ΔCm significantly reduced in the Tg-B1 group compared to WT controls for shorter stimuli of 10 ms (p=0.0148) and 30 ms (p=0.0289). AMPK+/−/Tg-B1 mice (blue) exhibited significantly larger membrane capacitance change (ΔCm) than Tg-B1 mice (red) at stimulus durations of 10 ms (p=0.0463) and 30 ms (p=0.0052, one-way ANOVA followed by Bonferroni post-test). Although presented as a trend, stimulus time longer than 50 ms show no significant difference in ΔCm of all groups. (G): Ca2+ current charge (QCa) has no significant difference (F(3,43)=0.3077, p=0.8197, two-way ANOVA followed by Bonferroni post-test) for each group for each stimulus duration. (H): The ratio of ΔCm/Q, which reflects Ca2+ efficiency in triggering exocytosis, was significantly lower in IHCs from Tg-B1 mice (red) compared to WT controls (green) for stimulation of 10 ms (p=0.005, one-way ANOVA followed by Fisher’s LSD post-test) and 30 ms (p=0.024, one-way ANOVA followed by Fisher’s LSD post-test), while there was a significant elevation of ΔCm/Q for short stimulation of 10 ms (p=0.020, one-way ANOVA followed by Fisher’s LSD post-test) and 30 ms (p=0.005, one-way ANOVA followed by Fisher’s LSD post-test) in AMPK+/−/Tg-B1 mice (blue) compared to Tg-B1 group, similar to WT controls and AMPK+/− group (black). All data are presented as means ± SEM; * P<0.05, ** P<0.01; n=10, 12, 18 and 7 for WT, Tg-B1, AMPK+/−/Tg-B1 and AMPK+/− group, respectively.
Figure 5
Figure 5
AMPK KO rescues Endocochlear Potential (EP) in Tg-B1 mice. (A) Profound EP loss in 10-12 months Tg-B1 (red bars) mice was observed as compared to all three other genotypes (Tg-B1 vs. WT, p=0.0023; Tg-B1 vs. AMPK+/−/Tg-B1, p=0.0023; Tg-B1 vs. AMPK+/−, p=0.0005; one-way ANOVA followed by Bonferroni post-test). * P<0.05, ** P<0.01, ***P<0.001. (B) Representative cochlear cross-sections stained with H&E showed gross morphology of stria vascularis in the apical, middle and basal turns of cochleae from four genotypes of mice at 10-12 months. No visible atrophy was found. Scale bar=50 μm. (C) The histograms show no significant difference in averaged sectional area of stria vascularis for all four aged genotypes (n=6 for each group; F(3,20)=0.8244, p=0.4958, two-way ANOVA followed by Bonferroni post-test).
Figure 6
Figure 6
Expression of AMPK and p-AMPK, quantification of ROS and antioxidant protein in the cochlear tissues. (AB) The representative mid-modiolar immunohistochemistry staining of cross-sections of the cochlea for the expressions of total AMPKα1 and p-AMPKα in three regions of the cochlea: OC (left column), SGN (middle column) and SV (right column). Increased DAB-stained immunolabeling of AMPKα1 and p-AMPKα (brown) in the cytosol and nuclei of OHCs, IHCs, OC, SGNs, basal cells of the SV were observed in the cochlear sections of Tg-B1 mice than those in AMPK+/−/Tg-B1 and WT mice. There was strong immunolabeling for p-AMPKα in the OC, SGNs, and SV of Tg-B1 mice, while AMPK+/− showed the weakest immunolabeling signals. Scale bar=50 μm. (C) Western blot using sensory epithelium tissues from 10-12 months mice displayed significant alteration in band density for total AMPKα, AMPKα1, and 4-HNE in the cochleae between Tg-B1 and AMPK+/−/Tg-B1 mice, but no significant difference in Sestrin2 expression, the antioxidant protein. GAPDH served as the loading control. (D) Histograms (mean ± SEM) represent relative density values normalized to GAPDH. Blotting results of AMPKα1 showed knockouts of AMPKα1 in Tg-B1 mice significantly decreased the AMPKα1 (p<0.0001) expression in the inner ear. Western blot analyses of 4-HNE expression in Tg-B1 mice cochleae were significantly higher than WT controls (p<0.0001) and KO mice (p<0.0001). Experiments were performed in triplicate, and p-values were determined by one-way ANOVA followed by Bonferroni post-test.
Figure 7
Figure 7
AMPK knockout interrupts and decreases apoptosis in the cochlea. (A) Immunoblots analyses of the four genotype mice aged 10-12 months show proteins from the cochleae related to the apoptotic pathway, including Bcl-2, Bax, Caspase-3, and Cytochrome C. GAPDH serves as the loading control. (B) The histograms summarized the expression levels of proteins related to the apoptosis pathway. The apoptosis signaling (cleaved caspase-3) in Tg-B1 mice was significantly stronger than AMPK KO mice and WT controls (Tg-B1 vs. AMPK+/−/Tg-B1, p<0.0001; Tg-B1 vs. WT, p<0.0001; AMPK+/−/Tg-B1 vs. WT, p=0.1807). The expression of pro-apoptotic protein (Bax) in Tg-B1 mice is significantly higher than the other three groups (Tg-B1 vs. AMPK+/−/Tg-B1, p<0.0001; Tg-B1 vs. WT, p<0.001; Tg-B1 vs. AMPK+/−, p<0.0001; WT vs. AMPK+/−, p<0.0001; AMPK+/−/Tg-B1 vs. AMPK+/−, p=0.0001). Bcl-2/Bax ratio in the Tg-B1 group is significantly lower than the other three groups (Tg-B1 vs. AMPK+/−/Tg-B1, p<0.0001; Tg-B1 vs. WT, p=0.0072; Tg-B1 vs. AMPK+/−, p<0.0001), so does the wild type to AMPK+/− group (p=0.008). Experiments were performed in triplicate, and p-values were determined by one-way ANOVA followed by Bonferroni post-test. n=3 per group. (C) Western blot results show changes in autophagy-related proteins in the cochleae of aging mice. There is a remarkable decline of mTOR signaling (Tg-B1 vs. AMPK+/−/Tg-B1, p<0.0001; Tg-B1 vs. WT, p=0.0001) and more Beclin-1 (Tg-B1 vs. AMPK+/−/Tg-B1, p<0.0001, one-way ANOVA followed by Bonferroni post-test) expressed in the cochleae of Tg-B1 mice. (D) The histograms of western blot analyses show knockouts of AMPK relieve the ROS-induced autophagic stress in Tg-B1 mice. Analysis performed by using Image J software and one-way ANOVA followed by Bonferroni post-test. * P<0.05, ** P<0.01, ***P<0.001, **** P<0.0001; n=3 per group.
Figure 8
Figure 8
AMPK KO protects the noise-induced hearing loss and synaptopathy. (A) The baseline ABR thresholds for the two genotype groups were similar at the age of 1-2 months (F(1,10)=0.0095, p=0.3419). (B) An episode of two-hour, 106 dB SPL noise exposure induces significant threshold shifts at 22.6 kHz and 32 kHz 1 d after exposure (data not shown). Complete threshold recovery were found in AMPK+/− group at 14d (F(1,10)=3.455, p=0.0927) but not the WT (F(1,10)=15.22, p=0.0030). Significant difference in thresholds between both genotypes on D14 post-exposure (F(1,10)=5.776, p=0.0371), for 22.6 kHz (p=0.0001) and 32 kHz (p=0.0214), respectively. (CF) ABR wave I amplitudes, evoked by suprathreshold tones at 16 (C) and 22.6 kHz (E), have no significant difference before noise exposure (for 16 kHz, F(1,8)=0.05484, p=0.8207 and for 22.6 kHz, F(1,8)=0.2944, p=0.6022). WT mice suffer more severe ABR wave I amplitude reduction at 16 (F) and 22.6 kHz (D) than AMPK KO mice 14 days after noise exposure (for 16 kHz, F(1,8)=17.85, p=0.0029 and for 22.6 kHz, F(1,8)=14.43, p=0.0052). 14 days after noise, the noise-induced decrease in wave I amplitudes in wild type group was significantly elevated at 22.6 kHz (from 3.32 ± 0.53 μV to 1.17 ± 0.15 μV) and at 16 kHz (from 4.58 ± 0.48 μV to 2.85 ± 0.43 μV), whereas in AMPK+/− group, the wave I amplitudes at 22.6 kHz (from 4.29 ± 0.64 μV to 2.33 ± 0.28 μV) and at 16 kHz (from 4.93 ± 0.50 μV to 4.27 ± 0.30 μV) had little change following acoustic trauma. (G) Numbers of CtBP2 in IHCs from both groups before noise exposure show no significant difference between the two genotype groups (F(1,8)=0.3357, p=0.5783). (H) At 14 days post-exposure, wild type mice suffer more loss of CtBP2 in the region of 22.6, 32, and 45.3 kHz than AMPK KO mice. (KO vs. WT, F(1,8)=13.24, p=0.0066; for 22.6 kHz, p=0.0004; for 32 kHz, p<0.0001 and for 45.3 kHz, p=0.0008). Two-way ANOVA followed by Bonferroni post-test was applied in the statistical analysis of the figure. n=5 or 6 for each group. Data presented as mean ± SEM; * P<0.05, ** P<0.01, ***P<0.001, **** P<0.0001.
Figure 9
Figure 9
Hypothetical scheme of molecular and cellular events in the cochleae of aging Tg-B1 mice leading to accelerated hearing loss. The aberrant activation of AMPK induces the ROS-AMPK-Bcl2 apoptotic pathway in cochleae, resulting in the increased sensory hair cell loss and SGN death. The “scissor” in the figure represents the knockouts of the AMPK pathway. The conjectured downregulation of AMPK could attenuate the apoptotic signaling and ROS accumulation in auditory cells, which accounts for rescue of hearing loss in Tg-B1 mice.

Similar articles

Cited by

References

    1. Carling D, Viollet B. Beyond energy homeostasis: the expanding role of AMP-activated protein kinase in regulating metabolism. Cell Metab. 2015; 21:799–804. 10.1016/j.cmet.2015.05.005 - DOI - PubMed
    1. Mihaylova MM, Shaw RJ. The AMPK signalling pathway coordinates cell growth, autophagy and metabolism. Nat Cell Biol. 2011; 13:1016–23. 10.1038/ncb2329 - DOI - PMC - PubMed
    1. Hardie DG. Sensing of energy and nutrients by AMP-activated protein kinase. Am J Clin Nutr. 2011; 93:891S–6. 10.3945/ajcn.110.001925 - DOI - PubMed
    1. Hardie DG, Carling D, Carlson M. The AMP-activated/SNF1 protein kinase subfamily: metabolic sensors of the eukaryotic cell? Annu Rev Biochem. 1998; 67:821–55. 10.1146/annurev.biochem.67.1.821 - DOI - PubMed
    1. Hawley SA, Davison M, Woods A, Davies SP, Beri RK, Carling D, Hardie DG. Characterization of the AMP-activated protein kinase kinase from rat liver and identification of threonine 172 as the major site at which it phosphorylates AMP-activated protein kinase. J Biol Chem. 1996; 271:27879–87. 10.1074/jbc.271.44.27879 - DOI - PubMed

Publication types

MeSH terms

Substances

Supplementary concepts