. 2020 May 8;295(19):6482-6497.
doi: 10.1074/jbc.RA119.011374. Epub 2020 Apr 1.

Non-photopic and photopic visual cycles differentially regulate immediate, early, and late phases of cone photoreceptor-mediated vision

Affiliations

Non-photopic and photopic visual cycles differentially regulate immediate, early, and late phases of cone photoreceptor-mediated vision

Rebecca Ward et al. J Biol Chem. .

Abstract

Cone photoreceptors in the retina enable vision over a wide range of light intensities. However, the processes enabling cone vision in bright light (i.e. photopic vision) are not adequately understood. Chromophore regeneration of cone photopigments may require the retinal pigment epithelium (RPE) and/or retinal Müller glia. In the RPE, isomerization of all-trans-retinyl esters to 11-cis-retinol is mediated by the retinoid isomerohydrolase Rpe65. A putative alternative retinoid isomerase, dihydroceramide desaturase-1 (DES1), is expressed in RPE and Müller cells. The retinol-isomerase activities of Rpe65 and Des1 are inhibited by emixustat and fenretinide, respectively. Here, we tested the effects of these visual cycle inhibitors on immediate, early, and late phases of cone photopic vision. In zebrafish larvae raised under cyclic light conditions, fenretinide impaired late cone photopic vision, while the emixustat-treated zebrafish unexpectedly had normal vision. In contrast, emixustat-treated larvae raised under extensive dark-adaptation displayed significantly attenuated immediate photopic vision concomitant with significantly reduced 11-cis-retinaldehyde (11cRAL). Following 30 min of light, early photopic vision was recovered, despite 11cRAL levels remaining significantly reduced. Defects in immediate cone photopic vision were rescued in emixustat- or fenretinide-treated larvae following exogenous 9-cis-retinaldehyde supplementation. Genetic knockout of Des1 (degs1) or retinaldehyde-binding protein 1b (rlbp1b) did not eliminate photopic vision in zebrafish. Our findings define molecular and temporal requirements of the nonphotopic or photopic visual cycles for mediating vision in bright light.

Keywords: Rpe65; chemical biology; cone-based visual behavior; pharmacology; retina; vision; visual cycle; vitamin A; zebrafish.


Conflict of interest statement

The authors declare that they have no conflicts of interest with the contents of this article

Figures

Figure 1.
Figure 1.
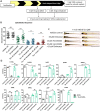
Fenretinide, but not emixustat, impairs late cone photopic vision in zebrafish larvae. A, schematic representation of experimental workflow. Zebrafish larvae were treated initially at 3 dpf, and the drug was replaced at 4 dpf. Larvae were incubated under standard lighting conditions (14 h light and 10 h dark) until OKR analysis at 5 dpf. B, OKR in 5 dpf larvae following treatment with 50 μm emixustat and 10 μm fenretinide. Data were analyzed by one-way ANOVA and Dunnett's multiple comparisons post hoc test, where ns = not significant (p > 0.05) and *** = p < 0.001. n = 30 larvae with three independent biological replicates. C, dorsal and lateral bright-field microscopy images of larvae following treatment with 50 μm emixustat or 10 μm fenretinide at 5 dpf. Scale bar = 2 mm. D, schematic overview mapping all possible mechanisms of cone chromophore regeneration in zebrafish, including the confirmed molecular targets of both emixustat and fenretinide. Proteins colored in blue depict fenretinide targets (Rbp4, Lrata, and Des1), and those in green highlight (potential) targets of emixustat (Rpe65a and Rpe65c) in zebrafish.
Figure 2.
Figure 2.
In dark-adapted zebrafish, emixustat blocks immediate photopic vision and fenretinide exerts an additive effect. A, optimization of dose and treatment time points for emixustat. Larval OKR at 5 dpf following treatment with 10, 20, or 50 μm emixustat at 3, 4, and 3 and 4 dpf. Data were analyzed by two-way ANOVA and Bonferroni post hoc test, where * = p < 0.05, ** = p < 0.01, and *** = p < 0.001. n = 30 larvae with three independent biological replicates. B, schematic representation of experimental workflow. Zebrafish larvae were initially treated with emixustat and/or fenretinide at 3 dpf, and drug(s) were replaced at 4 dpf. Larvae were incubated under dark conditions until OKR analysis at 5 dpf. C, larval OKR at 5 dpf following combination treatment with 50 μm emixustat and/or 10 μm fenretinide at days 3 and 4. Data were analyzed by two-way ANOVA and Bonferroni post hoc test, where ns = not significant and ** = p < 0.01. D, dorsal and lateral bright-field microscopy images of larvae at 5 dpf following treatment with 50 μm emixustat and/or 10 μm fenretinide. Scale bar = 2 mm. E, retinal morphology of 5 dpf larvae treated with 0.5% DMSO, 50 μm emixustat, or 10 μm fenretinide. Retinal bright-field images taken with a ×60 and ×100 objective. PRL, photoreceptor layer; OPL, outer plexiform layer; ONL, outer nuclear layer; IPL, inner plexiform layer; INL, inner nuclear layer. Scale bar = 50 and 20 μm, respectively. E′–G′, high-resolution images of photoreceptor outer segments (OS, yellow dotted line) and RPE in 5 dpf larvae. Scale bar = 5 μm. E″–G″, immunohistochemistry on transverse section across lens at 5 dpf. Double cones were stained with zpr-1 antibody. Scale bar = 20 μm.
Figure 3.
Figure 3.
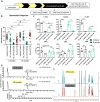
Visual cycle inhibitors modulate the profile of key retinoids in zebrafish. A, schematic representation of experimental workflow. Zebrafish larvae were initially treated with 50 μm emixustat and/or 10 μm fenretinide at 3 dpf, and the drug was replaced at 4 dpf. Larvae were incubated under dark conditions until the collection of larval heads for retinoid analysis at 5 dpf. B, retinoid profiles of 5 dpf larvae treated with emixustat and fenretinide, alone and in combination. Bars represent the mean ± S.D. of three independent experiments for each condition with 105 larval heads per biological replicate. Data were analyzed by a one-way ANOVA and Dunnett's multiple comparisons post hoc test, where * = p < 0.05, ** = p < 0.01, and *** = p < 0.001.
Figure 4.
Figure 4.
Supplementation with exogenous 9cRAL significantly improves immediate photopic vision in emixustat- and fenretinide-treated larvae. A, schematic representation of experimental workflow. Zebrafish larvae were treated initially at 3 dpf, and the drug was replaced at 4 dpf. 9cRAL was added to the medium 4 h following 50 μm emixustat and/or 10 μm fenretinide treatment on both 3 and 4 dpf. Larvae were incubated in the dark until OKR analysis at 5 dpf. B, larval OKR following addition of 10 μm 9cRAL to larvae previously treated with 50 μm emixustat and 10 μm fenretinide, alone or in combination at 3 and 4 dpf. Data were analyzed by unpaired, two-tailed t tests, where * = p < 0.05, ** = p < 0.01, and *** = p < 0.001. ns = not significant. n = 30 larvae with three independent biological replicates. C, dorsal and lateral bright-field microscopy images of larvae at 5 dpf larvae treated with 50 μm emixustat and/or 10 μm fenretinide in combination with 10 μm 9cRAL. Scale bar = 2 mm. D, retinoid profiles following exogenous 9cRAL supplementation in vehicle control and emixustat-treated zebrafish larvae. Bars represent the mean ± S.D. of three independent experiments for each condition with 105 larval heads per biological replicate. Data were analyzed by unpaired, two-tailed t tests, where * = p < 0.05, ** = p < 0.01, and *** = p < 0.001. ns = not significant.
Figure 5.
Figure 5.
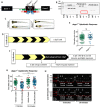
Early photopic vision recovers in emixustat-treated larvae following exposure to light. A, schematic representation of experimental workflow. Zebrafish larvae were treated initially at 3 dpf, and drug was replaced at 4 dpf. Larvae were incubated under dark conditions until analysis at 5 dpf. At 5 dpf, larvae were subjected to OKR immediately following dark adaptation (0 min) or following 30 min of light (30 min). B, OKR of 5 dpf larvae treated with 50 μm emixustat, 50 μm A1120, or 10 μm fenretinide 0 and 30 min following light exposure. Data were analyzed by unpaired, two-tailed t tests, where ns = not significant; *** = p < 0.001. n = 30 larvae with three independent biological replicates. C, retinoid profiles of 5 dpf larvae treated with 50 μm emixustat following no light exposure (0 min) or 30 min of light exposure (30 min). Bars represent the mean ± S.D. of three independent experiments for each condition with 105 larval heads per biological replicate. Data were analyzed by unpaired, two-tailed t tests, where ns = not significant and *** = p < 0.001. D, emixustat-extracted ion chromatograms (at m/z 264, RT 7.1 min) and high-resolution mass spectrum (m/z 264.1976 [M + H]+) highlighting no change in the MS profile of emixustat exposed to 30 min of light and samples that received no light (0 min). E, NMR light sensitivity analysis of emixustat. Emixustat was dissolved in DMSO-d6 (600 μl) covered with aluminum foil until 1H NMR and HSQC experiments were performed (0 min). The NMR tube was left exposed to visible light for 30 min, followed by a second NMR analysis (30 min). Peaks at 2.09 and 5.76 ppm correspond to acetone and dichloromethane, respectively.
Figure 6.
Figure 6.
In the absence of light, 30 min alone is not sufficient to restore vision or 11cRAL levels. A, schematic representation of experimental workflow. Zebrafish larvae were treated initially at 3 dpf, and drug was replaced at 4 dpf. Larvae were incubated under dark conditions until analysis at 5 dpf. At 5 dpf, emixustat was removed under dim red light 30 min before larvae were subjected to OKR immediately following dark adaptation (0 min) or following 30 min light adaptation (30 min). B, optokinetic response 30 min following removal of emixustat at 5 dpf larvae 0 and 30 min following light exposure. Data were analyzed by unpaired, two-tailed t tests, where ns = not significant, ** = p < 0.01, and *** = p < 0.001. n = 30 larvae with three independent biological replicates. C, retinoid profiles of 5 dpf larvae treated with 50 μm emixustat. Emixustat was removed 30 min before dissection at 0- or 30-min post light exposure. Bars represent the mean ± S.D. of three independent experiments for each condition with 105 larval heads per biological replicate. Data were analyzed by unpaired, two-tailed t-tests, where ns = not significant; ** = p < 0.01, and *** = p < 0.001.
Figure 7.
Figure 7.
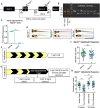
Des1 knockout does not eliminate cone photopic vision in zebrafish at 5 dpf. A, CRISPR/Cas9 knockout strategy of degs1 in zebrafish. Both guides were targeted to exon 2 to induce a 484-bp deletion in the degs1 gene that contains three exons in total. Forward primer 1 (FP1) to reverse primer 1 (RP1) amplifies an 807-bp genomic DNA WT product or a 323-bp product when deletion is present. For mRNA expression analysis, we used forward primer 2 (FP2) to reverse primer 2 (RP2), which span the deletion and amplify a 537-bp WT product or 61 bp when the deletion is present. Forward primer 3 (FP3) to reverse primer 3 (RP3) is nested within the deletion and amplifies a 162-bp WT product. B, agarose gel (1.5%) depicting degs1 expression in WT, degs1+/− or degs−/− zebrafish. L = 100-bp ladder. Red box highlights the 61-bp product expected following a deletion event with primer set 2 in degs1+/− or degs1−/− samples. C, dorsal and lateral bright-field microscopy images of untreated degs1 sibling (degs1+/+ or degs1+/−) and degs1−/− larvae at 5 dpf. Scale bar = 2 mm. D, schematic representation of experimental workflow. degs1−/− larvae were incubated under standard lighting conditions (14 h light and 10 h dark) until OKR analysis at 5 dpf. E, OKR of degs1−/− and sibling larvae at 5 dpf larvae following standard 14-h light and 10-h dark conditions. Data were analyzed by an unpaired, two-tailed t test, where ns = not significant (p > 0.05). n ≥30 larvae with three independent biological replicates. F, schematic representation of experimental workflow. Des1−/− larvae were treated initially with 50 μm emixustat at 3 dpf, and drug was replaced at 4 dpf. Larvae were incubated under dark conditions until analysis at 5 dpf. G, at 5 dpf, a mixed population of degs1−/− and unaffected sibling larvae were subjected to OKR immediately following dark adaptation (0 min) or following 30 min of light (30 min). Red points denote the larvae genotyped following OKR. Data were analyzed by an unpaired, two-tailed t test, where ns = not significant and *** = p < 0.001. n = 64 larvae per group with two independent biological replicates. H, agarose gel (1.5%) highlighting genotypes of high/low-responding larvae in OKR assay. White arrows denote degs1−/− larvae. Eight larvae were genotyped per group (×4 “low responders” and ×4 “high responders”). L = 100-bp ladder.
Figure 8.
Figure 8.
Knockout of RPE-expressed rlbp1b does not eliminate cone photopic vision in zebrafish at 5 dpf. A, CRISPR/Cas9 knockout strategy of RPE-expressed rlbp1b. Guides were targeted to exon 2 and exon 3 to induce a 1440-bp deletion in rlbp1b that contains seven exons. Forward primer 1 (FP1) to reverse primer 1 (RP1) amplifies a 1688-bp WT product or a 248-bp product when deletion is present. A poison forward primer (FP2) was designed in the middle of the deleted region to amplify a 469-bp WT product. B, agarose gel (1.5%) depicting the presence of the deletion in individual F2 larval genomic DNA. A WT control was used to amplify the upper band (469 bp), and gDNA from the injected F0 parent fin was used as a positive control to amplify both upper and lower bands (mosaic). L = 100-bp ladder. C, gene expression analysis of rlbp1b in rlbp1b−/− eyes. Data were analyzed by an unpaired, two-tailed t test, where *** = p < 0.001. Three independent biological replicates were performed with at least 10 larvae per replicate. D, dorsal and lateral bright-field microscopy images of untreated WT, rlbp1b+/−, and rlbp1b−/− larvae at 5 dpf. Scale bar = 2 mm. E, schematic representation of experimental workflow. Rlbp1b−/− larvae were incubated under standard lighting conditions (14 h light and 10 h dark) until OKR analysis at 5 dpf. F, late photopic vision was measured by OKR in 5 dpf larvae. Data were analyzed by an unpaired, two-tailed t test, where ns = not significant (p > 0.05). n = 36 larvae with three independent biological replicates. G, schematic representation of experimental workflow. Rlbp1b−/− larvae were treated initially with 50 μm emixustat at 3 dpf, and drug was replaced at 4 dpf. Larvae were incubated under dark conditions until analysis at 5 dpf. H, at 5 dpf larvae were subjected to OKR immediately following dark adaptation (0 min) or following 30 min of light (30 min). Data were analyzed by an unpaired, two-tailed t test, where ns = not significant and *** = p < 0.001. n = 36 larvae with three independent biological replicates.

Similar articles

Cited by

References

    1. Saari J. C. (2016) Vitamin A and Vision. In The Biochemistry of Retinoid Signaling II: Subcellular Biochemistry (Asson-Batres M. and Rochette-Egly C. eds), vol 81, pp. 231–259, Springer, Dordrecht
    1. Mata N. L., Moghrabi W. N., Lee J. S., Bui T. V., Radu R. A., Horwitz J., and Travis G. H. (2004) Rpe65 is a retinyl ester binding protein that presents insoluble substrate to the isomerase in retinal pigment epithelial cells. J. Biol. Chem. 279, 635–643 10.1074/jbc.M310042200 - DOI - PubMed
    1. Redmond T. M., Poliakov E., Yu S., Tsai J. Y., Lu Z., and Gentleman S. (2005) Mutation of key residues of RPE65 abolishes its enzymatic role as isomerohydrolase in the visual cycle. Proc. Natl. Acad. Sci. U.S.A. 102, 13658–13663 10.1073/pnas.0504167102 - DOI - PMC - PubMed
    1. Moiseyev G., Chen Y., Takahashi Y., Wu B. X., and Ma J. X. (2005) RPE65 is the isomerohydrolase in the retinoid visual cycle. Proc. Natl. Acad. Sci. U.S.A. 102, 12413–12418 10.1073/pnas.0503460102 - DOI - PMC - PubMed
    1. Fan J., Rohrer B., Frederick J. M., Baehr W., and Crouch R. K. (2008) Rpe65−/− and Lrat−/− mice: comparable models of leber congenital amaurosis. Invest. Ophthalmol. Vis. Sci. 49, 2384–2389 10.1167/iovs.08-1727 - DOI - PMC - PubMed

Publication types

MeSH terms

LinkOut - more resources