. 2020 Apr;22(4):412-424.
doi: 10.1038/s41556-020-0481-4. Epub 2020 Mar 16.

Copper is an essential regulator of the autophagic kinases ULK1/2 to drive lung adenocarcinoma

Affiliations

Copper is an essential regulator of the autophagic kinases ULK1/2 to drive lung adenocarcinoma

Tiffany Tsang et al. Nat Cell Biol. 2020 Apr.

Abstract

Although the transition metal copper (Cu) is an essential nutrient that is conventionally viewed as a static cofactor within enzyme active sites, a non-traditional role for Cu as a modulator of kinase signalling is emerging. Here, we found that Cu is required for the activity of the autophagic kinases ULK1 and ULK2 (ULK1/2) through a direct Cu-ULK1/2 interaction. Genetic loss of the Cu transporter Ctr1 or mutations in ULK1 that disrupt the binding of Cu reduced ULK1/2-dependent signalling and the formation of autophagosome complexes. Increased levels of intracellular Cu are associated with starvation-induced autophagy and are sufficient to enhance ULK1 kinase activity and, in turn, autophagic flux. The growth and survival of lung tumours driven by KRASG12D is diminished in the absence of Ctr1, is dependent on ULK1 Cu binding and is associated with reduced levels of autophagy and signalling. These findings suggest a molecular basis for exploiting Cu-chelation therapy to prevent autophagy signalling to limit proliferation and improve patient survival in cancer.


Conflict of interest statement

Competing interests. D.C.B holds ownership in Merlon Inc. D.C.B. is an inventor on the patent application 20150017261 entitled “Methods of treating and preventing cancer by disrupting the binding of copper in the MAP kinase pathway”. No potential conflicts of interest were disclosed by the other authors.

Figures

Extended Data 1.
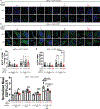
Extended Data 1.. Cu is both necessary and sufficient for ULK1 and ULK2 kinase activity.
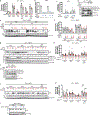
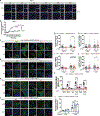
a,b,c,d, Scatter dot plot with bar at mean normalized ΔPhosphorylated (P)-ATG13/Total (T)-ATG13 from Figure 1d,e,g. n=3 biologically independent experiments, Figure 1d,e,g, or n=4 biologically independent experiments, Figure 1f. Results were compared using a one-way ANOVA followed by a Tukey’s multi-comparisons test. 0 vs. 50 μM TTM, *, P=0.0151; 0 vs. 10 μM MRT68921, *, P=0.0395. e, RT-PCR detection of indicated mRNAs from Ctr1+/+ MEFs or Ctr1−/− MEFs stably expressing CTR1WT (WT) or empty vector (VO). n=1 biologically independent sample. f, Scatter dot plot of inductively coupled plasma mass spectrometry (ICP-MS) detection with bar at mean Cu (parts per million, ppm) from Ctr1+/+ MEFs (+/+) or Ctr1−/− MEFs stably expressing WT or VO per sample weight ± s.e.m. n=3 biologically independent samples. Results were compared using a one-way ANOVA followed by a Tukey’s multi-comparisons test. *, P=0.05 0.0202; **, P=0.0059. g, Representative live cell imaging of the Cu probe CF4 or control Cu probe Ctrl-CF4 from Ctr1+/+ MEFs (+/+) or Ctr1−/− MEFs stably expressing WT or VO. Scale bar, 100 μm. h, Scatter dot plot with bar at mean CF4 or Ctrl-CF4 fluorescence intensity (FI) ± s.e.m. from Ctr1+/+ MEFs (+/+) or Ctr1−/− MEFs stably expressing WT or VO. n=90 individual cells. Results were compared using a one-way ANOVA followed by a Tukey’s multi-comparisons test. ****, P<0.0001. i,j,k, Scatter dot plot with bar at mean normalized ΔP-ATG13/T-ATG13 from Figure 1h,i,j. n=3 biologically independent experiments. Results were compared using a one-way ANOVA followed by a Tukey’s multi-comparisons test, an unpaired, two-tailed Student’s t-test, or two-way ANOVA followed by a Sidak’s multi-comparisons test. ns.
Extended Data 2.
Extended Data 2.. Copper is both necessary and sufficient for autophagy induction and signaling in a MAPK signaling independent fashion, upstream of ATG5.
a, Scatter dot plot with bar at mean normalized ΔLC3-II/β-ACTIN from Figure 2a. n=3 biologically independent experiments. Results were compared using a two-way ANOVA followed by a Sidak’s multi-comparisons test. ns. b, Scatter dot plot with bar at mean normalized expression of Atp7a mRNA from MEFs n=1 biologically independent experiment performed in technical triplicate. c, Scatter dot plot with bar at mean normalized ΔLC3-II/β-ACTIN from Figure 2e. n=4 biologically independent experiments. Results were compared using a two-way ANOVA followed by a Sidak’s multi-comparisons test. ns. d, Immunoblot detection of proteins from MEFs. e, Immunoblot detection of proteins from treated MEFs. Quantification: ΔLC3-II/β-ACTIN normalized to fl/fl, empty vector (−), VEH control. f, Scatter dot plot with bar at mean normalized ΔLC3-II/β-ACTIN from Extended Data 2e. n=3 biologically independent experiments. Results were compared using a two-way ANOVA followed by a Tukey’s multi-comparisons test. ns. g, Immunoblot detection of proteins from treated MEFs. Quantification: ΔLC3-II/β-ACTIN normalized to WT, VEH control. h, Scatter dot plot with bar at mean normalized ΔLC3-II/β-ACTIN from Extended Data 2g. n=6 biologically independent experiments. Results were compared using a two-way ANOVA followed by a Tukey’s multi-comparisons test. ns. i, Immunoblot detection of proteins from MEFs. j, Immunoblot detection of proteins from treated MEFs. Quantification: ΔLC3-II/β-ACTIN normalized to WT, VEH control. k, Scatter dot plot with bar at mean normalized ΔLC3-II/β-ACTIN from Extended Data 2j. n=5 biologically independent experiments. Results were compared using a two-way ANOVA followed by a Tukey’s multi-comparisons test. *, P=0.0071; **, P=0.0434; ***, P=0.0026; ****, P=0.0021. l, Immunoblot detection of proteins from treated MEFs. Western blot images are representative of at least three biological replicates.
Extended Data 3.
Extended Data 3.. Cu but not Fe is required for autophagosome formation and is associated with fluctuations in the Cu labile pool.
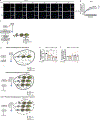
a, Representative live cell imaging of the Cu probe Ctrl-CF4 every ten minutes for 60 minutes from MEFs treated with vehicle (VEH) or amino acid deprivation (-AA). Scale bar, 100 μm. b, Mean Ctrl-CF4 fluorescence intensity (FI) ± s.e.m. versus time (minutes, min) from MEFs treated with VEH or -AA normalized to t=0, five minutes. n=30 individual cells. Results were compared using a two-way ANOVA followed by a Sidak’s multi-comparisons test. c, Schematic of immunofluorescence-based approach to access autophagosome formation. d, Schematic of flow cytometry-based approach to access autophagosome number. e,f, Scatter dot plot with bar at mean GFP-LC3 fluorescent intensity ± s.e.m. analyzed by flow cytometry from MEFs stably expressing EGFP-LC3B treated VEH or increasing concentrations of Cu chelator TTM (e) or Fe chelator DFO (f). n=9 biologically independent samples. Results were compared using a one-way ANOVA followed by a Dunnett’s multi-comparisons test. *, P=0.0148; ****, P<0.0001.
Extended Data 4.
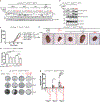
Extended Data 4.. Genetic ablation of Ctr1 reduces KrasG12D-driven lung tumorigenesis.
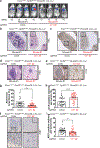
a, Normalized representative images of in vivo luminescence of KrasG12D/+;Trp53flox/flox;Rosa26::LSL-Luc (KPLuc) mice introduced with either sgRNA against β-GAL or Ctr1 at week 16 endpoint. b,c, Scatter dot plot with bar at mean ΔLuminescence units from week 10 to week 16 from KPLuc mice introduced with either sgRNA against β-GAL or Ctr1. n=6 biologically independent animals. Results were compared using an unpaired, one-tailed Student’s t-test. P=0.0818.
Extended Data 5.
Extended Data 5.. Genetic ablation of Ctr1 decreases MAPK signaling to reduce KrasG12D-driven lung tumorigenesis, while survival in response starvation is independent of MAPK signaling.
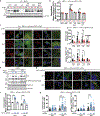
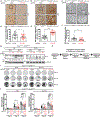
a, Representative 40x images of immunohistochemical detection of phosphorylated (P)-ERK1/2 of lungs from KPLuc mice expressing sgRNA against β-GAL or Ctr1. (40x scale bar: 50 μm). b, Scatter dot plot with bar at mean ± s.e.m. % P-ERK1/2 positive staining per tumor (β-GAL and Ctr1) from KPLuc mice expressing sgRNA against β-GAL or Ctr1. n=66 images. Results were compared using an unpaired, two-tailed Student’s t-test. ***, P=0.0002. c, Scatter dot plot with bar at mean normalized quantitative PCR (qPCR) expression of Ctr1 mRNA from KP lung adenocarcinoma cell lines #54 (KP #54) and #2474 (KP #2474) stably expressing sgRNA against Rosa () or Ctr1 (#1 or #2). n=1 performed in technical triplicate. d, Scatter dot plot with bar at mean normalized ΔLC3-II/β-ACTIN from Figure 5g. n=3 independent experiments. Results were compared using a two-way ANOVA followed by a Tukey’s multi-comparisons test. ns. e, Representative crystal violet images of KP #54 and KP #2474 cells stably expressing sgRNA against Rosa, Atg5, or Ctr1 (#1 or #2) and ERK2GOF from days 3, 4, and 5 of recovery. f, Scatter dot plot with bar at mean absorbance of extracted crystal violet at 590nM ± s.e.m. of KP #54 and KP #2474 cells stably expressing sgRNA against Rosa, Atg5, or Ctr1 (#1 or #2) and gain-of-function (GOF) HA-ERK2 (ERK2GOF) from days 3, 4, and 5 of recovery normalized to Rosa, day 3 control. KP #54, n=# biologically independent samples; Day 3=9, Day 4=9, Day 5, Rosa=8, Atg5=9, #1=9, #2=9. *, P=0.0140; ***, P=0.0003. KP #2474, n=# biologically independent samples; Day 3=9, Day 4=9, Day 5, Rosa=9, Atg5=9, #1=8, #2=8. *, P=0.0011; **, P=0.0158; ***, P=0.0462.
Extended Data 6.
Extended Data 6.. Binding of Cu to ULK1 is required for kinase activity but not substrate association or phosphorylation.
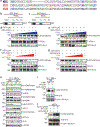
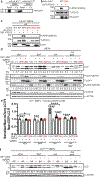
a, Immunoblot detection of phosphorylated (P) ATG13, total (T)- ATG13, P-ULK1 (S555), P-ULK1 (S757), T-ULK1, or β-ACTIN from Ulk1/2−/− MEFs stably expressing HA-ULK1WT (WT) or HA-ULK1CBM (CBM) treated with vehicle (VEH) or amino acid deprivation (-AA). b, Immunoblot detection of T-ULK1 or β-ACTIN from cell lysates treated with or without calf alkaline phosphatase (CIP) from Ulk1/2−/− MEFs stably expressing empty vector (VO), HA-ULK1WT (WT), or HA-ULK1CBM (CBM). c, Immunoblot detection of T-ATG13, T-ATG101, T-FIP200, T-ULK1, or β-ACTIN from immunoprecipitated (IP)-ULK1 or whole cell extracts (WCE) from Ulk1/2−/− MEFs stably expressing HA-ULK1WT (WT) or HA-ULK1CBM (CBM) treated with VEH or -AA. d, Scatter dot plot with bar at mean normalized quantitative PCR (qPCR) expression of Ulk1 or Ulk2 mRNA from MEFs stably expressing sgRNA against Rosa or Ulk1 and Ulk2. n=1 performed in technical triplicate. e, Immunoblot detection of T-ULK1, T-ULK2, or β-ACTIN from MEFs stably expressing sgRNA against Rosa () or Ulk1 and Ulk2 (+). f, Immunoblot detection of LC3-I, LC3-II, or β-ACTIN from MEFs stably expressing sgRNA against Rosa () or Ulk1 and Ulk2 (+) treated with -AA and bafilomycin (BAF) for 1 hour (hr), 2 hr, and 3hr. g,h,i, Scatter dot plot with bar at mean normalized ΔLC3-II/β-ACTIN or ΔP-ATG13/T-ATG13 from Figure 6d,f. n=3 independent experiments. Results were compared using a two-way ANOVA followed by a Tukey’s multi-comparisons test. g, ns; h, ****, P<0.0001. i, *, P=0.0365; ****, P<0.0001. Western blot images are representative of at least three biological replicates.
Extended Data 7.
Extended Data 7.. Binding of Cu to ULK1 is required for tumorigenesis by oncogenic KRASG12D.
a, Mean tumor volume (mm3) ± s.e.m. versus time (days) in mice injected with Ulk1−/− MEFs stably expressing either HA-ULK1WT or HA-ULK1CBM and transformed with KRASG12D. n=4 biologically independent animals. Results were compared using a paired, one-tailed Student’s t-test. **, P=0.0095. b, Representative dissected tumors from mice injected with Ulk1−/− MEFs stably expressing either HA-ULK1WT (WT) or HA-ULK1CBM (CBM) and transformed with KRASG12D. Scale bar, 100 μm. c, Scatter dot plot with bar at mean tumor weight (g) ± s.e.m. of tumors at endpoint from Ulk1−/− MEFs stably expressing either WT or CBM and transformed with KRASG12D. n=4 biologically independent samples. Results were compared using an unpaired, one-tailed Student’s t-test. *, P=0.0325. n=4. d, Immunoblot detection of T-ULK1, T-ULK2, or β-ACTIN from KrasG12D/+;Trp53flox/flox (KP) lung adenocarcinoma cell line #2474 (KP #2474) stably expressing sgRNA against Rosa () or Ulk1 and Ulk2 (+). e,f, Scatter dot plot with bar at mean normalized ΔLC3-II/β-ACTIN or ΔP-ATG13/T-ATG13 from Figure 8a,b. n=3 independent experiments. Results were compared using a one-way ANOVA or a two-way ANOVA followed by a Tukey’s multi-comparisons test. e, **, P=0.0013; ***, P=0.0016; ****, P<0.0001; f, *, P=0.0113; **, P=0.0063; ***, P=0.0113. g, Scatter dot plot with bar at mean normalized quantitative PCR (qPCR) expression of Ctr1 mRNA from KP #2474 cells stably expressing sgRNA against Rosa, Ctr1 #2, or Ulk1, Ulk2, and Ctr1 #2. n=1 performed in technical triplicate.
Figure 1.
Figure 1.. Cu binds to ULK1 and ULK2 and is required for kinase activity.
a, The amino-acid sequence of human MEK1 aligned to human ULK1 and human ULK2. Black letters, amino acids; blue letters, the four amino acids mutated in Cu-binding mutant (CBM) of MEK1 to decrease Cu binding and those conserved between ULK1 and ULK2. b,c, Immunoblot detection of recombinant GST-ULK1 or GST-ULK2 bound to a resin charged with or without Cu, Fe, or Zn compared to input. n=3 biologically independent experiments. d,e,f,g, Immunoblot detection of recombinant phosphorylated (P)-ATG13, total (T)-ATG13, and GST-ULK1 or GST-ULK2 from ULK1 or ULK2 in vitro kinase assays treated with or without increasing concentrations of CuCl2 from 0 to 10 μM (d,e), with or without increasing concentrations of TTM from 0 to 50 μM, or 10 μM MRT68921 (f,g). Quantification: ΔP-ATG13/T-ATG13 normalized to GST-ULK1 and GST-ATG13 alone. d,e,g, n=3 biologically independent experiments. g, n=4 biologically independent experiments. h, Immunoblot detection of P- and/or T- mTOR, p70S6K, ULK1, ATG13, CCS, or β-ACTIN from Ctr1−/− MEFs stably expressing CTR1WT (WT) or empty vector (VO) treated with vehicle (VEH) or amino acid deprivation (-AA). Quantification: ΔP-ATG13/T-ATG13 normalized to WT, VEH control. n=3 biologically independent experiments. i,j, Immunoblot detection of recombinant P-ATG13, T-ATG13, or immunoprecipitated (IP)-ULK1 from immunocomplex ULK1 kinase assays from Ctr1−/− MEFs stably expressing WT or VO treated with VEH or -AA or MEFs stably expressing sgRNA against Rosa (−) or Atp7a (#1 or #2). Quantification: ΔP-ATG13/T-ATG13 normalized to WT, VEH control or Rosa () control. n=3 biologically independent experiments.
Figure 2.
Figure 2.. Genetic ablation or enhancement in intracellular Cu levels modulates autophagic flux.
a, Immunoblot detection of proteins from treated MEFs. Quantification: ΔLC3-II/β-ACTIN normalized to WT, VEH control. n=3 biologically independent experiments. b, Scatter dot plot with bar at mean mCherry-LC3 fluorescent intensity (FI)/mean EGFP-LC3 FI ± s.e.m. analyzed by flow cytometry from treated MEFs. N represents number[AU please clarify what the number is here.] of biologically independent samples, VEH n=16; BAF n=7; -AA n=7; -AA+BAF n=7; RAP, WT n=16, VO n=15; RAP+BAF n=13. Results were compared using a two-way ANOVA followed by a Sidak’s multi-comparisons test. **, P=0.0035; ****, P<0.0001. c, Representative fluorescence images of EGFP, mCherry, or the merge from treated MEFs. Scale bar, 20 μm. d, Scatter dot plot with bar at mean mCherry+-LC3 or mCherry+ EGFP+-LC3 puncta per cell ± s.e.m. from treated MEFs. Results were compared using a two-way ANOVA followed by a Sidak’s multi-comparisons test. n represents number of [AU please clarify the number which n represents] fields of view. Top, VEH n=30; BAF, WT n=30, VO n=29; -AA, WT n=30, VO n=28; RAP n=30; ***, P=0.0006; ****; P<0.001; Bottom, VEH, WT n=29, VO n=30; BAF, WT n=30, VO n=29; -AA, WT n=30, VO n=29; RAP, WT n=32, VO n=31; *, P=0.0147, ***; P=0.0009; ****, P<0.0001. e, Immunoblot detection of proteins from treated MEFs. Quantification: ΔLC3-II/T- β-ACTIN and ΔP-ERK1/2/T-ERK1/2 normalized to Rosa (), VEH control. n=4 biologically independent experiments. f, Scatter dot plot with bar at mean mCherry-LC3 fluorescent intensity (FI)/mean EGFP-LC3 FI ± s.e.m. analyzed by flow cytometry from treated MEFs. n=9 biologically independent samples. Results were compared using a two-way ANOVA followed by a Sidak’s multi-comparisons test. ****, P<0.0001. g, Representative fluorescence images of EGFP, mCherry, or the merge from treated MEFs. Scale bar, 20 μm. h, Scatter dot plot with bar at mean mCherry+-LC3 or mCherry+ EGFP+-LC3 puncta per cell ± s.e.m. from treated MEFs. Results were compared using a two-way ANOVA followed by a Sidak’s multi-comparisons test. n represents number of [AU please clarify this number] fields of view. Left, VEH, Rosa n=30, #1 n=29, #2 n=26, BAF, Rosa n=24, #1 n=29, #2 n=30; **, P=0.00911; ****, P<0.0001; Right, VEH, Rosa n=30, #1 n=27, #2 n=30; BAF, Rosa n=26, #1 n=29, #2 n=30; **, P=0.0042; ****, P<0.0001.
Figure 3.
Figure 3.. Cu is both necessary and sufficient for autophagosome formation.
a, Representative live cell imaging of the Cu probe CF4 every ten minutes for 60 minutes from MEFs treated with vehicle (VEH) or amino acid deprivation (-AA). Scale bar, 100 μm. b, Mean CF4 fluorescence intensity (FI) ± s.e.m. versus time (minutes, min) from MEFs treated with VEH or -AA normalized to t=0, five minutes. n=30 individual cells. Results were compared using a two-way ANOVA followed by a Sidak’s multi-comparisons test. ****, P<0.0001. c,d,e,f, Representative fluorescence images of EGFP-ATG13 (c), EGFP-FIP200 (d), EGFP-WIP1 (e), or EGFP-DFCP1 (f) from Ctr1−/− MEFs stably expressing CTR1WT (WT) or empty vector (VO) and EGFP-ATG13, EGFP-FIP200, EGFP-WIP1, or EGFP-DFCP1 treated with VEH or -AA. Scale bar, 20 μm. g,h,i,j, Scatter dot plot with bar at mean EGFP+ puncta per cell ± s.e.m. from Ctr1−/− MEFs stably expressing WT or VO and EGFP-ATG13 (g), EGFP-FIP200 (h), EGFP-WIP1 (i), or EGFP-DFCP1 (j) treated with VEH or -AA. N represents number of[AU please clarify this number] fields of view. EGFP-ATG13, VEH, WT n=27, VO n=26; -AA, WT n=26, VO n=27. EGFP-FIP200, VEH n=28; -AA, WT n=27, VO n=28. EGFP-WIP1, VEH, WT n=29, VO n=18; -AA, WT n=29, VO n=24. EGFP-DFCP1, VEH n=24, -AA n=29. Results were compared using a two-way ANOVA followed by a Sidak’s multi-comparisons test. **, P=0.0057; ****, P<0.0001. k, Scatter dot plot with bar at mean EGFP-LC3 FI ± s.e.m. analyzed by flow cytometry from Ctr1−/− MEFs stably expressing WT or VO and EGFP-LC3B treated with VEH, -AA, or RAP with or without BAF normalized to WT, VEH control. Results were compared using a two-way ANOVA followed by a Sidak’s multi-comparisons test. n=12 biologically independent samples. ****, P<0.0001. l, Scatter dot plot with bar at mean EGFP-LC3 FI ± s.e.m. analyzed by flow cytometry from MEFs stably expressing sgRNA against Rosa (−) or Atp7a (#1 or #2) and EGFP-LC3B treated with VEH or BAF normalized to Rosa (), VEH control. n=9 biologically independent samples. Results were compared using a two-way ANOVA followed by a Tukey’s multi-comparisons test. ***, P=0.0002; ****, P<0.0001.
Figure 4.
Figure 4.. Genetic ablation of Ctr1 decreases proliferation to reduce tumorigenesis in a mouse model of KrasG12D-driven lung cancer.
a, Normalized representative images of in vivo luminescence of KrasG12D/+;Trp53flox/flox;Rosa26::LSL-Luc (KPLuc) mice introduced with either sgRNA against β-GAL or Ctr1 at indicated time points. n=6 biologically independent animals. b,c,d,e,f, Representative images of H&E stained (b,−5x stitched images, d-5x); immunohistochemical detection of CCS (c-5x stitched images, e-5x), or Ki67 (f-40x) of lungs from KPLuc mice expressing sgRNA against β-GAL or Ctr1 (5x stitched scale bar: 250 μm; 5x scale bar: 250 μm; 40x scale bar: 50 μm). g,h,i, Scatter dot plot with bar at mean ± s.e.m. % abnormal lung tissue (g, β-GAL, n=36 images; Ctr1, n=35 images), % CCS positive staining per tumor (h, β-GAL, n=35 images; Ctr1, n=36 images), or % Ki67 positive staining per tumor (i, n=36 images) from KPLuc mice expressing sgRNA against β-GAL or Ctr1. Results were compared using an unpaired, one-tailed Student’s t-test. **, P=0.0025; ***, P=0.0006; ****, P<0.0001.
Figure 5.
Figure 5.. Genetic ablation of Ctr1 decreases autophagy to reduce tumorigenesis and sensitizes cancer cells to starvation in a mouse model of KrasG12D-driven lung cancer.
a,b,c, Representative images of immunohistochemical detection of LC3 (a-40x) or p62 (b-40x); or electron microscopy (EM) (c) of lungs from KPLuc mice expressing sgRNA against β-GAL or Ctr1 (40x scale bar: 50 μm; EM scale bar: 1 μm). d,e,f, Scatter dot plot of mean ± s.e.m. % LC3 positive staining per tumor (d, n=35 images), % p62 positive staining per tumor (e, n=35 images), or autophagosome number per tumor cell (f, β-GAL, n=31 images; Ctr1, n=30 images) from KPLuc mice expressing sgRNA against β-GAL or Ctr1. Results were compared using an unpaired, one-tailed Student’s t-test. d, **, P=0.0098; e, ****, P<0.0001; f, **, P=0.0024. g, Immunoblot detection of LC3-I, LC3-II, or β-ACTIN from KP lung adenocarcinoma cell lines #54 (KP #54) and #2474 (KP #2474) stably expressing sgRNA against Rosa (−) or Ctr1 (#1 or #2) treated with vehicle (VEH) or bafilomycin (BAF). Quantification: ΔLC3-II/β-ACTIN normalized to Rosa (), VEH control. n=3 biologically independent experiments. h, Schematic of clonogenic survival assay in response to starvation. KP #54 and KP #2474 cells stably expressing sgRNA against Rosa, Atg5, or Ctr1 following one day of starvation (EBSS) were recovered for three days in normal medium (DMEM). i, Representative crystal violet images of KP #54 and KP #2474 cells stably expressing sgRNA against Rosa, Atg5, or Ctr1 (#1 or #2) from days 3, 4, and 5 of recovery. j, Scatter dot plot with bar at mean absorbance of extracted crystal violet at 590nM ± s.e.m. of KP #54 and KP #2474 cells stably expressing sgRNA against Rosa, Atg5, or Ctr1 (#1 or #2) from days 3, 4, and 5 of recovery normalized to Rosa, day 3 control. Results were compared using a two-way ANOVA followed by a Tukey’s multi-comparisons test. KP #54, n represents number of biologically independent samples; Day 3 n=12, Day 4 n=12, Day 5, Rosa n=11, Atg5 n=12, #1 n=12, #2 n=12. *, P=0.0344; **, P=0.0209; ***, P=0.0010; ****, P=0.0229. KP #2474, n=9 biologically independent samples; *, P=0.0228; **, P=0.0191; ***, P=0.0148; ****, P<0.0001.
Figure 6.
Figure 6.. Binding of Cu to ULK1 is required for autophagy signaling and induction.
a, Immunoblot detection of recombinant HA-ULK1WT or Cu binding mutant HA-ULK1CBM bound to a resin charged with or without Cu compared to input. n=3 biologically independent experiments. b, Immunoblot detection of recombinant phosphorylated (P)-ATG13, total (T)-ATG13, and HA-ULK1WT or HA-ULK1CBM from ULK1 in vitro kinase assays. n=3 biologically independent experiments. c, Immunoblot detection of recombinant P-ATG13, T-ATG13, or immunoprecipitated (IP)-ULK1 from Ulk1/2−/− MEFs stably expressing HA-ULK1WT (WT) or HA-ULK1CBM (CBM) treated with amino acid deprivation (-AA). n=3 biologically independent experiments. d, Immunoblot detection of LC3-I, LC3-II, P-ULK1, T-ULK1, P-ATG13, T-ATG13, or β-ACTIN from MEFs stably expressing sgRNA against Rosa (−) reconstituted with empty vector (VO) or sgRNA against Ulk1 and Ulk2 reconstituted with empty vector (VO), HA-ULK1WT (WT), or HA-ULK1CBM (CBM) treated with vehicle (VEH) or -AA with or without bafilomycin (BAF). Quantification: ΔLC3-II/β-ACTIN and ΔP-ATG13/T-ATG13 normalized to Rosa (−), VO, VEH control. n=3 biologically independent experiments. e, Scatter dot plot with bar at mean mCherry-LC3 fluorescent intensity (FI)/mean EGFP-LC3 FI ± s.e.m. analyzed by flow cytometry from MEFs stably expressing sgRNA against Rosa (−) reconstituted with VO or sgRNA against Ulk1 and Ulk2 reconstituted with VO, WT, or CBM and mCherry-EGFP-LC3B treated with VEH or -AA with or without BAF normalized to Rosa (), VO, VEH control. n= number of biologically independent samples; VO=9, VO=9, WT=9, CBM=8. Results were compared using a two-way ANOVA followed by a Tukey’s multi-comparisons test. *, P=0.0335; ***, P=0.0002; ****, P<0.0001. f, Immunoblot detection of LC3-I, LC3-II, or β-ACTIN from Ctr1flox/flox (fl/fl) or Ctr1−/− (−/−) MEFs stably expressing sgRNA against Rosa (−) or sgRNA against Ulk1 and Ulk2 (+) treated with VEH or -AA with or without BAF. Quantification: ΔLC3-II/β-ACTIN normalized to Ctr1flox/flox, Rosa (−), VEH control. n=4 biologically independent experiments.
Figure 7.
Figure 7.. Binding of Cu to ULK1 is required for autophagosome complex formation.
a,b, Representative fluorescence images of EGFP-FIP200 (a) or EGFP-WIP1 (b) from MEFs stably expressing sgRNA against Rosa (−) reconstituted with VO or sgRNA against Ulk1 and Ulk2 reconstituted with VO, WT, or CBM and EGFP-FIP200 or EGFP-WIP1 treated with VEH or -AA. Scale bar, 20 μm. c,d, Scatter dot plot with bar at mean mean EGFP+ puncta per cell ± s.e.m. from MEFs stably expressing sgRNA against Rosa (−) reconstituted with VO or sgRNA against Ulk1 and Ulk2 reconstituted with VO, WT, or CBM and EGFP-FIP200 (c) or EGFP-WIP1 (d) treated with VEH or -AA. n represents number offields of view. EGFP-FIP200, VEH, VO=30, VO=27, WT=28, CBM=27; -AA, VO=26, VO=28, WT=28, CBM=29; EGFP-WIP1, VEH, VO=30, VO=28, WT=30, CBM=28; -AA, VO=29, VO=30, WT=29, CBM=30. Results were compared using a two-way ANOVA followed by a Sidak’s multi-comparisons test. *, P=0.0394; ****, P<0.0001. e, Scatter dot plot with bar at mean EGFP-LC3 FI ± s.e.m. analyzed by flow cytometry from MEFs stably expressing sgRNA against Rosa (−) reconstituted with VO or sgRNA against Ulk1 and Ulk2 reconstituted with VO, WT, or CBM and EGFP-LC3B treated with VEH or -AA with or without BAF normalized to Rosa (), VO, VEH control. N represents number of biologically independent samples. VO=9, VO=9, WT=9, CBM=8. Results were compared using a two-way ANOVA followed by a Sidak’s multi-comparisons test. *, P=0.0083; **, P=0.0321; ***, P=0.0125; ****, P<0.0001; *****, P<0.0001; ******, P=0.0002.
Figure 8.
Figure 8.. Binding of Cu to ULK1 is required for KRASG12D-driven tumor growth and cancer cell survival in response to starvation.
a, Immunoblot detection of proteins from treated KP cells. Quantification: ΔLC3-II/β-ACTIN normalized to Rosa (−), VO, VEH control. n=3 biologically independent experiments. b, Immunoblot detection of proteins from treated KP cells. Quantification: ΔP-ATG13/T-ATG13 normalized to Rosa (−), VO, VEH control. n=3 biologically independent experiments. c, Mean tumor volume (mm3) ± s.e.m. versus time (days) in mice injected with KP cells. n=4 biologically independent animals. Results were compared using a paired, two-tailed Student’s t-test. Rosa vs. Atg5, *, P=0.0228; Rosa vs. Ulk1/2, *, P=0.0176; Ulk1/2 vs. Ulk1/2 + ULK1WT, *, P=0.0199; Rosa vs. Ulk1/2 + ULK1CBM, *, P=0.0116; Ulk1/2 + ULK1WT vs. Ulk1/2 + ULK1CBM, *, P=0.0157. d, Representative dissected tumors from mice injected with KP cells. Scale bar, 100 μm. e, Scatter dot plot with bar at mean tumor weight (g) ± s.e.m. of KP tumors at endpoint. n=4 biologically independent animals. Results were compared using a two-way ANOVA followed by a Tukey’s multi-comparisons test. *, P=0.0001; **, P=0.0001; ***, P<0.0001; ****, P=0.0007. f, Representative crystal violet images of KP cells from days 3, 4, and 5 of recovery. g, Scatter dot plot with bar at mean absorbance of extracted crystal violet at 590nM ± s.e.m. of KP cells from days 3, 4, and 5 of recovery normalized to Rosa, day 3 control. N represents number of biologically independent samples. Rosa=9, Ctr1 #2 n=9, Ulk1/2 n=12, Ctr1 #2 + Ulk1/2 n=9. Results were compared using a two-way ANOVA followed by a Tukey’s multi-comparisons test. **, P=0.0010; ***, P=0.0002; ****, P<0.0001.

Comment in

Similar articles

Cited by

References

    1. Kolch W, Halasz M, Granovskaya M & Kholodenko BN The dynamic control of signal transduction networks in cancer cells. Nat. Rev. Cancer 15, 515–527 (2015). - PubMed
    1. Festa RA & Thiele DJ Copper: an essential metal in biology. Curr. Biol 21, R877–83 (2011). - PMC - PubMed
    1. Chelly J et al. Isolation of a candidate gene for Menkes disease that encodes a potential heavy metal binding protein. Nat. Genet 3, 14–19 (1993). - PubMed
    1. Mercer JFB et al. Isolation of a partial candidate gene for Menkes disease by positional cloning. Nat. Genet 3, 20–25 (1993). - PubMed
    1. Huster D et al. Consequences of copper accumulation in the livers of the Atp7b−/−(Wilson disease gene) knockout mice. Am. J. Pathol 168, 423–434 (2006). - PMC - PubMed

Publication types

MeSH terms