

Upregulation of LncRNA PVT1 Facilitates Pancreatic Ductal Adenocarcinoma Cell Progression and Glycolysis by Regulating MiR-519d-3p and HIF-1A
- PMID: 32201527
- PMCID: PMC7066006
- DOI: 10.7150/jca.37959
Upregulation of LncRNA PVT1 Facilitates Pancreatic Ductal Adenocarcinoma Cell Progression and Glycolysis by Regulating MiR-519d-3p and HIF-1A
Abstract
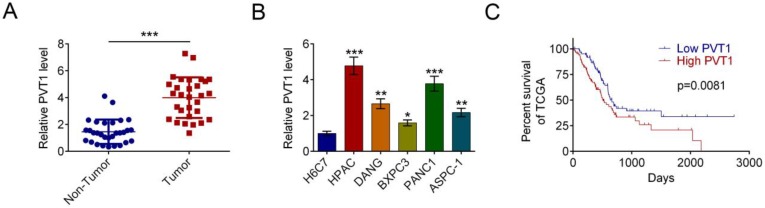
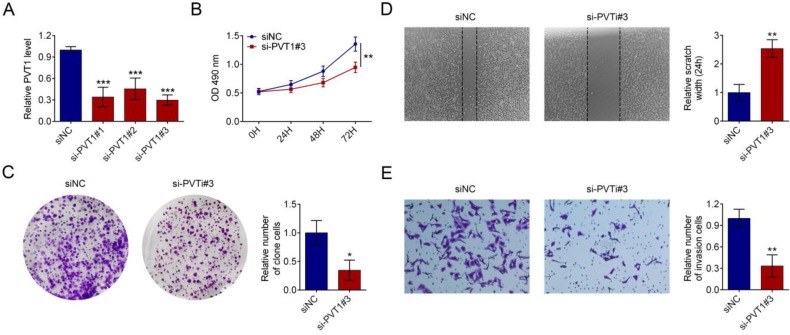
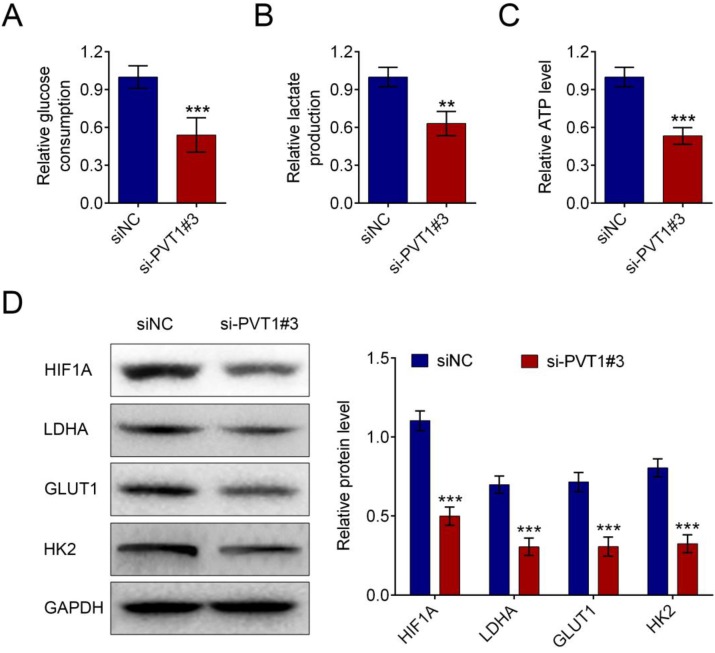
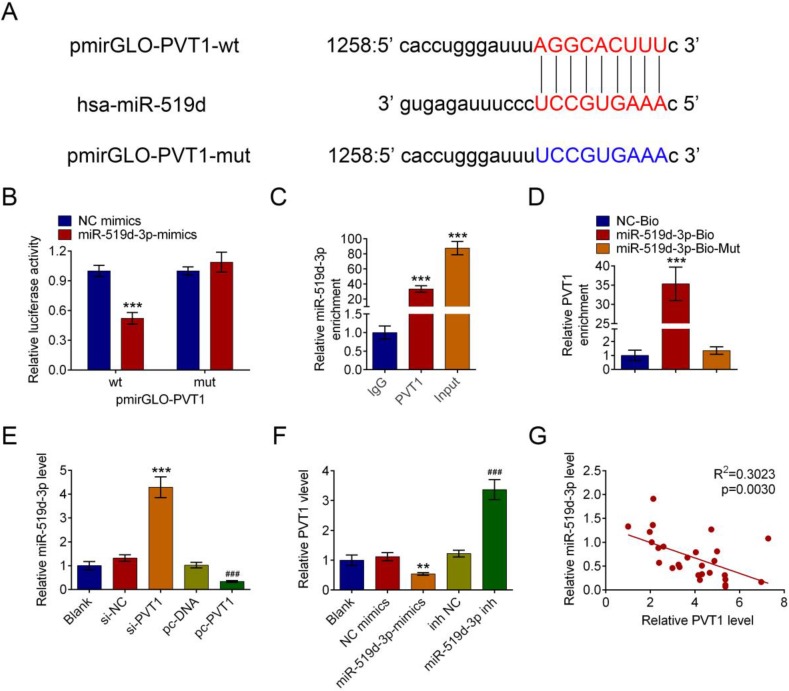
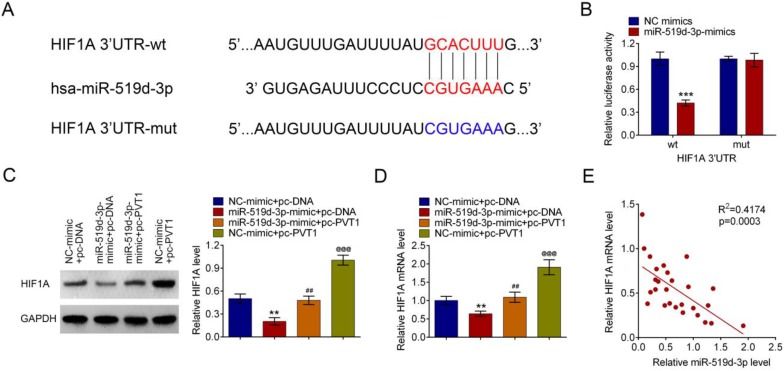
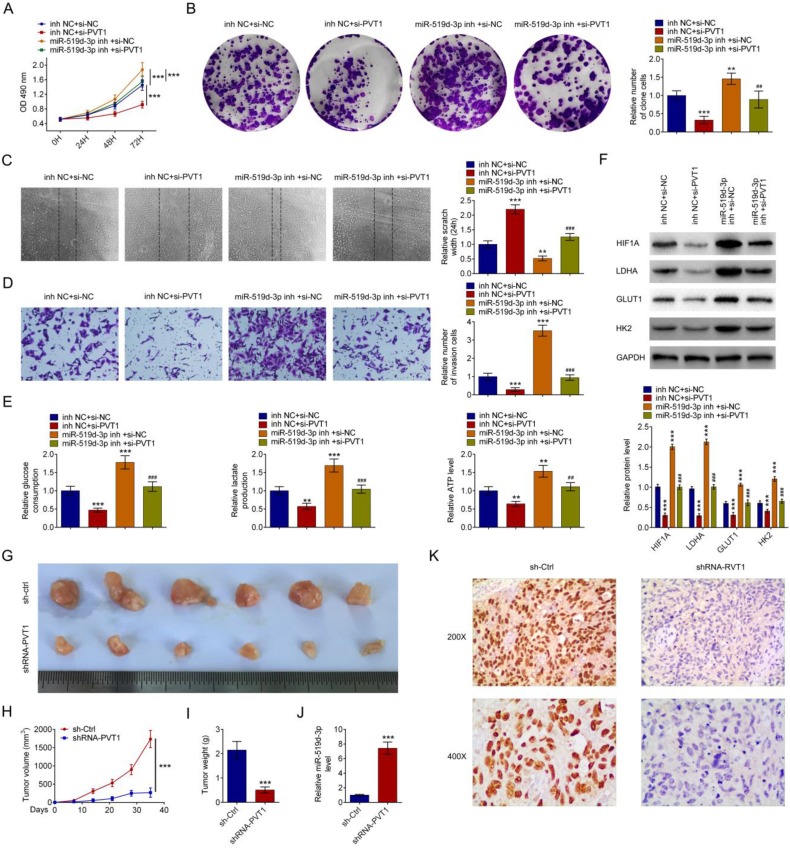
The long, noncoding RNA (lncRNA) PVT1, as an important epigenetic regulator, has a critical role in carcinogenesis. However, its role in pancreatic ductal adenocarcinoma (PDAC) has not been fully investigated. Here, the up-regulated expression of lncRNA PVT1 is found in our PDAC tumor samples. Knockdown of it suppressed PDCA cells growth and glycolysis. An inverse association between miR-519d-3p and PVT1 was found. RIP, RNA pulldown and luciferase assay showed that PVT1 directly targets miR-519d-3p by binding with microRNA binding site. Bioinformatics analysis and study indicated that HIF-1A is a target of miR-519d-3p. Collectively, our findings suggested that PVT1 could act as an oncogenic lncRNA, and promote tumor progression by regulating HIF-1A via competing with miR-519d-3p.
Keywords: HIF-1A; PDAC; PVT1; miR-519d-3p.
© The author(s).
Conflict of interest statement
Competing Interests: The authors have declared that no competing interest exists.
Figures
Similar articles
-
Long noncoding RNA PVT1 promotes laryngeal squamous cell carcinoma development by acting as a molecular sponge to regulate miR-519d-3p.J Cell Biochem. 2019 Mar;120(3):3911-3921. doi: 10.1002/jcb.27673. Epub 2018 Oct 10. J Cell Biochem. 2019. PMID: 30304557
-
Knockdown of long noncoding RNA PVT1 suppresses cell proliferation and invasion of colorectal cancer via upregulation of microRNA-214-3p.Am J Physiol Gastrointest Liver Physiol. 2019 Aug 1;317(2):G222-G232. doi: 10.1152/ajpgi.00357.2018. Epub 2019 May 24. Am J Physiol Gastrointest Liver Physiol. 2019. PMID: 31125260
-
Long Noncoding RNA PVT1 Silencing Prevents the Development of Uveal Melanoma by Impairing MicroRNA-17-3p-Dependent MDM2 Upregulation.Invest Ophthalmol Vis Sci. 2019 Nov 1;60(14):4904-4914. doi: 10.1167/iovs.19-27704. Invest Ophthalmol Vis Sci. 2019. PMID: 31770435
-
Knockdown of lncRNA PVT1 protects human trabecular meshwork cells against H2O2-induced injury via the regulation of the miR-29a-3p/VEGF/MMP-2 axis.Heliyon. 2023 Dec 12;10(1):e23607. doi: 10.1016/j.heliyon.2023.e23607. eCollection 2024 Jan 15. Heliyon. 2023. PMID: 38173510 Free PMC article.
-
Non-coding RNAs in Pancreatic Ductal Adenocarcinoma.Front Oncol. 2020 Mar 17;10:309. doi: 10.3389/fonc.2020.00309. eCollection 2020. Front Oncol. 2020. PMID: 32257946 Free PMC article. Review.
Cited by
-
Role of long non-coding RNAs in metabolic reprogramming of gastrointestinal cancer cells.Cancer Cell Int. 2024 Jan 6;24(1):15. doi: 10.1186/s12935-023-03194-0. Cancer Cell Int. 2024. PMID: 38184562 Free PMC article. Review.
-
Different polymorphisms in HIF-1α may exhibit different effects on cancer risk in Asians: evidence from nearly forty thousand participants.Aging (Albany NY). 2020 Nov 4;12(21):21329-21343. doi: 10.18632/aging.103871. Epub 2020 Nov 4. Aging (Albany NY). 2020. PMID: 33154192 Free PMC article. Review.
-
H19 promotes aerobic glycolysis, proliferation, and immune escape of gastric cancer cells through the microRNA-519d-3p/lactate dehydrogenase A axis.Cancer Sci. 2021 Jun;112(6):2245-2259. doi: 10.1111/cas.14896. Epub 2021 Apr 7. Cancer Sci. 2021. PMID: 33756038 Free PMC article.
-
A reciprocal feedback between N6-methyladenosine reader YTHDF3 and lncRNA DICER1-AS1 promotes glycolysis of pancreatic cancer through inhibiting maturation of miR-5586-5p.J Exp Clin Cancer Res. 2022 Feb 19;41(1):69. doi: 10.1186/s13046-022-02285-6. J Exp Clin Cancer Res. 2022. PMID: 35183226 Free PMC article.
-
Regulatory Roles of Noncoding RNAs in the Progression of Gastrointestinal Cancers and Health Disparities.Cells. 2022 Aug 7;11(15):2448. doi: 10.3390/cells11152448. Cells. 2022. PMID: 35954293 Free PMC article. Review.
References
-
- Siegel RL, Miller KD, Jemal A. Cancer Statistics, 2017. CA Cancer J Clin. 2017;67:7–30. - PubMed
-
- O. Warburg. On the origin of cancer cells. Science. 1956;123:309–314. - PubMed
-
- Jiang Y, Wu GH, He GD, Zhuang QL, Xi QL, Zhang B. et al. The Effect of Silencing HIF-1A Gene in BxPC-3 Cell Line on Glycolysis-Related Gene Expression, Cell Growth, Invasion, and Apoptosis. Nutr Cancer. 2015;67:1314–1323. - PubMed
LinkOut - more resources
Full Text Sources
Miscellaneous
