. 2020 Mar 20;5(45):eaaz2738.
doi: 10.1126/sciimmunol.aaz2738.

NK cells mediate clearance of CD8+ T cell-resistant tumors in response to STING agonists

Affiliations

NK cells mediate clearance of CD8+ T cell-resistant tumors in response to STING agonists

Christopher J Nicolai et al. Sci Immunol. .

Abstract

Several immunotherapy approaches that mobilize CD8+ T cell responses stimulate tumor rejection, and some, such as checkpoint blockade, have been approved for several cancer indications and show impressive increases in patient survival. However, tumors may evade CD8+ T cell recognition via loss of MHC molecules or because they contain few or no neoantigens. Therefore, approaches are needed to combat CD8+ T cell-resistant cancers. STING-activating cyclic dinucleotides (CDNs) are a new class of immune-stimulating agents that elicit impressive CD8+ T cell-mediated tumor rejection in preclinical tumor models and are now being tested in clinical trials. Here, we demonstrate powerful CDN-induced, natural killer (NK) cell-mediated tumor rejection in numerous tumor models, independent of CD8+ T cells. CDNs enhanced NK cell activation, cytotoxicity, and antitumor effects in part by inducing type I interferon (IFN). IFN acted in part directly on NK cells in vivo and in part indirectly via the induction of IL-15 and IL-15 receptors, which were important for CDN-induced NK activation and tumor control. After in vivo administration of CDNs, dendritic cells (DCs) up-regulated IL-15Rα in an IFN-dependent manner. Mice lacking the type I IFN receptor specifically on DCs had reduced NK cell activation and tumor control. Therapeutics that activate NK cells, such as CDNs, checkpoint inhibitors, NK cell engagers, and cytokines, may represent next-generation approaches to cancer immunotherapy.


Figures

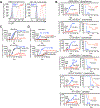
Fig. 1.
Fig. 1.. Rejection of MHC I-deficient tumors induced by intratumoral injections of CDN (2’3’ RR c-di-AMP).
(A) WT and B2m−/− tumor cells were stained with MHC class I (H-2Kb clone AF6–88.5) or isotype control antibodies. (B) Tumor cells were injected s.c. in C57BL/6J or BALB/c (CT26 and 4T1) mice and treated i.t. 5 days later with PBS or once with 50 μg of CDN, or three times with 25 μg CDN over 5 days, indicated by the arrows. Tumor volume and survival was analyzed with 2-way ANOVA and log-rank (Mantel-Cox) tests, respectively. n=5–11 for CDN-treated mice and 3–4 for PBS-treated mice. Data are representative of 2 independent experiments. (C) Tumors were established in C57BL/6J or Stinggt/gt mice, treated, and analyzed as in B. n=6 for CDN/WT groups and 3–4 for the other groups. Data are representative of 2 independent experiments. (D) Tumors were established, treated, and analyzed as in B. Mice were CD8-depleted or received control rat Ig (see Methods). n=5–8 for the CDN-treated groups and 3–4 for the PBS-treated group. Data are representative of 2 independent experiments. For the MC-38 data in Figures C and D, the PBS-treated and CDN Ctrl Ig-treated growth curves were from the same experiment and are shown in both panels.
Fig. 2.
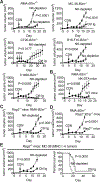
Fig. 2.. NK-dependence of tumor rejection induced by CDNs.
(A) C57BL/6J or BALB/c (CT26 and 4T1 tumors), (B) NK-DTA, (C-D) Rag2−/− or (D) Rag2−/−Il2rg−/− mice were injected s.c. with tumor cells of the types indicated and tumors were allowed to establish for 5 days. In some experiments (A, C, E) mice were NK-depleted (see Methods). Tumors were treated and analyzed as described in Fig. 1B. (E) B2m+/+ MC-38 tumors (MHC I+) were established in Rag2−/− mice that were NK-depleted or not, CDN-treated, and analyzed as in Fig. 1B. For Fig. A-D, data representative of 2–3 independent experiments. n=5–9. For Fig. E, data was combined from 3 independent experiments. n=18.
Fig. 3.
Fig. 3.. Activation, proliferation and cytotoxicity of NK cells induced by CDN treatments of tumors.
(A) RMA-B2m−/− tumors were established and treated as in Fig. 1B. 24 h later tumors, tumor-draining lymph nodes, and spleens were harvested and stained for flow cytometry. NK cells were gated as viable, CD45+, CD3-, CD19-, F4/80-, Ter119-, NK1.1+, NKp46+ cells. n=3. 2-tailed unpaired Student’s t-tests with the Holm-Sidak method for multiple comparisons was used. *P<0.05; **P<0.01; ***P < 0.001, ****P<0.0001. Data are representative of 2 independent experiments. (B) RMA-B2m−/− tumors were established, treated, harvested, stained and analyzed on the days indicated. n=3. Data are representative of 2 independent experiments and analyzed with 2-way ANOVA. Error bars are shown but may be too small to see. (C) RMA-B2m−/− tumors were established and treated as in Fig. 1B. 24 h after treatment, splenocytes were harvested and identical groups were pooled. Some groups were NK-depleted (see Methods). Cytotoxicity against RMA-B2m−/− target cells was performed in technical triplicate and error bars are shown but are typically too small to see. Data (representative of two independent experiments) were analyzed by 2-way ANOVA. (D) Experimental schematic is shown. C1498-B2m−/− tumors were established in both flanks of Rag2−/− mice 4 days apart at a dose of 4×10⁶ cells each. One day after the second, “contralateral”, tumor was established, NK cells were depleted as in Methods. NK cells were depleted again the next day and weekly thereafter. 6 days after the first, “Treated”, tumor was established, it was treated with PBS or 50 μg CDN. Tumor growth at both sites was monitored and analyzed as described in Fig. 1B. Data (combined from two independent experiments) were analyzed by 2-way ANOVA. ***P < 0.001, ****P<0.0001. n=6–8.
Fig. 4.
Fig. 4.. Critical role for type I interferons in the NK-dependent tumor rejection response induced by CDNs.
(A) RMA-B2m−/− tumors were established and treated as described in Fig. 1B. 24 hours later tumors were harvested, RNA extracted, and qRT-PCR performed to quantify Ifnb1 transcripts. n=4. ***P < 0.001, as analyzed by 2-tailed unpaired Student’s t-test. Data are representative of 2 independent experiments. (B) RMA-B2m−/− tumors were established and treated as described in Fig. 1B. 6 hours later serum was collected and IFN-β was quantified by ELISA. ***P<0.001, as analyzed by Mann Whitney test. Data are combined from two independent experiments. n=8. (C) RMA-B2m−/− tumors were established and treated as described in Fig.1B. 24 h later tumor-draining lymph node cells were harvested for flow cytometry analysis as in Fig. 3A. n=5. **P<0.01; ***P < 0.001; ****P<0.0001, as analyzed by one-way ANOVA with Tukey’s correction for multiple comparisons. Data are representative of 2 independent experiments. (D) Cytotoxicity of splenocytes from tumor-bearing, PBS or CDN-treated mice analyzed as in Fig. 3C. Data are representative of two independent experiments. Error bars are shown but are typically too small to see. (E) Tumors were established in C57BL/6J or Ifnar1−/− mice, treated, and analyzed as in Fig. 1B. n=5–6. Data are representative of two independent experiments. (F) RMA-B2m−/− tumors were established in Rag2−/− mice and treated and analyzed as in Fig. 1B. Some animals were depleted of NK cells and/or given IFNAR1 neutralizing antibody (see Methods). Data are representative of two independent experiments. (G) Bone marrow chimeras were established with the indicated donor → recipient combinations of C57BL/6J and Ifnar1−/− bone marrow (see Methods). Eight weeks later, RMA-B2m−/− tumors were established, treated, and analyzed as in Fig. 1B. n=8–12 per group.
Fig. 5.
Fig. 5.
Interferon acts directly on NK cells to mediate therapeutic effects of CDN treatments. (A-B) RMA-B2m−/− tumors were established in the indicated genotypes, treated, and analyzed as in Fig. 1B. NK depletions were performed as described in Methods. Data are representative of 2–3 independent experiments. n=4–8. Survival data is combined from 2–3 experiments (n=14–22 per group). (C) RMA-B2m−/− tumors were established in the indicated genotypes and treated as before. 24 h later tumor-draining lymph node cells were harvested for flow cytometry as in Fig. 3A. n=4–6. Data (representative of 2 independent experiments) were analyzed with one-way ANOVA with Tukey’s correction for multiple comparisons. *P < 0.05; **P<0.01; ***P < 0.001; ****P<0.0001. (D) Cytotoxicity of splenocytes from tumor-bearing PBS or CDN-treated mice of the indicated genotypes analyzed as in Fig. 3C. Data are representative of two independent experiments. ***P < 0.001. Error bars are shown but are typically too small to see.
Fig. 6.
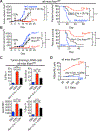
Fig. 6.. Interferon acts on dendritic cells to enhance NK cell activation and tumor rejection induced by CDN therapy.
(A) RMA-B2m−/− tumors were established in the indicated genotypes, treated, and analyzed as in Fig. 1B. NK depletion was performed as described in Methods. Tumor growth data are combined from 2 experiments (n=15–16 per group). Survival data are combined from 3 experiments (n=20–21 per group). **P<0.01; ***P < 0.001; ****P<0.0001. (B) RMA-B2m−/− tumors were established in the indicated genotypes and treated as before. 24 h later, flow cytometric analysis of tumor-draining LN NK cells was performed as in Fig. 3A. n=17–22. *P < 0.05; **P<0.01; ***P < 0.001; ****P<0.0001 as analyzed with one-way ANOVA tests with Tukey’s correction for multiple comparisons or Kruskal-Wallis with Dunn’s multiple comparisons test for nonparametric data. Data are combined from 4 independent experiments. (C) Cytotoxicity of splenocytes from tumor-bearing PBS or CDN-treated mice of the indicated genotypes were analyzed as in Fig. 3C. **P<0.01; ***P < 0.001. Error bars are shown but are typically too small to see. One experiment is shown in the left panel and the reduced killing from Cd11c-Cre, Ifnar1fl/fl splenocytes was confirmed in a total of 3 independent experiments where the areas under the cytotoxicity curves were compared using paired, 2-tailed Student’s t-tests (right panel).
Fig. 7.
Fig. 7.. IL-15/IL-15Rα expression is induced on DCs and other cells by interferons after CDN therapy and contributes significantly to optimal NK cell activation and tumor rejection.
(A) RMA-B2m−/− tumors were established, treated, RNA-extracted, and analyzed by qPCR for Il15 or 1l15ra transcripts as in Fig. 4A. Some mice received IFNAR1 neutralizing antibody (see Methods). n=4. Data (representative of 2 independent experiments) were analyzed with one-way ANOVA with Tukey’s correction for multiple comparisons. (B) RMA-B2m−/− tumors were established and treated as before. 24 h later tumor-draining lymph node cells were harvested for flow cytometry as in Methods. The mean fluorescence intensity (MFI) of IL-15RA (BAF551) is displayed. Viable CD3-, CD19-, Ter119- cells were further gated on DCs (NK1.1-, Ly6G-, CD11chigh, MHC-IIhigh), monocytes (NK1.1-, Ly6G-, CD11bhigh, Ly6Chigh), neutrophils (NK1.1-, CD11b+, Ly6G+), NK cells (NK1.1+), and macrophages (NK1.1-, Ly6G-, CD11b+, F4/80+). n=4. **P<0.01; ***P < 0.001; ****P<0.0001, as analyzed by one-way ANOVA with Tukey’s correction for multiple comparisons. Data are representative of 2 independent experiments. (C) RMA-B2m−/− tumors were established, treated, and tumor-draining LN NKs were analyzed by flow cytometry as in Fig. 3A. Some mice received IL-15/IL-15R neutralizing antibody (see Methods). n=5. **P<0.01; ***P < 0.001; ****P<0.0001. Data (representative of 2 independent experiments) were analyzed with one-way ANOVA with Tukey’s correction for multiple comparisons. (D) Cytotoxicity of splenocytes from tumor-bearing PBS or CDN-treated mice were analyzed as in Fig. 3C. Some mice received IL-15/IL-15R neutralizing antibody or control Ig (see Methods). **P<0.01. Error bars shown but typically too small to see. One experiment is shown in the left panel and the reduced killing from IL-15R neutralization was confirmed in a total of three independent experiments where the areas under the cytotoxicity curves were compare using paired, 2-tailed Student’s t-tests (right panel). (E) RMA-B2m−/− tumors were established, treated, and analyzed as in Fig. 1B. Mice received 5 μg IL-15/IL-15R antibody or control IgG (see Methods). n=5 per group. Data are representative of 2 independent experiments. (F) Model of CDN-induced NK cell activation. I.t. CDN treatment activates the STING pathway, resulting in production of type I IFN and other mediators including cytokines and chemokines, boosting NK cell effector functions and antitumor activities. Type I IFN elicits its effects on NK cells by direct action and indirectly via DCs, which upregulate IL-15/IL-15Rα complexes to enhance NK cell antitumor effects.

Similar articles

Cited by

References

    1. Sharma P, Allison JP, The future of immune checkpoint therapy. Science 348, 56–61 (2015). - PubMed
    1. Ribas A, Wolchok JD, Cancer immunotherapy using checkpoint blockade. Science 359, 1350–1355 (2018). - PMC - PubMed
    1. Hirano F, Kaneko K, Tamura H, Dong H, Wang S, Ichikawa M, Rietz C, Flies DB, Lau JS, Zhu G, Tamada K, Chen L, Blockade of B7-H1 and PD-1 by monoclonal antibodies potentiates cancer therapeutic immunity. Cancer Res 65, 1089–1096 (2005). - PubMed
    1. Leach DR, Krummel MF, Allison JP, Enhancement of antitumor immunity by CTLA-4 blockade. Science 271, 1734–1736 (1996). - PubMed
    1. McGranahan N, Rosenthal R, Hiley CT, Rowan AJ, Watkins TBK, Wilson GA, Birkbak NJ, Veeriah S, Van Loo P, Herrero J, Swanton C, Consortium TR, Allele-Specific HLA Loss and Immune Escape in Lung Cancer Evolution. Cell 171, 1259–1271 e1211 (2017). - PMC - PubMed

Publication types

MeSH terms