

FRA1 contributes to MEK-ERK pathway-dependent PD-L1 upregulation by KRAS mutation in premalignant human bronchial epithelial cells
- PMID: 32194893
- PMCID: PMC7061839
FRA1 contributes to MEK-ERK pathway-dependent PD-L1 upregulation by KRAS mutation in premalignant human bronchial epithelial cells
Abstract
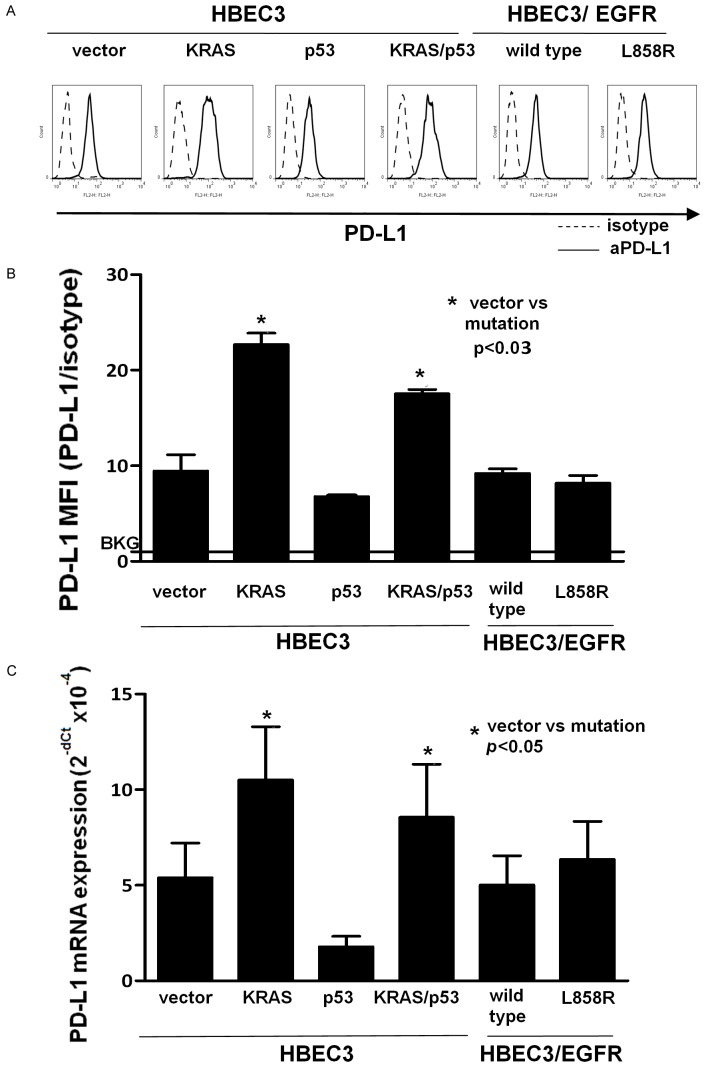
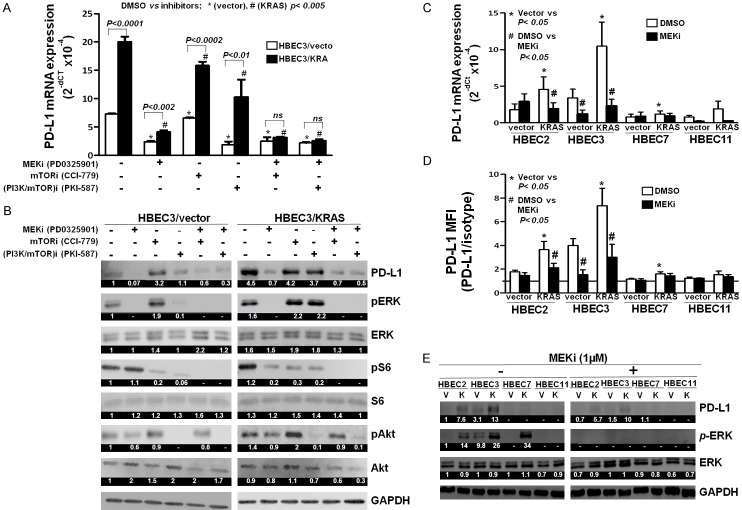
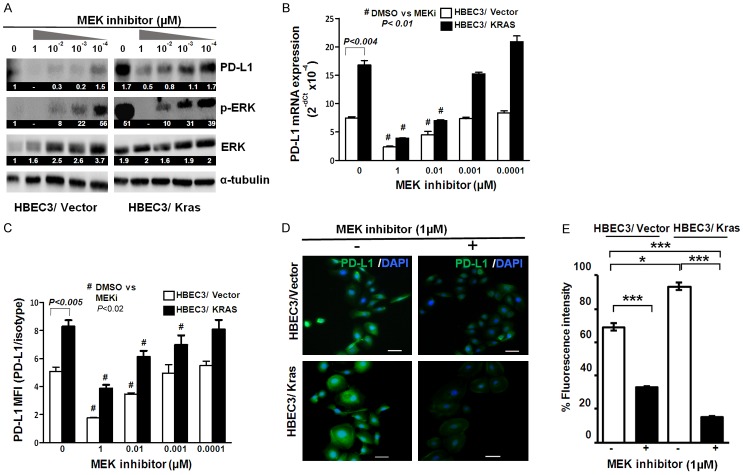
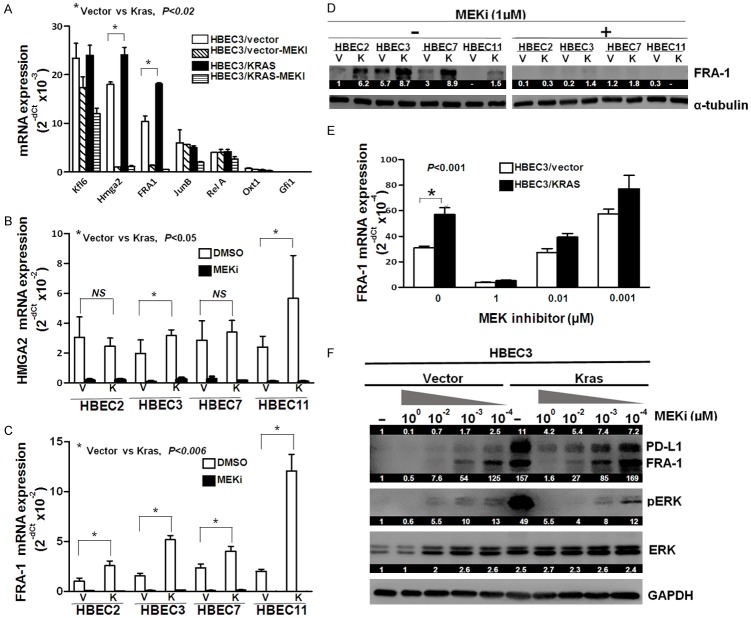
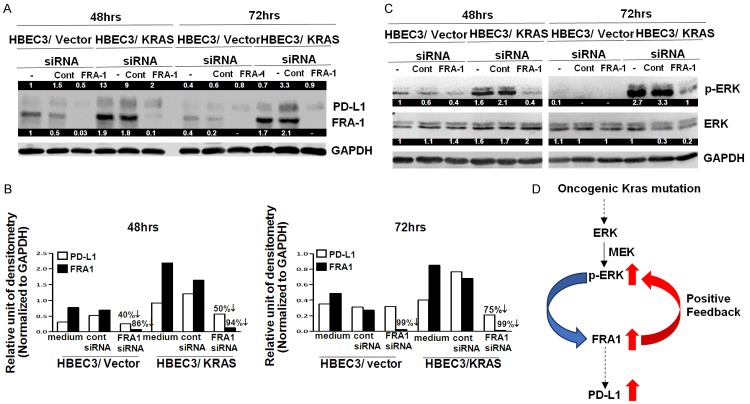
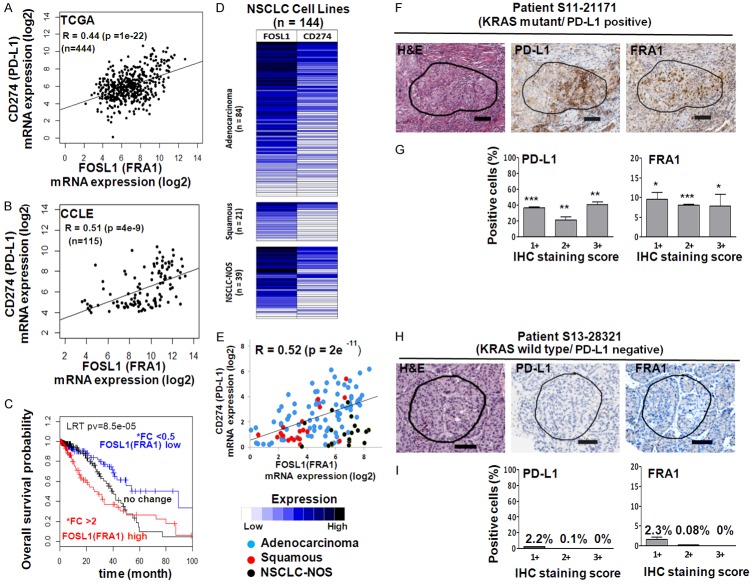
Oncogenic KRAS mutations are frequently found in non-small cell lung carcinoma (NSCLC) and cause constitutive activation of the MEK-ERK pathway. Many cancer types have been shown to overexpress PD-L1 to escape immune surveillance. FRA1 is a MEK/ERK-dependent oncogenic transcription factor and a member of the AP-1 transcriptional factor superfamily. This study assesses the hypothesis that KRAS mutation directly regulates PD-L1 expression through the MEK-ERK pathway mediated by FRA1. Premalignant human bronchial epithelial cell (HBEC) lines harboring the KRAS mutationV12, EGFR mutation, p53 knock-down, or both KRAS mutation and p53 knock-down were tested for levels of PD-L1, FRA1, and ERK activation (pERK). Our results showed that KRAS mutation alone, but not other genetic alterations, induced significantly higher expression of PD-L1 compared to its vector counterparts. The increased PD-L1 expression in the KRAS mutated cells was dramatically reduced by inhibition of ERK activation. Furthermore, the MEK-ERK pathway-dependent PD-L1 expression was markedly reduced by FRA1 silencing. Interestingly, FRA1 silencing led to inhibition of ERK activation, indicating that FRA1 plays a role in PD-L1 regulation via positive feedback of ERK activation. Correlation of PD-L1 and FRA1 mRNA expression was validated using human lung cancer specimens from The Cancer Genome Atlas (TCGA) and established NSCLC cell lines from Cancer Cell Line Encyclopedia (CCLE). FRA1 expression was significantly associated with PD-L1 expression, and high FRA1 expression was correlated with poor overall survival. Our findings suggest that oncogenic KRAS-driven PD-L1 expression is dependent on MEK-ERK and FRA1 in high risk, premalignant HBEC.
Keywords: FRA1; KRAS; MEK-ERK pathway; PD-L1; premalignant human bronchial epithelial cells.
AJTR Copyright © 2020.
Conflict of interest statement
Dr. Jay M. Lee serves as an advisor to AstraZeneca, Genentech, Novartis, and Regeneron for clinical trials involving checkpoint inhibitors in early stage lung cancer. Dr. Jay M. Lee also receives research support (drug only) from Merck for an immunotherapy clinical trial.
Figures
Similar articles
-
KRAS acting through ERK signaling stabilizes PD-L1 via inhibiting autophagy pathway in intrahepatic cholangiocarcinoma.Cancer Cell Int. 2022 Mar 19;22(1):128. doi: 10.1186/s12935-022-02550-w. Cancer Cell Int. 2022. PMID: 35305624 Free PMC article.
-
KRAS mutation-induced upregulation of PD-L1 mediates immune escape in human lung adenocarcinoma.Cancer Immunol Immunother. 2017 Sep;66(9):1175-1187. doi: 10.1007/s00262-017-2005-z. Epub 2017 Apr 27. Cancer Immunol Immunother. 2017. PMID: 28451792 Free PMC article.
-
AP1/Fra1 confers resistance to MAPK cascade inhibition in pancreatic cancer.Cell Mol Life Sci. 2022 Dec 19;80(1):12. doi: 10.1007/s00018-022-04638-y. Cell Mol Life Sci. 2022. PMID: 36534167 Free PMC article.
-
Epiregulin as a therapeutic target in non-small-cell lung cancer.Lung Cancer (Auckl). 2015 Oct 12;6:91-98. doi: 10.2147/LCTT.S60427. eCollection 2015. Lung Cancer (Auckl). 2015. PMID: 28210154 Free PMC article. Review.
-
Epidermal Growth Factor Receptor (EGFR) Pathway, Yes-Associated Protein (YAP) and the Regulation of Programmed Death-Ligand 1 (PD-L1) in Non-Small Cell Lung Cancer (NSCLC).Int J Mol Sci. 2019 Aug 5;20(15):3821. doi: 10.3390/ijms20153821. Int J Mol Sci. 2019. PMID: 31387256 Free PMC article. Review.
Cited by
-
SMARCAL1 is a dual regulator of innate immune signaling and PD-L1 expression that promotes tumor immune evasion.Cell. 2024 Feb 15;187(4):861-881.e32. doi: 10.1016/j.cell.2024.01.008. Epub 2024 Jan 31. Cell. 2024. PMID: 38301646
-
Melatonin inhibits EMT and PD-L1 expression through the ERK1/2/FOSL1 pathway and regulates anti-tumor immunity in HNSCC.Cancer Sci. 2022 Jul;113(7):2232-2245. doi: 10.1111/cas.15338. Epub 2022 May 29. Cancer Sci. 2022. PMID: 35298069 Free PMC article.
-
The identification of genes associated T-cell exhaustion and construction of prognostic signature to predict immunotherapy response in lung adenocarcinoma.Sci Rep. 2023 Aug 17;13(1):13415. doi: 10.1038/s41598-023-40662-z. Sci Rep. 2023. PMID: 37592010 Free PMC article.
-
An Improved Murine Premalignant Squamous Cell Model: Tobacco Smoke Exposure Augments NTCU-Induced Murine Airway Dysplasia.Cancer Prev Res (Phila). 2021 Mar;14(3):307-312. doi: 10.1158/1940-6207.CAPR-20-0332. Epub 2020 Oct 28. Cancer Prev Res (Phila). 2021. PMID: 33115782 Free PMC article.
-
The Fra-1/AP-1 Oncoprotein: From the "Undruggable" Transcription Factor to Therapeutic Targeting.Cancers (Basel). 2022 Mar 14;14(6):1480. doi: 10.3390/cancers14061480. Cancers (Basel). 2022. PMID: 35326630 Free PMC article. Review.
References
-
- Brahmer J, Reckamp KL, Baas P, Crino L, Eberhardt WE, Poddubskaya E, Antonia S, Pluzanski A, Vokes EE, Holgado E, Waterhouse D, Ready N, Gainor J, Aren Frontera O, Havel L, Steins M, Garassino MC, Aerts JG, Domine M, Paz-Ares L, Reck M, Baudelet C, Harbison CT, Lestini B, Spigel DR. Nivolumab versus docetaxel in advanced squamous-cell non-small-cell lung cancer. N Engl J Med. 2015;373:123–35. - PMC - PubMed
-
- Rizvi NA, Hellmann MD, Snyder A, Kvistborg P, Makarov V, Havel JJ, Lee W, Yuan J, Wong P, Ho TS, Miller ML, Rekhtman N, Moreira AL, Ibrahim F, Bruggeman C, Gasmi B, Zappasodi R, Maeda Y, Sander C, Garon EB, Merghoub T, Wolchok JD, Schumacher TN, Chan TA. Cancer immunology. Mutational landscape determines sensitivity to PD-1 blockade in non-small cell lung cancer. Science. 2015;348:124–8. - PMC - PubMed
-
- Bodemann BO, White MA. Ral GTPases and cancer: linchpin support of the tumorigenic platform. Nat Rev Cancer. 2008;8:133–40. - PubMed
Grants and funding
LinkOut - more resources
Full Text Sources
Research Materials
Miscellaneous