. 2020 May:32:101500.
doi: 10.1016/j.redox.2020.101500. Epub 2020 Mar 11.

Breaking the vicious loop between inflammation, oxidative stress and coagulation, a novel anti-thrombus insight of nattokinase by inhibiting LPS-induced inflammation and oxidative stress

Affiliations

Breaking the vicious loop between inflammation, oxidative stress and coagulation, a novel anti-thrombus insight of nattokinase by inhibiting LPS-induced inflammation and oxidative stress

Hao Wu et al. Redox Biol. 2020 May.

Abstract

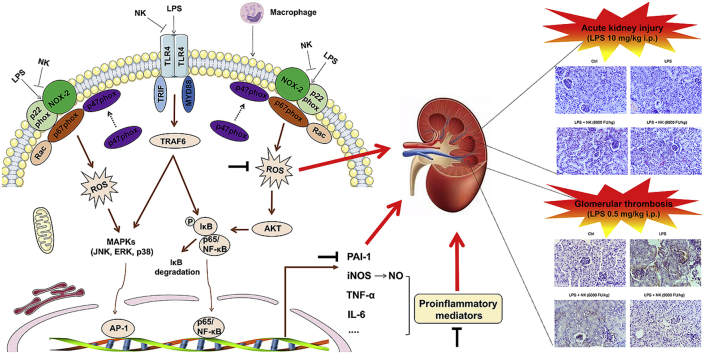
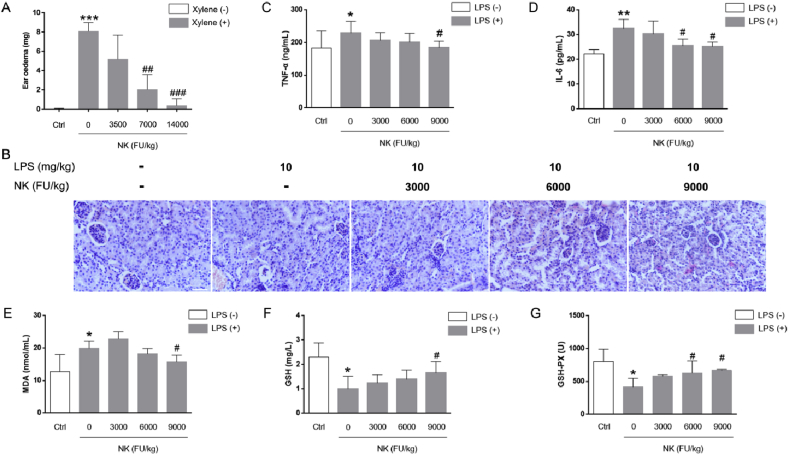
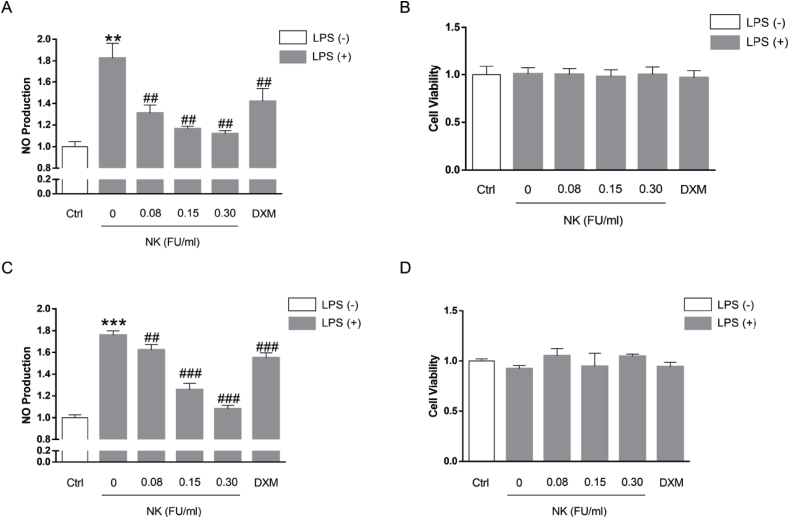
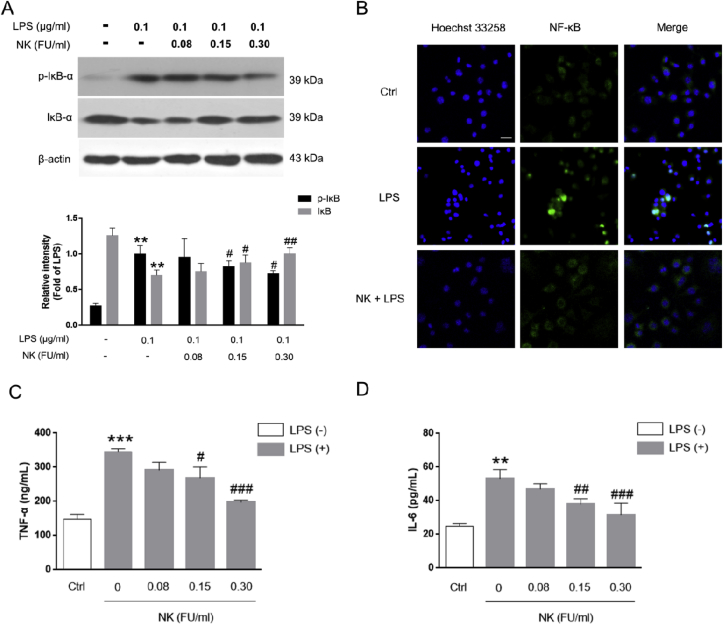
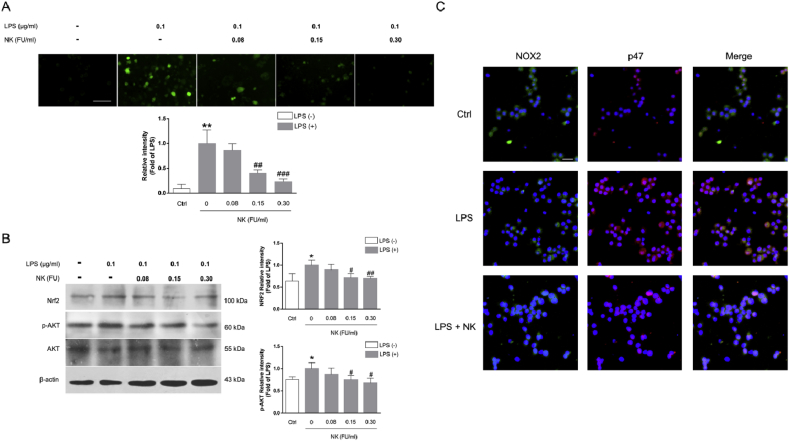
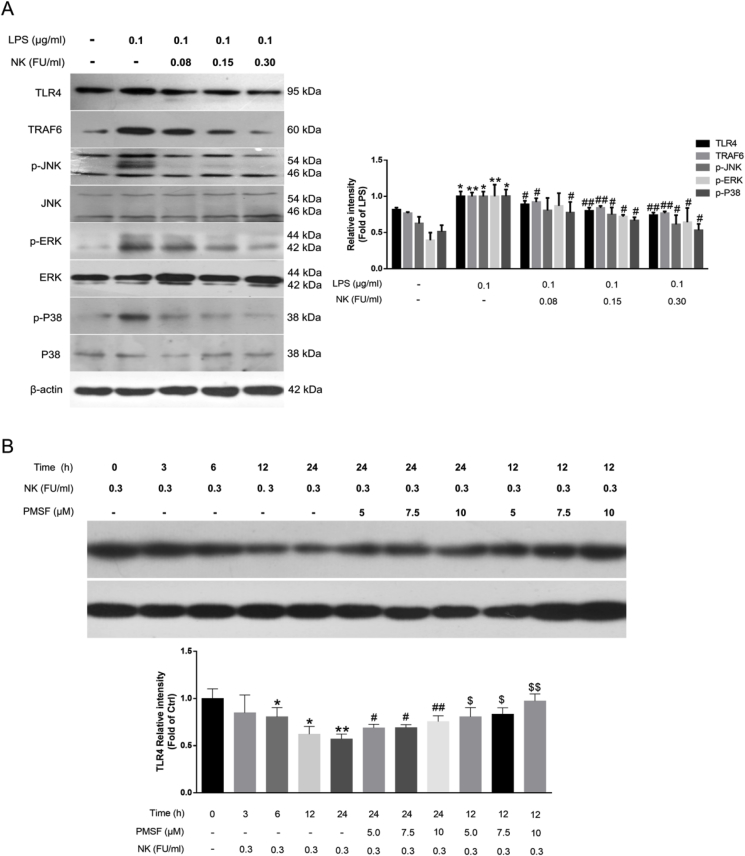
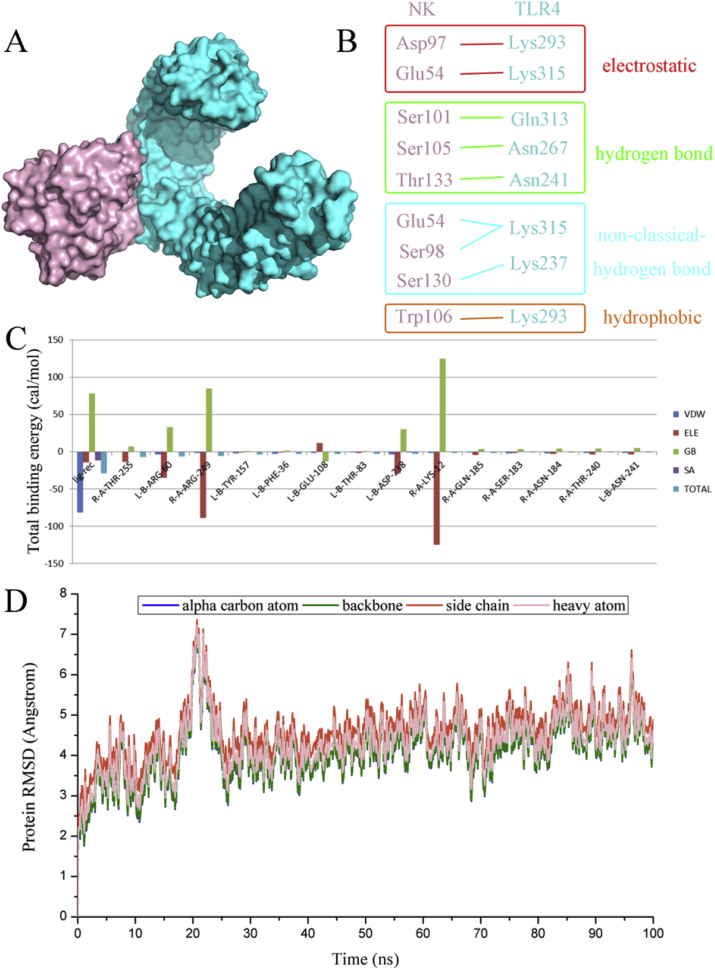
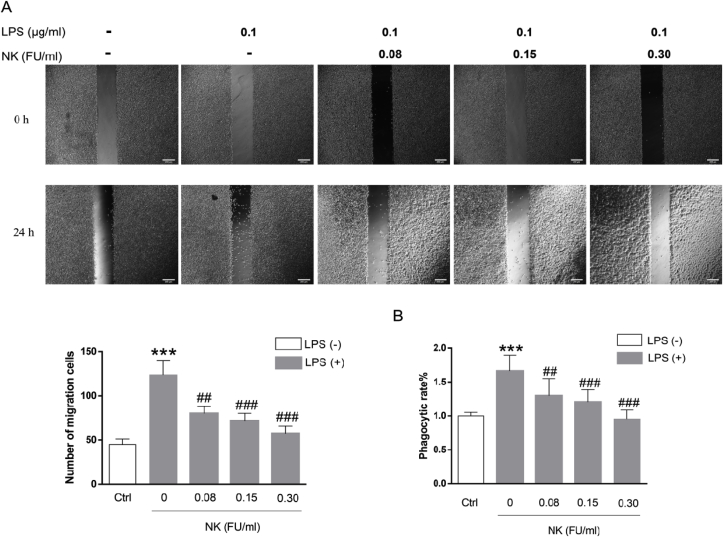
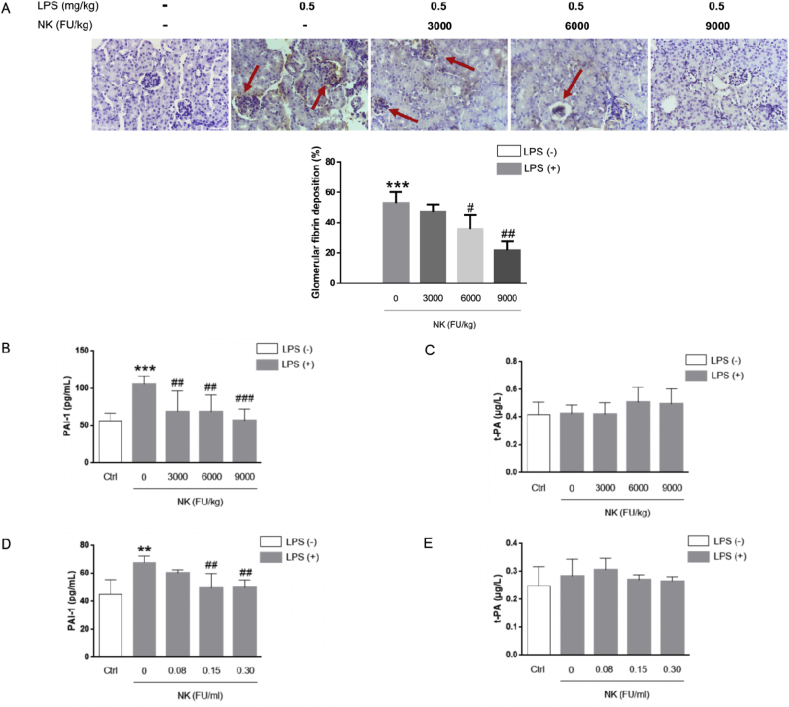
Thrombosis is a principle cause of cardiovascular disease, the leading cause of morbidity and mortality worldwide; however, the conventional anti-thrombotic approach often leads to bleeding complications despite extensive clinical management and monitoring. In view of the intense crosstalk between inflammation and coagulation, plus the contributing role of ROS to both inflammation and coagulation, it is highly desirable to develop safer anti-thrombotic agent with preserved anti-inflammatory and anti-oxidative stress activities. Nattokinase (NK) possesses many beneficial effects on cardiovascular system due to its strong thrombolytic and anticoagulant activities. Herein, we demonstrated that NK not only effectively prevented xylene-induced ear oedema in mice, but also remarkably protected against LPS-induced acute kidney injury in mice through restraining inflammation and oxidative stress, a central player in the initiation and progression of inflammation. Fascinatingly, in line with our in vivo data, NK elicited prominent anti-inflammatory activity in RAW264.7 macrophages via suppressing the LPS-induced TLR4 and NOX2 activation, thereby repressing the corresponding ROS production, MAPKs activation, and NF-κB translocation from the cytoplasm to the nucleus, where it mediates the expression of pro-inflammatory mediators, such as TNF-α, IL-6, NO, and PAI-1 in activated macrophage cells. In particular, consistent with the macrophage studies, NK markedly inhibited serum PAI-1 levels induced by LPS, thereby blocking the deposition of fibrin in the glomeruli of endotoxin-treated animals. In summary, we extended the anti-thrombus mechanism of NK by demonstrating the anti-inflammatory and anti-oxidative stress effects of NK in ameliorating LPS-activated macrophage signaling and protecting against LPS-stimulated AKI as well as glomeruler thrombus in mice, opening a comprehensive anti-thrombus strategy by breaking the vicious cycle between inflammation, oxidative stress and thrombosis.

Keywords: Inflammation; NOX2; Nattokinase; Oxidative stress; TRL4; Thrombus.


Conflict of interest statement

Declaration of competing interest There is no conflict of interests.

Figures

Image 1
Graphical abstract
Fig. 1
Fig. 1
NK decreased xylene-induced ear oedema and protected against LPS-induced AKI in mice. (A) Effects of NK on xylene-induced ear oedema in mice. Ear oedema was caused by xylene. Mice were predosed with NK (3500, 7000, and 14000 FU/kg, i.g.) for 1 week before stimulated with xylene (30 μl) on the right ear for 30 min. The ear weight was measured as described in the method section. Values were expressed as means ± SD. ***P < 0.001 vs. control; ##P < 0.01, ###P < 0.001, vs. xylene group (n = 6). (B) Effect of NK on LPS-induced AKI in mice. Mice were predosed with vehicle or NK (3000, 6000, and 9000 FU/kg, i.p.) for 1 h before LPS (10 mg/kg, i.p.) stimulation for 12 h. Kidney tissues were sectioned and stained with H&E for histopathological examination. Alternatively, blood samples were collected, and TNF-α (C) and IL-6 (D) in serum was determined using ELISA kits. Values were expressed as means ± SD. *P < 0.05, **P < 0.01 vs. control group; #P < 0.05 vs. LPS group. (E) Effect of NK on the MDA, GSH, and GSH-px levels in LPS-induced AKI in mice. MDA content (E), GSH levels (F), and GSH-px content (G) in serum were determined using the individual assay kits. Values were expressed as means ± SD. *P < 0.05, vs. control group; #P < 0.05 vs. LPS group (n = 10).
Fig. 2
Fig. 2
NK inhibited LPS-induced NO release in both RAW264.7 and rat primary peritoneal macrophage cells. (A) Effect of NK on LPS-induced NO production in RAW264.7 cells. Cells were incubated with indicated concentrations of NK or dexamethasone (2 μM) for 1 h before LPS (0.1 μg/ml) stimulation for 24 h. Then, the medium was collected to determine nitrite levels using the Griess assay. (B) Effect of NK on the cell viability of RAW264.7 cells. Cell viability was determined with MTT assay. (C) Effect of NK on LPS-induced NO production in rat primary peritoneal macrophage. Cells were incubated with indicated concentrations of NK or dexamethasone (2 μM) for 1 h before LPS (0.1 μg/ml) stimulation for 24 h. Then, the medium was collected to determine nitrite levels using the Griess assay. (D) Effect of NK on the cell viability of rat primary peritoneal macrophages. Cell viability was determined with MTT assay. Data represent mean ± SD from three independent experiments. **p < 0.01, ***p < 0.001, vs. control; ##p < 0.01, ###p < 0.001, vs. LPS-stimulated cells.
Fig. 3
Fig. 3
NK inhibited LPS-induced NF-κB activation in RAW264.7 cells. (A) Effect of NK on LPS-induced IκBα activation in RAW264.7 cells. Cells were pretreated with NK (0.08, 0.15, and 0.30 FU/mL) for 1 h before being exposed to LPS (0.1 μg/ml) for 6 h. Equal amounts of total cell lysates were loaded and subjected to immunoblot analysis. β-actin was used as the control for equal protein loading and protein integrity. **P < 0.01, vs. Control; #P < 0.05, ##P < 0.01, vs. LPS-stimulated cells. (B) Effect of NK on LPS-induced P65 nuclear-translation in RAW264.7 cells. Cells were pretreated with NK (0.30 FU/mL) for 1 h and then exposed to LPS (0.1 μg/mL) for 6 h. Immunofluorescence analysis was performed. P65 protein was marked with green fluorescent, and the nucleus were dyed blue with Hochest. Scale bar: 40 μm. (C) Effect of NK on LPS-induced TNF-α release in RAW264.7 cells. Cells were pretreated with NK (0.08, 0.15, 0.30 FU/mL) for 1 h before LPS (0.1 μg/mL) stimulation for 24 h. Cell supernatant was collected to detect TNF-α level by ELISA. (D) Effect of NK on LPS-induced IL-6 release in RAW264.7 cells. Cells were pretreated with NK (0.08, 0.15, 0.30 FU/mL) for 1 h before LPS (0.1 μg/mL) stimulation for 24 h. Cell supernatant was collected to detect IL-6 level by ELISA. **p < 0.01, ***p < 0.001, vs. control; #p < 0.05, ##p < 0.01, ###p < 0.001, vs. LPS-stimulated cells. (For interpretation of the references to colour in this figure legend, the reader is referred to the Web version of this article.)
Fig. 4
Fig. 4
NK suppressed the LPS-induced ROS generation and NOX2 activation in RAW264.7 cells. (A) Effect of NK on LPS-induced ROS generation in RAW 264.7 cells. Cells were pretreated with NK (0.30 FU/ml) for 1 h and then exposed to LPS (0.1 μg/mL) for 24 h. Intracellular ROS appeared green under a confocal microscopy (Scale bar is 40 μm), and the green fluorescent intensity was quantified by Image Pro Plus. Data represent the mean ± SD from three independent experiments. The mean fluorescence intensity were standardized to LPS treatment cells. **P < 0.01, vs. control; ##P < 0.01, ###P < 0.001, vs. LPS-stimulated cells. (B) Effect of NK on LPS-induced Nrf2 and AKT activation in RAW264.7 cells. Cells were pretreated with NK (0.08, 0.15, 0.30 FU/mL) for 1 h and then were stimulated with LPS (0.1 μg/mL) for 6 h. Equal amounts of total cell lysates were loaded and subjected to immunoblot analysis. β-actin was used as the control for equal protein loading and protein integrity. Data represent the mean ± SD from three independent experiments. *P < 0.01, vs. control; #P < 0.05, ##P < 0.05, vs. LPS-stimulated cells. (C) Effect of NK on LPS-induced P47 translocation via immunofluorescence assay. Cells were pretreated with NK (0.30 FU/ml) for 1 h before LPS (0.1 μg/mL) stimulation for 2 h. Double immunostainings were performed with anti-NOX2 (in green) and anti-p47phox (in red); nuclei were stained with Hochest (blue). Scale bars: 40 μm. (For interpretation of the references to colour in this figure legend, the reader is referred to the Web version of this article.)
Fig. 5
Fig. 5
NK diminished LPS-induced TLR4 activation likely due to promoting TRL4 proteolysis in RAW264.7 cells. (A) Effect of NK on LPS-induced TLR4 signaling pathways. Cells were pretreated with indicated concentrations of NK for 1 h and then exposed to LPS (0.1 μg/mL) for 12 h. Equal amounts of total cell lysates were loaded and subjected to immunoblot analysis. Data represent the mean ± SD from three independent experiments. (B) NK induced TRL4 degradation via its serine protease activity in RAW264.7 cells. Cells were treated with NK (0.3 FU/mL) for indicated time points with or without PMSF pretreatment for 30 min. Equal amounts of total cell lysates were loaded and subjected to immunoblot analysis. Data represent mean ± SD from three independent experiments. *P < 0.05, **P < 0.01 compared to control group; #P < 0.05, ##P < 0.05 compared to NK 12h group; $P < 0.05, $$P < 0.05 compared to NK 24h group.
Fig. 6
Fig. 6
Analysis of the TLR4-NK complex selected from protein-protein docking screening. (A) The binding mode of the protein complex. TLR4 was represented in blue and NK shown in pink. (B) The interaction types of residue pairs between TLR4 and NK were shown in details. (C) The total binding energy of the protein complex as well as the contacting residue-pairs with the total energy better than −1.0 kcal/mol calculated by MM/GBSA methods. (D) RMSD values of alpha carbon atoms, backbone atoms, side chain atoms and heavy atoms of the protein complex fluctuated along the 100 ns MD simulation. (For interpretation of the references to colour in this figure legend, the reader is referred to the Web version of this article.)
Fig. 7
Fig. 7
NK suppressed LPS-induced macrophage cell migration and phagocytosis. (A) NK inhibited LPS-induced cell migration in RAW264.7 cells. Cell migration assay was performed in RAW264.7 cells treated with or without LPS (0.1 μg/mL) in the presence or absence of various concentrations of NK for 24 h. Micrographs were obtained immediately at the beginning (time 0 h) and at 24 h. The dotted lines represent the edges in the path (“wound”) enclosed in time 0 h. Cells found in the path after 24 h were considered as migrating cells. Scale bar represents 200 μm. Cell counts were analyzed using ImageJ software. (B) NK inhibited LPS-induced phagocytosis in RAW264.7 cells. Cells were pretreated with NK (0.3 FU/mL) for 1 h before challenging with LPS (0.1 μg/mL) for 24 h. Then cells were incubated with neutral red for 4 h followed by extracting the phagocytic stain and measuring by microplate reader at 540 nm. Data represent the mean ± SD from three independent experiments. *p < 0.05, ***p < 0.001 vs. control; ##P < 0.01, ###P < 0.001 compared to LPS group.
Fig. 8
Fig. 8
NK remarkably inhibited LPS-induced thrombosis in mice. (A) NK inhibited LPS-induced glomerular thrombosis in mice. Mice were predosed with NK (3000, 6000, and 9000 FU/kg, i.p.) for 1 h before LPS (0.5 mg/kg, i.p.) stimulation for 12 h (n = 10). Kidney tissues were collected, and immunohistochemical staining was performed with anti-fibrin(ogen) antibody. Fibrin depositions were indicated as brown spots as indicated in red arrow, and were quantified via ImageJ. ***p < 0.001, vs. unstimulated group; #p < 0.05, ###p < 0.001, vs. LPS group. (B) NK significantly suppressed PAI-1 release in mice. Mice were predosed with NK (3000, 6000, and 9000 FU/kg, i.p.) for 1 h LPS (0.5 mg/kg, i.p.) stimulation for 12 h. Blood was collected from mice. Serum PAI-1 (B), and t-PA (C) were determined by ELISA. ***p < 0.001, vs. control; ##p < 0.01, ###p < 0.001, vs. LPS group. (D) NK significantly suppressed LPS-induced PAI-1 production in RAW264.7 cells. Cells were incubated with indicated concentrations of NK for 1 h, and then stimulated with LPS (0.1 μg/mL) for 24 h. PAI-1 (D) and t-PA (E) contents were determined by ELISA. ***p < 0.001, vs. Control; ##p < 0.01, vs. LPS-stimulated cells. (For interpretation of the references to colour in this figure legend, the reader is referred to the Web version of this article.)
Fig. 9
Fig. 9
The schematic of the novel anti-thrombus insight of NK by breaking the vicious loop between inflammation, oxidative stress, and coagulation. LPS activated both TRL4 and NOX2 abundantly expressed on the inflammatory macrophage cells, leading to the corresponding ROS production, NF-κB activation as well as its downstream pro-inflammatory mediators production, such as NO, TNF-α, IL-6, and PAI-1. Interestingly, NK remarkably suppressed LPS-induced ROS generation and NF-κB activation via inhibiting LPS-induced NOX2 and TRL4 activation, demonstrating its anti-inflammatory and anti-oxidative stress efficacy. Consistently, NK effectively protected against LPS-induced AKI in mice through restraining inflammation and oxidative stress. Of note, in support of the intense crosstalk between the inflammation, oxidative stress, and coagulation, NK effectively protected against LPS-induced glomerular thrombus in mice. In particular, PAI-1 levels, the main physiological inhibitor of fibrinolysis, were significantly elevated in LPS-treated animals, which were significantly decreased by NK treatment. Similar results were found in LPS-activated macrophages, which may underlie, at least in part, the mechanism by which NK protected against LPS-mediated thrombosis formation in mice.

Similar articles

Cited by

References

    1. Ouriel K., Welch E.L., Shortell C.K., Geary K., Fiore W.M., Cimino C. Comparison of streptokinase, urokinase, and recombinant tissue plasminogen activator in an in vitro model of venous thrombolysis. J. Vasc. Surg. 1995;22(5):593–597. - PubMed
    1. Raffort J., Lareyre F., Clement M., Hassen-Khodja R., Chinetti G., MallatZ Monocytes and macrophages in abdominal aortic aneurysm. Nat. Rev. Cardiol. 2017;14:457–471. - PubMed
    1. Levi M., van der Poll T., Büller H.R. Bidirectional relation between inflammation and coagulation. Circulation. 2004;109(22):2698–2704. - PubMed
    1. Jackson S.P., Darbousset R., Schoenwaelder S.M. Thromboinflammation: challenges of therapeutically targeting coagulation and other host defense mechanisms. Blood. 2019;133:906–918. - PubMed
    1. Quenot J.P., Dargent A., Large A., Roudaut J.B., Andreu P., Barbar S. Treatment of sepsis-induced acute kidney injury in the ICU: the therapeutic targets do not seem to be established yet. Ann. Transl. Med. 2019;7:S181. - PMC - PubMed

Publication types