Clinical Trial
. 2020 Jun 1;130(6):3305-3314.
doi: 10.1172/JCI136756.

Influence of adiposity, insulin resistance, and intrahepatic triglyceride content on insulin kinetics

Affiliations
Clinical Trial

Influence of adiposity, insulin resistance, and intrahepatic triglyceride content on insulin kinetics

Gordon I Smith et al. J Clin Invest. .

Abstract

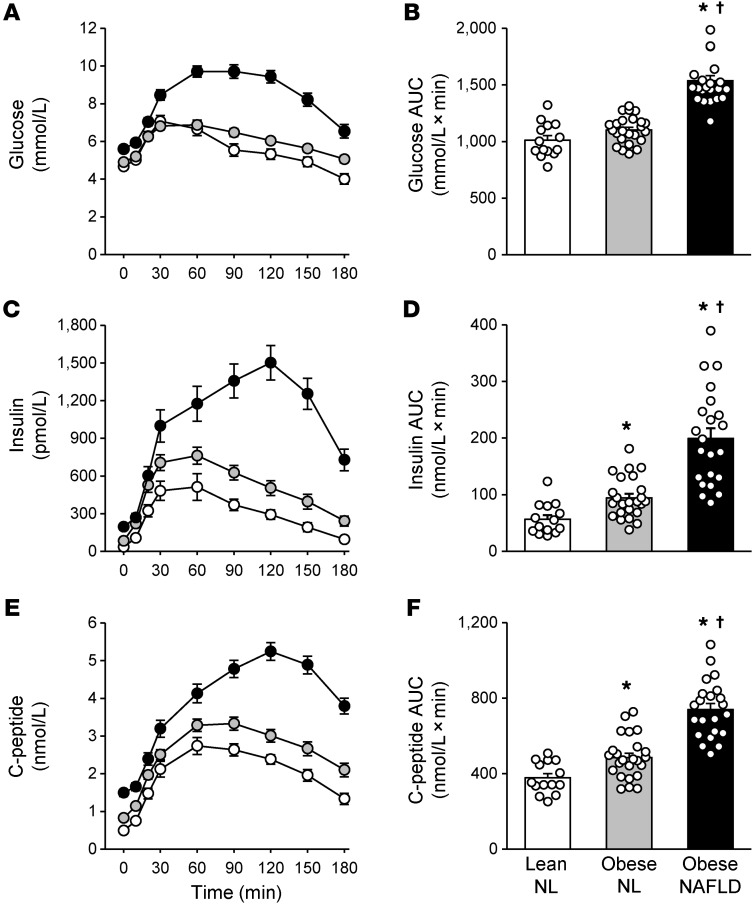
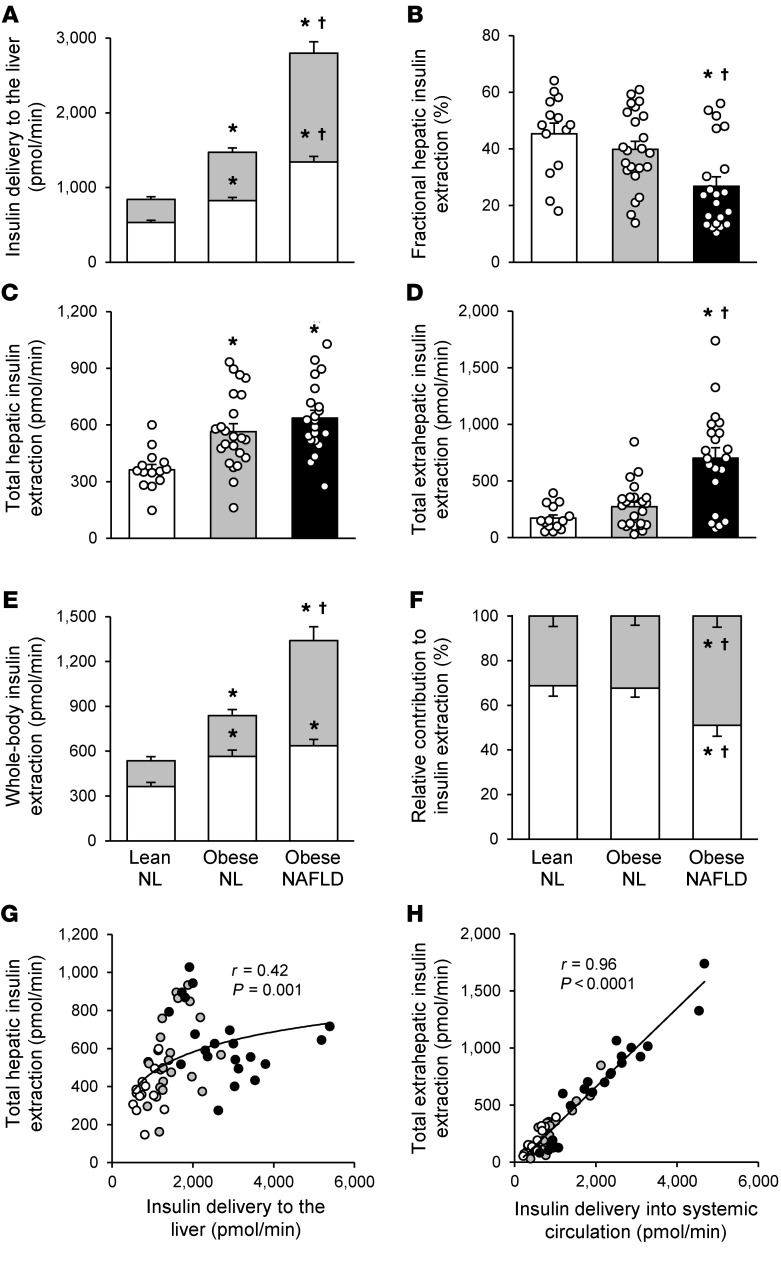
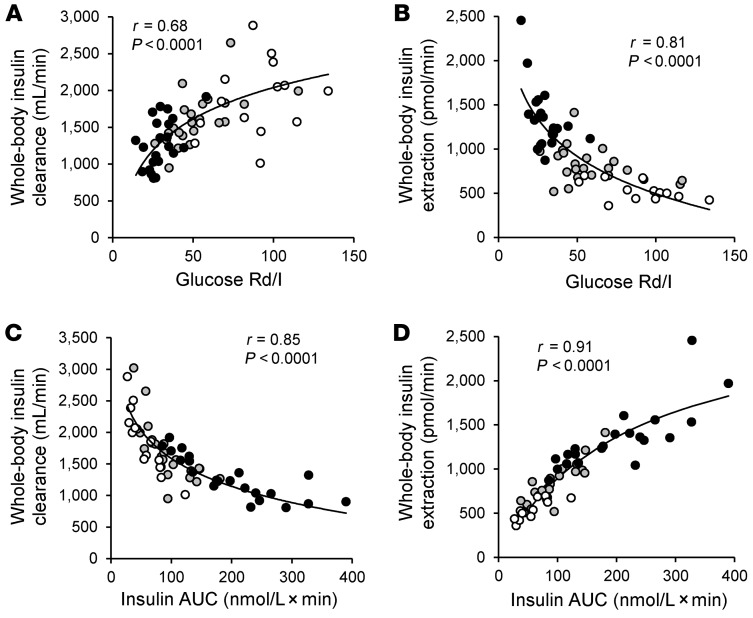
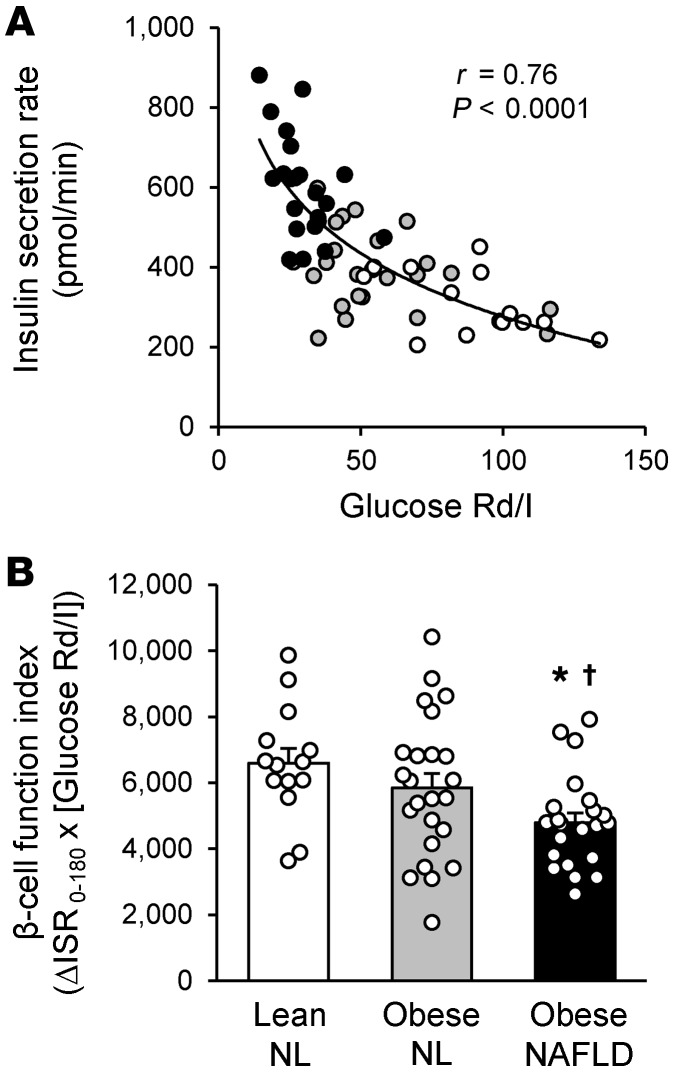
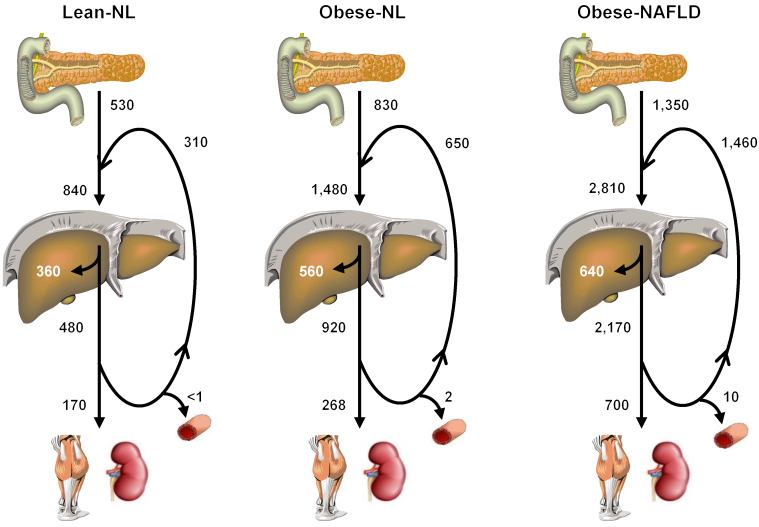
BACKGROUNDInsulin is a key regulator of metabolic function. The effects of excess adiposity, insulin resistance, and hepatic steatosis on the complex integration of insulin secretion and hepatic and extrahepatic tissue extraction are not clear.METHODSA hyperinsulinemic-euglycemic clamp and a 3-hour oral glucose tolerance test were performed to evaluate insulin sensitivity and insulin kinetics after glucose ingestion in 3 groups: (a) lean subjects with normal intrahepatic triglyceride (IHTG) and glucose tolerance (lean-NL; n = 14), (b) obese subjects with normal IHTG and glucose tolerance (obese-NL; n = 24), and (c) obese subjects with nonalcoholic fatty liver disease (NAFLD) and prediabetes (obese-NAFLD; n = 22).RESULTSInsulin sensitivity progressively decreased and insulin secretion progressively increased from the lean-NL to the obese-NL to the obese-NAFLD groups. Fractional hepatic insulin extraction progressively decreased from the lean-NL to the obese-NL to the obese-NAFLD groups, whereas total hepatic insulin extraction (molar amount removed) was greater in the obese-NL and obese-NAFLD subjects than in the lean-NL subjects. Insulin appearance in the systemic circulation and extrahepatic insulin extraction progressively increased from the lean-NL to the obese-NL to the obese-NAFLD groups. Total hepatic insulin extraction plateaued at high rates of insulin delivery, whereas the relationship between systemic insulin appearance and total extrahepatic extraction was linear.CONCLUSIONHyperinsulinemia after glucose ingestion in obese-NL and obese-NAFLD is due to an increase in insulin secretion, without a decrease in total hepatic or extrahepatic insulin extraction. However, the liver's maximum capacity to remove insulin is limited because of a saturable extraction process. The increase in insulin delivery to the liver and extrahepatic tissues in obese-NAFLD is unable to compensate for the increase in insulin resistance, resulting in impaired glucose homeostasis.TRIAL REGISTRATIONClinicalTrials.gov NCT02706262.FUNDINGNIH grants DK56341 (Nutrition Obesity Research Center), DK052574 (Digestive Disease Research Center), RR024992 (Clinical and Translational Science Award), and T32 DK007120 (a T32 Ruth L. Kirschstein National Research Service Award); the American Diabetes Foundation (1-18-ICTS-119); Janssen Research & Development; and the Pershing Square Foundation.

Keywords: Endocrinology; Metabolism; Obesity.


Conflict of interest statement

Conflict of interest: SK is a shareholder of Aspire Bariatrics, receives research funding from Janssen Pharmaceuticals Inc., and serves on the scientific advisory boards for Danone and Merck Sharp & Dohme Corp. DCP is an employee of Janssen Research & Development.

Figures

Figure 1
Figure 1. Plasma glucose, insulin, and C-peptide responses to glucose ingestion.
Plasma glucose, insulin, and C-peptide concentrations before and over a 3-hour period after ingesting a 75-g glucose drink (A, C, and E), and plasma glucose, insulin, and C-peptide 3-hour concentration AUC values (B, D, and F) in the lean-normal (NL), obese-NL, and obese-NAFLD groups. White, gray, and black circles in A, C, and E represent the lean-NL (n = 14), obese-NL (n = 24), and obese-NAFLD (n = 22) groups, respectively. Values in B, D, and F represent the mean ± SEM. P values were determined by 1-way ANOVA with post hoc testing to identify significant mean differences between groups when appropriate. *P < 0.05, value significantly different from the lean-NL value; P < 0.05, value significantly different from the obese-NL value.
Figure 2
Figure 2. Insulin kinetics after glucose ingestion.
Rate of total insulin delivered to the liver, comprising the rate of insulin secreted from β cells (white bars) and the rate of insulin recycled from the systemic circulation back to the liver (gray bars) (A), fractional hepatic insulin extraction (B), rate of total hepatic insulin extraction (C), rate of total extrahepatic insulin extraction (D), absolute contribution of hepatic (white bars) and extrahepatic (gray bars) insulin extraction to the total rate of whole-body insulin extraction (E), and relative contribution of hepatic (white bars) and extrahepatic (gray bars) extraction to the total rate of whole-body insulin extraction (F) in the lean-NL (n = 14), obese-NL (n = 23), and obese-NAFLD (n = 21) groups. Values represent the mean ± SEM and indicate the averages for 3 hours after glucose ingestion. A 1-way ANCOVA with race and sex as covariates and post hoc testing where appropriate were used to identify significant mean differences between groups. *P < 0.05, value significantly different from the lean-NL value; P < 0.05, value significantly different from the obese-NL value. Relationship between insulin delivery to the liver and the rate of total hepatic insulin extraction (G) and relationship between the insulin delivery rate into the systemic circulation and the rate of total extrahepatic insulin extraction (H) in lean-NL (white circles; n = 14), obese-NL (gray circles; n = 23), and obese-NAFLD (black circles; n = 21) participants. Logarithmic and linear regression analyses were performed to determine the line of best fit to the data in G and H, respectively.
Figure 3
Figure 3. Relationships among insulin sensitivity and insulin concentration after glucose ingestion and whole-body insulin clearance and extraction rates.
Relationships among whole-body insulin clearance and extraction rates assessed for 3 hours after ingestion of a 75-g glucose drink and muscle insulin sensitivity, calculated as the glucose Rd (in nmol/kg FFM/min) divided by the plasma insulin (I) concentration (in pmol/L) during a HECP (A and B), and the plasma insulin concentration AUC (C and D). White, gray, and black circles represent participants in the lean-NL (n = 14), obese-NL (n = 24 in A and C and n = 23 in B and D), and obese-NAFLD (n = 22 in A and C and n = 21 in B and D) groups, respectively. Logarithmic regression analysis was used to determine the lines of best fit to the data in AC, with Michaelis-Menten kinetics used to describe the line of best fit in D.
Figure 4
Figure 4. Indices of β cell function.
(A) Relationship between muscle insulin sensitivity, calculated as the glucose Rd (in nmol/kg FFM/min) divided by the plasma insulin (I) concentration (in pmol/L) during a HECP, and the mean insulin secretion rate, assessed for 3 hours after ingestion of a 75-g glucose drink in lean-NL (white circles; n = 14), obese-NL (gray circles; n = 24), and obese-NAFLD (black circles; n = 22) participants. Logarithmic regression analysis was used to determine the line of best fit to the data. (B) β Cell function index, calculated as the product of the incremental insulin secretion rate (in nmol × min) for 3 hours after glucose ingestion (ΔISR0–180) and muscle insulin sensitivity. Values represent the mean ± SEM. A 1-way ANCOVA with race and sex as covariates and post hoc testing where appropriate were used to identify significant mean differences between groups. *P <0.05, value significantly different from the lean-NL value; P <0.05, value significantly different from the obese-NL value.
Figure 5
Figure 5. Integrated summary of insulin kinetics after glucose ingestion.
Values represent the mean rates (in pmol/min) for β cell insulin secretion, tissue insulin extraction, and insulin accumulation in the systemic circulation, assessed for 3 hours after ingestion of a 75-g glucose drink. Insulin secretion by the pancreas into the portal circulation increased progressively from the lean-NL to the obese-NL to the obese-NAFLD groups. In addition, a large portion of insulin that entered the portal circulation was not immediately removed by the liver and extrahepatic tissues and was recycled back to the liver via the portal vein and hepatic artery, so the total amount of insulin delivered to the liver (newly secreted and recycled insulin) also increased progressively from the lean-NL to the obese-NL to the obese-NAFLD groups. Although the fractional hepatic extraction of delivered insulin progressively decreased, the rate of total hepatic insulin extraction progressively increased from the lean-NL to the obese-NL to the obese-NAFLD groups. However, the rate of hepatic insulin extraction plateaued when the delivery of insulin to the liver was high, as in the obese-NL and obese-NAFLD groups, because of a saturable hepatic insulin transport system. Most of the insulin that passes through the liver and enters the systemic circulation is recycled back to the liver, and a progressively increasing amount of insulin was removed by extrahepatic tissues (primarily the kidneys and skeletal muscle) in subjects in the lean-NL, obese-NL, and obese-NAFLD groups. A small portion of insulin that entered the systemic circulation (posthepatic insulin) was not removed by 180 minutes after glucose ingestion and was responsible for the increase in plasma insulin concentration above baseline at the 180-minute time point.

Similar articles

Cited by

References

    1. Korenblat KM, Fabbrini E, Mohammed BS, Klein S. Liver, muscle, and adipose tissue insulin action is directly related to intrahepatic triglyceride content in obese subjects. Gastroenterology. 2008;134(5):1369–1375. doi: 10.1053/j.gastro.2008.01.075. - DOI - PMC - PubMed
    1. Fabbrini E, et al. Intrahepatic fat, not visceral fat, is linked with metabolic complications of obesity. Proc Natl Acad Sci USA. 2009;106(36):15430–15435. doi: 10.1073/pnas.0904944106. - DOI - PMC - PubMed
    1. Fabbrini E, Sullivan S, Klein S. Obesity and nonalcoholic fatty liver disease: biochemical, metabolic, and clinical implications. Hepatology. 2010;51(2):679–689. doi: 10.1002/hep.23280. - DOI - PMC - PubMed
    1. Magkos F, Fabbrini E, Mohammed BS, Patterson BW, Klein S. Increased whole-body adiposity without a concomitant increase in liver fat is not associated with augmented metabolic dysfunction. Obesity (Silver Spring) 2010;18(8):1510–1515. doi: 10.1038/oby.2010.90. - DOI - PMC - PubMed
    1. Smith GI, et al. Insulin resistance drives hepatic de novo lipogenesis in nonalcoholic fatty liver disease. J Clin Invest. 2020;130(3):1453–1460. doi: 10.1172/JCI134165. - DOI - PMC - PubMed

Publication types

Associated data