

An Enteric-Coated Polyelectrolyte Nanocomplex Delivers Insulin in Rat Intestinal Instillations when Combined with a Permeation Enhancer
- PMID: 32178442
- PMCID: PMC7151133
- DOI: 10.3390/pharmaceutics12030259
An Enteric-Coated Polyelectrolyte Nanocomplex Delivers Insulin in Rat Intestinal Instillations when Combined with a Permeation Enhancer
Abstract
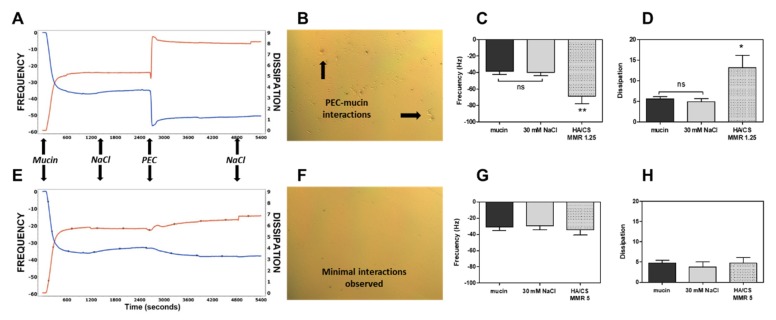
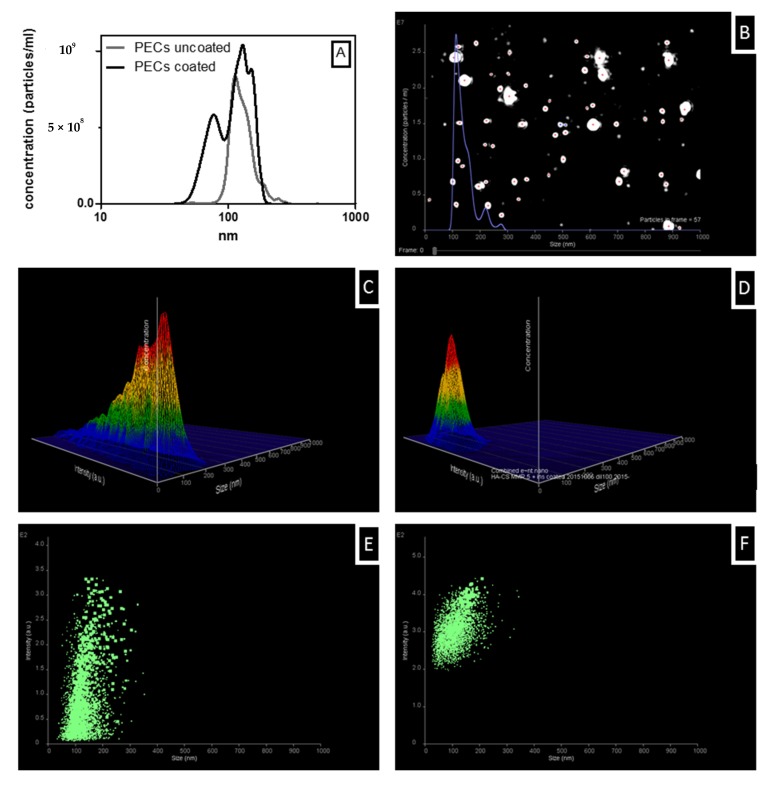
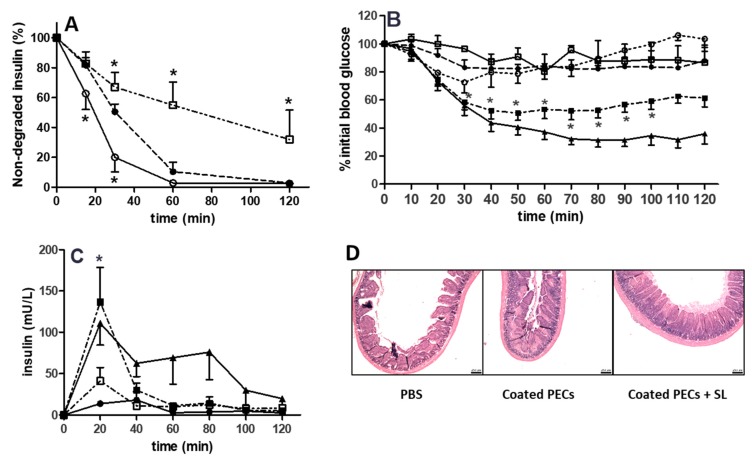
The use of nanocarriers is being researched to achieve oral peptide delivery. Insulin-associated anionic polyelectrolyte nanoparticle complexes (PECs) were formed that comprised hyaluronic acid and chitosan in an optimum mass mixing ratio of 5:1 (MR 5), followed by coating with a pH-dependent polymer. Free insulin was separated from PECs by size exclusion chromatography and then measured by HPLC. The association efficiency of insulin in PECs was >95% and the loading was ~83 µg/mg particles. Dynamic light scattering and nanoparticle tracking analysis of PECs revealed low polydispersity, a negative zeta potential range of -40 to -50 mV, and a diameter range of 95-200 nm. Dissolution studies in simulated small intestinal fluid (FaSSIF-V2) revealed that the PECs were colloidally stable. PECs that were coated with Eudragit® L-100 delayed insulin release in FaSSIF-V2 and protected insulin against pancreatin attack more than uncoated PECs. Uncoated anionic PECs interacted weakly with mucin in vitro and were non-cytotoxic to Caco-2 cells. The coated and uncoated PECs, both concentrated further by ultrafiltration, permitted dosing of 50 IU/kg in rat jejunal instillations, but they failed to reduce plasma glucose or deliver insulin to the blood. When ad-mixed with the permeation enhancer (PE), sucrose laurate (100 mM), the physicochemical parameters of coated PECs were relatively unchanged, however blood glucose was reduced by 70%. In conclusion, the use of a PE allowed for the PEC-released bioactive insulin to permeate the jejunum. This has implications for the design of orally delivered particles that can release the payload when formulated with enhancers.
Keywords: chitosan; hyaluronic acid; insulin; intestinal permeation enhancers; nanomedicine; oral peptide delivery.
Conflict of interest statement
D.J.B. consults for pharmaceutical companies working in oral peptide delivery.
Figures


Similar articles
-
NAD+-associated-hyaluronic acid and poly(L-lysine) polyelectrolyte complexes: An evaluation of their potential for ocular drug delivery.Eur J Pharm Biopharm. 2023 Nov;192:62-78. doi: 10.1016/j.ejpb.2023.10.004. Epub 2023 Oct 4. Eur J Pharm Biopharm. 2023. PMID: 37797681
-
Chitosan-Modified Cationic Amino Acid Nanoparticles as a Novel Oral Delivery System for Insulin.J Biomed Nanotechnol. 2015 Mar;11(3):486-99. doi: 10.1166/jbn.2015.1924. J Biomed Nanotechnol. 2015. PMID: 26307831
-
Development of Polyelectrolyte Complexes for the Delivery of Peptide-Based Subunit Vaccines against Group A Streptococcus.Nanomaterials (Basel). 2020 Apr 26;10(5):823. doi: 10.3390/nano10050823. Nanomaterials (Basel). 2020. PMID: 32357402 Free PMC article.
-
Self-assembled polyelectrolyte nanocomplexes between chitosan derivatives and insulin.J Pharm Sci. 2006 May;95(5):1035-48. doi: 10.1002/jps.20520. J Pharm Sci. 2006. PMID: 16565978
-
Development of Pectin-Type B Gelatin Polyelectrolyte Complex for Curcumin Delivery in Anticancer Therapy.Int J Mol Sci. 2018 Nov 17;19(11):3625. doi: 10.3390/ijms19113625. Int J Mol Sci. 2018. PMID: 30453614 Free PMC article.
Cited by
-
Enteric-Coated Strategies in Colorectal Cancer Nanoparticle Drug Delivery System.Drug Des Devel Ther. 2020 Oct 21;14:4387-4405. doi: 10.2147/DDDT.S273612. eCollection 2020. Drug Des Devel Ther. 2020. PMID: 33116423 Free PMC article. Review.
-
Assessment of In Vitro Release Testing Methods for Colloidal Drug Carriers: The Lack of Standardized Protocols.Pharmaceutics. 2024 Jan 12;16(1):103. doi: 10.3390/pharmaceutics16010103. Pharmaceutics. 2024. PMID: 38258113 Free PMC article. Review.
-
In Vitro and In Vivo Models for Evaluating the Oral Toxicity of Nanomedicines.Nanomaterials (Basel). 2020 Oct 31;10(11):2177. doi: 10.3390/nano10112177. Nanomaterials (Basel). 2020. PMID: 33142878 Free PMC article. Review.
-
Barriers to the Intestinal Absorption of Four Insulin-Loaded Arginine-Rich Nanoparticles in Human and Rat.ACS Nano. 2022 Sep 27;16(9):14210-14229. doi: 10.1021/acsnano.2c04330. Epub 2022 Aug 23. ACS Nano. 2022. PMID: 35998570 Free PMC article.
-
Natural Polysaccharide-Based Nanodrug Delivery Systems for Treatment of Diabetes.Polymers (Basel). 2022 Aug 8;14(15):3217. doi: 10.3390/polym14153217. Polymers (Basel). 2022. PMID: 35956731 Free PMC article. Review.
References
Grants and funding
LinkOut - more resources
Full Text Sources
