. 2020 Mar 11;11(1):1310.
doi: 10.1038/s41467-020-15155-6.

An organoid biobank for childhood kidney cancers that captures disease and tissue heterogeneity

Affiliations

An organoid biobank for childhood kidney cancers that captures disease and tissue heterogeneity

Camilla Calandrini et al. Nat Commun. .

Abstract

Kidney tumours are among the most common solid tumours in children, comprising distinct subtypes differing in many aspects, including cell-of-origin, genetics, and pathology. Pre-clinical cell models capturing the disease heterogeneity are currently lacking. Here, we describe the first paediatric cancer organoid biobank. It contains tumour and matching normal kidney organoids from over 50 children with different subtypes of kidney cancer, including Wilms tumours, malignant rhabdoid tumours, renal cell carcinomas, and congenital mesoblastic nephromas. Paediatric kidney tumour organoids retain key properties of native tumours, useful for revealing patient-specific drug sensitivities. Using single cell RNA-sequencing and high resolution 3D imaging, we further demonstrate that organoid cultures derived from Wilms tumours consist of multiple different cell types, including epithelial, stromal and blastemal-like cells. Our organoid biobank captures the heterogeneity of paediatric kidney tumours, providing a representative collection of well-characterised models for basic cancer research, drug-screening and personalised medicine.


Conflict of interest statement

J.D. and H.C. are named as inventors on several patents related to leucine-rich repeat-containing G protein-coupled receptor 5 (LGR5)+ stem cell-based organoid technology. The remaining authors declare no competing interests.

Figures

Fig. 1
Fig. 1. Establishment of a biobank of paediatric kidney cancer organoids.
a Overview of the procedure to generate and characterise paediatric kidney cancer organoids. Organoids were established from tumour and, if available, matching normal kidney tissue. Organoids were subsequently characterised using histology, whole-genome sequencing (WGS), RNA sequencing (RNA-seq) and DNA methylation profiling. Lastly, drug screens were performed on a subset of Wilms tumour organoids. Modified from Servier Medical Art, licensed under a Creative Common Attribution 3.0 Generic License. b Pie chart representing the composition of the paediatric kidney cancer organoid biobank, consisting of organoids derived from Wilms tumours, MRTKs, RCCs, nephrogenic rests, metanephric adenoma and congenital mesoblastic nephromas. Clinical characteristics can be found in Supplementary Table 1. c Representative brightfield microscopy images of normal kidney tissue-derived organoids, Wilms tumour organoids, MRTK organoids and RCC organoids (n = 3). H healthy, T primary tumour, M metastasis. Scale bar: 100 µm, zoom in 20 µm.
Fig. 2
Fig. 2. Histologic characterisation of paediatric kidney cancer organoids.
a H&E staining on tissue (top) and matching organoids (bottom) derived from the indicated tumour types (n = 3). Additional cases can be found in Supplementary Fig. 2. Scale bars: 100 µm, zoom in 50 µm. b Representative SMARCB1 staining on normal (left), primary tumour (middle) and metastasis (right) tissue (top) and matching organoids (bottom) of a patient with a MRTK (n = 3). Of note, immune cells stain positive for SMARCB1 in MRTK tissue. Additional cases can be found in Supplementary Fig. 3. Scale bars: 100 µm.
Fig. 3
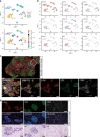
Fig. 3. Cellular heterogeneity within Wilms tumour organoid cultures.
a t-SNE representation of single cells from four Wilms tumour organoid lines (51T, 80T, 88T and 101T). Cells are coloured by organoid of origin (top panel) or clustering (bottom panel). Indicated are the cell types the populations are representing based on marker gene expression (see panel b). e: epithelial, s: stromal, b: blastemal-like. b t-SNE maps showing the colour-coded logged expression levels of several markers for each population demonstrating that different cell types are present in 51T and 88T, whereas 80T and 101T organoids primarily consist of different epithelial subpopulations, which is in line with their histological appearance. c High-resolution 3D imaging of 51T Wilms tumour organoids immunolabeled for E-cadherin (E-cad; red), SIX2 (green) and CD90 (white). Bottom panels depict enlargement from top panel in 3D (left panel) and a representative optical section (others panels). Scale bars, 100 µm (top) and 50 µm (bottom). Images are representative of n = 2 independent experiments. d Immunofluorescence imaging on 51T Wilms tumour tissue sections immunolabeled for E-cadherin (E-cad; red), SIX2 (green) and CD90 (white). Scale bars 100 µm. Images are representative of n = 2 independent experiments.
Fig. 4
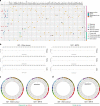
Fig. 4. Genetic characterisation of paediatric kidney cancer organoids reveals common driver mutations and copy number alterations.
a Overview of somatic mutations identified in paediatric kidney cancer organoids compared with their matching normal kidney organoids. When matching normal kidney organoids were not available, somatic mutations in known driver genes are indicated. Variant allele frequencies are given in Supplementary Data 2. b Genome-wide CNAs (karyograms) and coding gene mutations (circos plots) (c, d) in matching tumour tissue vs organoid and early vs serially passaged (P4, P5 vs P10, P11) reflecting ~3 months of culturing) organoid pairs reveal that organoids recapitulate the genetic landscape of the tissue they were derived from and that this genetic landscape is retained over time.
Fig. 5
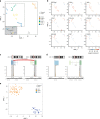
Fig. 5. Transcriptome and DNA methylation profiling of paediatric kidney cancer organoids.
a t-SNE representation of unsupervised graph-based clustering of paediatric kidney cancer organoids and tissues gene expression profiles, demonstrating a disease-based separation for the three main tumour types (RCC, MRTK and Wilms tumour) and a composition-based separation for the most prevalent one, Wilms tumour. b t-SNE maps, as in a, showing the colour-coded logged expression levels of several markers used in the clinic or separating the different populations. c, d Depicted are fusion transcripts detected in tRCC-derived organoids 107T (c) and 71T (d) with their chromosomal location and exon structure and a schematic representation of the fusion breakpoint. Coverage track of the fusion genes is included at the bottom, indicating RNA expression levels. The number above the red arc represents the sequencing reads that support the fusion event. e t-SNE analysis was performed using the top 2000 most variably methylated CpG sites in paediatric kidney cancer organoids and tissues, and revealed that organoids cluster with the tumour entity they were derived from.
Fig. 6
Fig. 6. Organoid drug screens reveal patient-specific drug sensitivities.
a Schematic overview of the organoid drug treatment experiment. b Graphs show the average IC50 values of vincristine (VCR), actinomycin D (ACT-D), doxorubicin (DOX) and etoposide (ETO) in the indicated Wilms tumour organoid lines. In case the IC50 value was not reached (see Supplementary Fig. 12a), the highest tested concentration was used for the calculations. Error bars represent SEM of three independent experiments (each individual experiment includes technical quadruplicates). P-values were calculated using a two-tailed Student’s t test, two-sided: **<0.01, ***<0.001. P-value VCR: 119 M vs 109T = 0.0005; 109T vs 51T = 0.0049. P-value ETO: 109T vs 86T = 0.0044. c Average IC50 values of romidepsin, panobinostat and PD0325901 in the indicated Wilms tumour and normal kidney organoid cultures. Each dot/square (two per organoid culture) represents the average of technical quadruplicates of an individual organoid culture. P-values were calculated using a two-tailed Student’s t test, two-sided: ****<0.0001. P-value Romidepsin: Wilms tumour vs normal kidney = 0.8339. d Dose–response curves (left) and average IC50 (right) of Idasanutlin on the indicated Wilms tumour and normal kidney organoid cultures. As control for P53 function, 80T-TP53KO organoids were included, thereby demonstrating that anaplastic Wilms tumour-derived organoids (98T) are less sensitive to Idasanutlin treatment. Curves with the same colour represent independent experiments. Each individual point represents the average of quadruplicate measurements. Source data are provided as a Source Data file.

Similar articles

Cited by

References

    1. Pui CH, Gajjar AJ, Kane JR, Qaddoumi IA, Pappo AS. Challenging issues in pediatric oncology. Nat. Rev. Clin. Oncol. 2011;8:540–549. doi: 10.1038/nrclinonc.2011.95. - DOI - PMC - PubMed
    1. Siegel RL, Miller KD, Jemal A. Cancer statistics, 2016. CA Cancer J. Clin. 2016;66:7–30. doi: 10.3322/caac.21332. - DOI - PubMed
    1. Breslow N, Olshan A, Beckwith JB, Green DM. Epidemiology of Wilms tumor. Med Pediatr. Oncol. 1993;21:172–181. doi: 10.1002/mpo.2950210305. - DOI - PubMed
    1. Gooskens SL, et al. Congenital mesoblastic nephroma 50 years after its recognition: a narrative review. Pediatr. Blood Cancer. 2017;64:e26437. doi: 10.1002/pbc.26437. - DOI - PubMed
    1. van den Heuvel-Eibrink MM, et al. Position paper: rationale for the treatment of Wilms tumour in the UMBRELLA SIOP-RTSG 2016 protocol. Nat. Rev. Urol. 2017;14:743–752. doi: 10.1038/nrurol.2017.163. - DOI - PubMed

Publication types

MeSH terms