. 2020 Mar 24;117(12):6540-6549.
doi: 10.1073/pnas.1921027117. Epub 2020 Mar 11.

Stochastic activation and bistability in a Rab GTPase regulatory network

Affiliations

Stochastic activation and bistability in a Rab GTPase regulatory network

Urban Bezeljak et al. Proc Natl Acad Sci U S A. .

Abstract

The eukaryotic endomembrane system is controlled by small GTPases of the Rab family, which are activated at defined times and locations in a switch-like manner. While this switch is well understood for an individual protein, how regulatory networks produce intracellular activity patterns is currently not known. Here, we combine in vitro reconstitution experiments with computational modeling to study a minimal Rab5 activation network. We find that the molecular interactions in this system give rise to a positive feedback and bistable collective switching of Rab5. Furthermore, we find that switching near the critical point is intrinsically stochastic and provide evidence that controlling the inactive population of Rab5 on the membrane can shape the network response. Notably, we demonstrate that collective switching can spread on the membrane surface as a traveling wave of Rab5 activation. Together, our findings reveal how biochemical signaling networks control vesicle trafficking pathways and how their nonequilibrium properties define the spatiotemporal organization of the cell.

Keywords: Rab5; bistability; positive feedback; stochasticity.


Conflict of interest statement

The authors declare no competing interest.

Figures

Fig. 1.
Fig. 1.
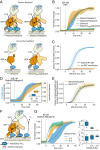
Rab5:GDI activation on phospholipid membranes is ultrasensitive and stochastic. (A) Schematic of Rab5 activation reconstitution assay on an SLB. (B, Top) Addition of Rabex5:Rabaptin5 triggers nucleotide exchange by CF488A-Rab5, which can be followed by an increase of fluorescence intensity on the membrane surface. Solid line is mean normalized intensity; shaded area corresponds to SD (n = 4). (B, Bottom) Micrographs of CF488A-Rab5 binding to the SLB after addition of 200 nM GEF complex and corresponding kymograph (below) taken along the yellow line (scale bar, 5 μm). (C) Rab5 intensity traces obtained at increasing Rabex5:Rabaptin5 concentrations. (D) Rab5:GDI activation response diagram with Rabex5:Rabaptin5. The fold change was calculated by dividing the fluorescence intensity at steady state with the average signal 10 min before GEF addition. (E) Activation delay Ti decreases with higher Rabex5:Rabaptin5 concentration. Where no detectable activation was observed within 150 min, the Tis are denoted as >150 min and shown in orange. Error bars are SD. (F) Relative maximum rates kmax against the GEF complex concentration reveal cooperativity of Rab5 activation. Without detectable activation within 150 min, the activation rate was determined to be 0 and the corresponding points are depicted in orange. Error bars are means ± SD. (G) Schematic representation of modeled molecular interactions. We constructed a model of the minimal Rab5 activation network based on the known literature (–11, 21, 53). The ordinary differential equations were derived from mass action kinetics. (H) Stochastic model simulations of Rab5 activation at increasing Rabex5:Rabaptin5 particle numbers. Shown are average curves from 50 individual runs in bold and 10 random traces per condition. The effective simulation time was scaled to align with experimental results. (IK) Signal fold change, temporal delays, and relative maximum rates from the stochastic simulations in H. We ran 50 individual stochastic simulations per condition.
Fig. 2.
Fig. 2.
Positive feedback of Rab5 activation depends on GEF recruitment. (A) Illustration of protein interactions responsible for collective Rab5 switching. Positive feedback originates from a direct interaction between Rabex5:Rabaptin5 and Rab5:GTP. (B) Fluorescence intensity traces obtained from experiments depicted in A. Solid lines are mean normalized intensities; shaded areas are SD (Rabex5:Rabaptin5, ΔRabex5:Rabaptin5 n = 4; ΔRabex5, Rabex5:ΔRBDRabaptin5 n = 3). (C) Stochastic model simulations with and without Rabex5:Rabaptin5:Rab5:GTP complex formation (k5, k6 = 0) for 200 Rabex5:Rabaptin5 particles. Average curves from 50 individual runs are depicted in bold with 10 random traces per condition. The effective simulation time was scaled to align with experimental results. (D) Kinetic traces of CF488A-Rab5 and Rabex5:sCy5-Rabaptin5 activation. Solid line is mean normalized fluorescence intensity; shaded area is SD (n = 5). (Inset) Ti for CF488A-Rab5 (blue) and Rabex5:sCy5-Rabaptin5 (orange). (E) Stochastic model simulations for Rab5 and Rabex5:Rabaptin5 membrane binding for 200 Rabex5:Rabaptin5 particles. Shown are curves from 50 independent runs; the mean line is depicted bold with 10 random traces per condition. (F) Schematic of the reconstitution experiment with preactivated SLB-immobilized Rab5Q80L-His10:GTP. (G) Collective switching is faster with preactivated Rab5. (Left) Rab5 switching time courses in presence of 500 nM Rab5Q80L-His10 with increasing DOGS-NTA lipid concentration in the SLB. Solid line is mean normalized fluorescence intensity over time, shaded area is SD (n = 3). (Right) Corresponding time delays Ti and relative maximum rates kmax.
Fig. 3.
Fig. 3.
Rab5:GDI activation is tuned by free Rab5:GDP abundance. (A) Rab5 cycles between the membrane and solution before and after nucleotide exchange. (Top) sCy5-Rab5 molecule counts per frame and collective CF488A-Rab5 activation. (Bottom) Snapshots of the activation reaction. sCy5- and CF488A-Rab5 are depicted in yellow and cyan, respectively. The sCy5 channel was smoothed before merging to reduce nonspecific high-frequency noise (scale bar, 10 μm). (B) Rab5 single-molecule trajectories reveal GDP- and GTP-bound proteins on the membrane. (Top) Five hundred tracks of membrane-bound sCy5-Rab5 particles before (GDP) and after (GTP) activation. (Bottom) Frequency diagram identifies two populations with distinct lifetimes. A monoexponential decay with lifetime τGDP and two-exponential decay with lifetimes τ1GTP and τ2GTP was fitted to grouped data from n = 5 independent experiments, respectively (nGDP = 4829, τGDP = 0.58 ± 0.04 s; nGTP = 3090, τ1GTP = 1.20 ± 0.35 s, τ2GTP = 10.6 ± 3.3 s; errors are 95% CI). Box plot with mean lifetimes, **P < 0.01, two-sided Student’s t test (n = 5). (C) Parameter phase space of the phenomenological model for Rab5 switching, depending on the basal rate of activation (a0/a2K) and the strength of positive feedback (a1/a2K). Switching is defined as the relative difference in steady-state Rab5 concentration on the membrane relative to the scenario with no positive feedback. (Inset) Fold activation along the red line in the diagram. Stochasticity was introduced by solving the phenomenological model within a Fokker–Planck framework. See text for parameter definitions. (D) Stoichiometric GDI excess over Rab5 affects delay of Rab5 activation in vitro. (Left) Solid lines are mean normalized intensities over time, shaded areas correspond to SD (n = 3). (Right) Corresponding activation Ti and relative maximum rates kmax. (E) Stochastic simulations of the full model for varying initial amounts of GDI excess (0 to 2,000 particle number). Shown are curves from 10 random runs per condition; the mean line from 50 runs is depicted in bold. The effective simulation time was scaled to align with experimental results. (F) PRA1 in the membrane enhances Rab5 activation at low GEF concentrations. Solid lines are mean normalized fluorescence intensities; shaded areas correspond to SD (n = 3).
Fig. 4.
Fig. 4.
GAP activity reveals bistability of the reconstituted network. (A) Effect of RabGAP-5 on Rab5 activation. Different concentrations of RabGAP-5 were present in experiments with 500 nM CF488A-Rab5:GDI and 2 μM GDI, before adding 80 nM Rabex5:Rabaptin5. Shown are time courses at increasing GAP concentrations. (B) Maximal rates kmax of Rab5 activation for curves shown in A. Without detectable activation within 150 min, the activation rate was set to 0 and the corresponding points are depicted in orange. Error bars are SD. (C) Activation delay Ti for data presented in A. Without detectable activation, the times to inflection point are denoted as >150 min (orange). (D) GAP addition after activation with 80 nM GEF. RabGAP-5 was added to 500 nM and 2 µM final concentration, respectively. The traces were offset to the point of GAP addition. (E) GAP titration response curve. The fold change was calculated by dividing the fluorescence intensity at steady state with the average fluorescence signal 10 min before GEF addition. The +GAP → +GEF fold values (circles) are calculated based on traces in A and +GEF → +GAP values are taken from D. Activation is depicted in blue and inactive reactions in orange (fold <10). (F) Changing the dissociation rate in opposite directions reveals hysteresis in switching of the phenomenological model after 150 min. Shown are means of 20 simulations; error bars are SD.
Fig. 5.
Fig. 5.
Rab5 activation wave spreads on membrane in presence of GAP. (A) Micrographs of CF488A-Rab5 activation wave spreading across the membrane (scale bar, 20 μm). Times indicate relative duration after start of acquisition, not time after addition of GEF complex. (B) Fluorescence intensity time profile of the indicated area in A. (C) Kymograph of the indicated area in A and mean wave velocity. Wave velocity was determined from the slope of fluorescence increase in generated kymographs (n = 6). (D) Simulated Rab5 activation front with diffusion inclusion in the phenomenological model (SI Appendix, Supplementary Text and SI Appendix, Eq. 6). (E) Solution in terms of the dimensionless distance x/(D/a2).
Fig. 6.
Fig. 6.
The reconstituted Rab5 regulatory network. The Rab5 activation network of Rab5:GDI, Rabex5:Rabaptin5, and the membrane is intrinsically stochastic and bistable. The switching probability depends on the amount of membrane-bound Rab5:GDP, which in turn is controlled by GDI extraction and the presence of a GDF such as PRA1 that counters the GDI activity. Furthermore, RabGAP-5 can suppress activation by limiting the amount of active Rab5:GTP on the membrane. This effect increases the bistability of the system and can give rise to waves of Rab5 activation on the membrane. The interplay of the network’s components enables the cell to precisely trigger collective Rab activation in space and time.

Similar articles

Cited by

References

    1. Altschuler S. J., Angenent S. B., Wang Y., Wu L. F., On the spontaneous emergence of cell polarity. Nature 454, 886–889 (2008). - PMC - PubMed
    1. Huang C. Y., Ferrell J. E. Jr, Ultrasensitivity in the mitogen-activated protein kinase cascade. Proc. Natl. Acad. Sci. U.S.A. 93, 10078–10083 (1996). - PMC - PubMed
    1. Pomerening J. R., Sontag E. D., Ferrell J. E. Jr, Building a cell cycle oscillator: Hysteresis and bistability in the activation of Cdc2. Nat. Cell Biol. 5, 346–351 (2003). - PubMed
    1. Gardner T. S., Cantor C. R., Collins J. J., Construction of a genetic toggle switch in Escherichia coli. Nature 403, 339–342 (2000). - PubMed
    1. Barr F. A., Review series: Rab GTPases and membrane identity: Causal or inconsequential? J. Cell Biol. 202, 191–199 (2013). - PMC - PubMed

Publication types

MeSH terms

Substances

LinkOut - more resources