. 2020 Nov;287(22):4996-5018.
doi: 10.1111/febs.15291. Epub 2020 Apr 6.

Zinc modulation of proton currents in a new voltage-gated proton channel suggests a mechanism of inhibition

Affiliations

Zinc modulation of proton currents in a new voltage-gated proton channel suggests a mechanism of inhibition

Gustavo Chaves et al. FEBS J. 2020 Nov.

Abstract

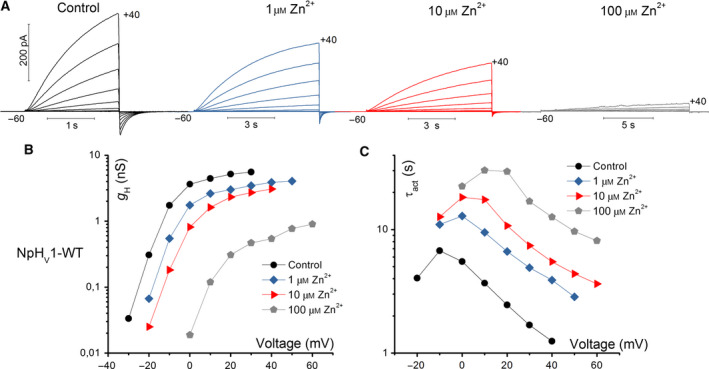
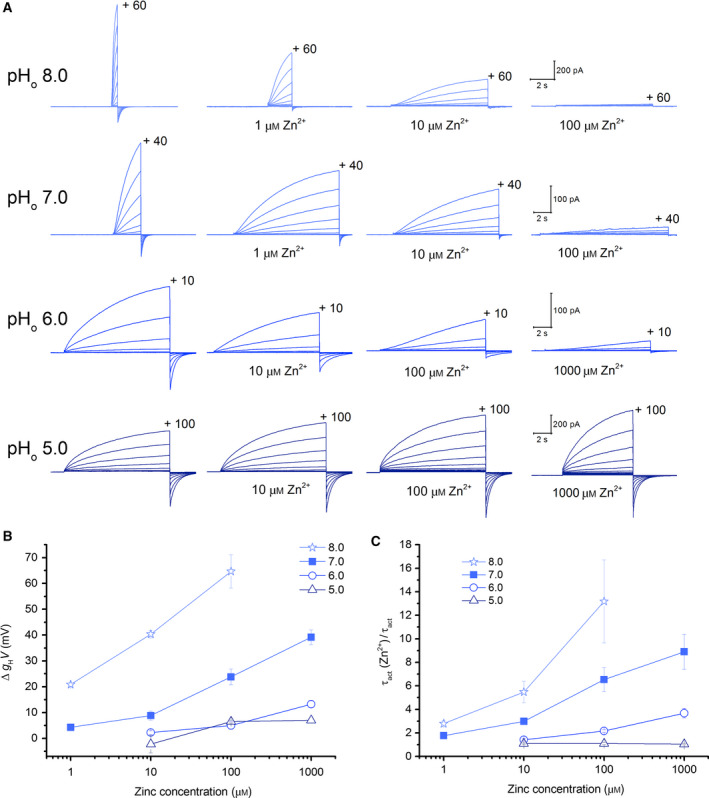
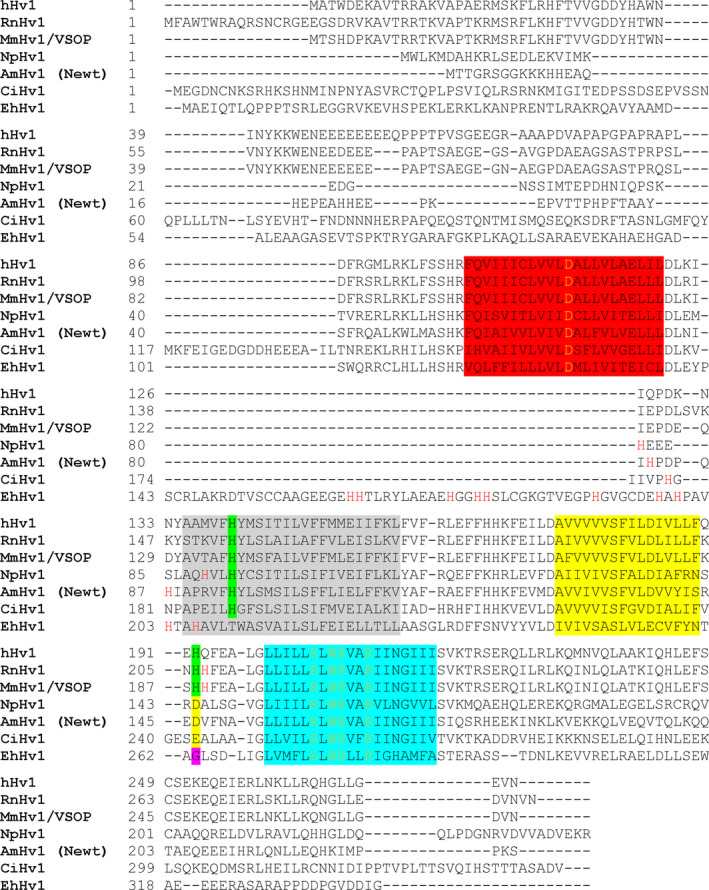
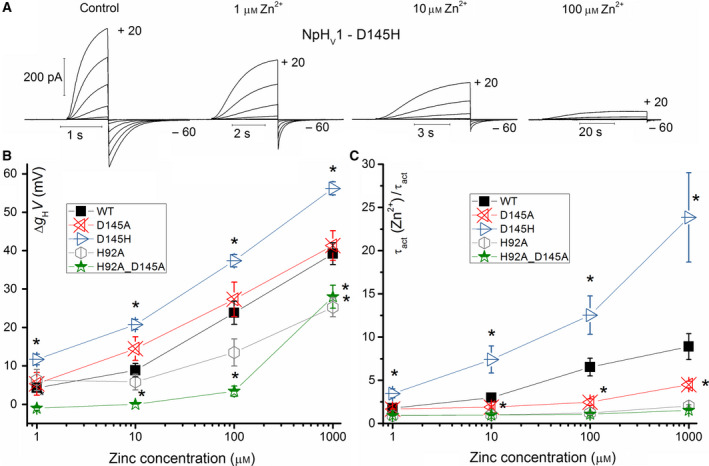
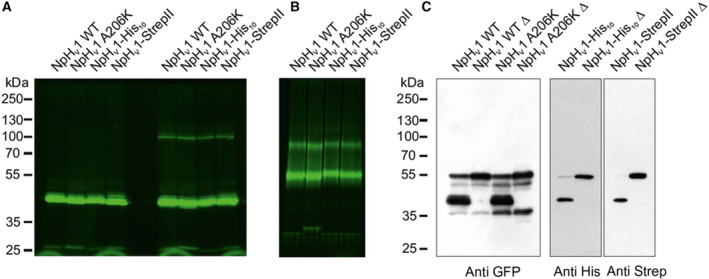
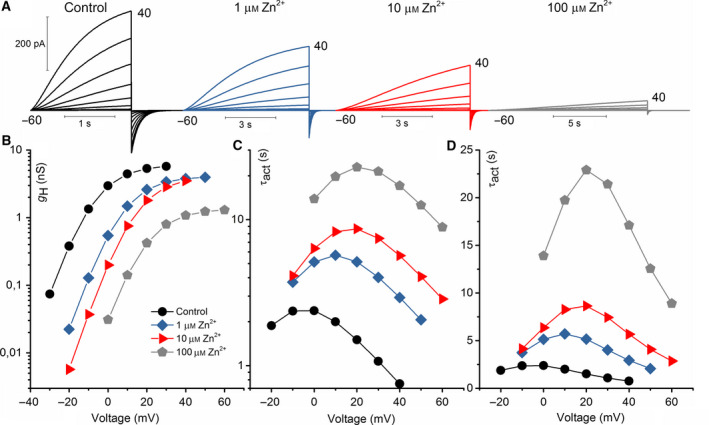
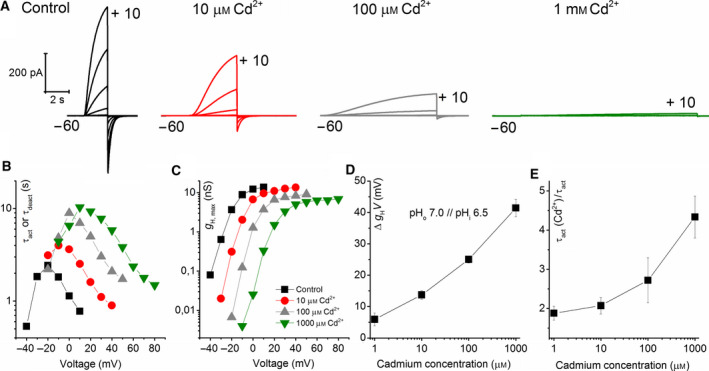
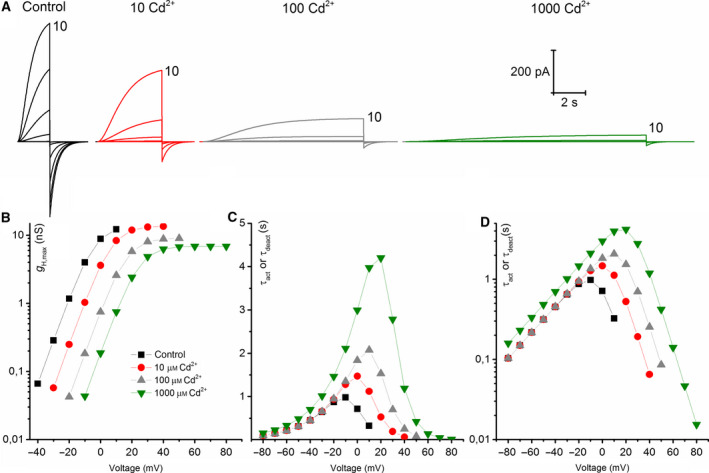
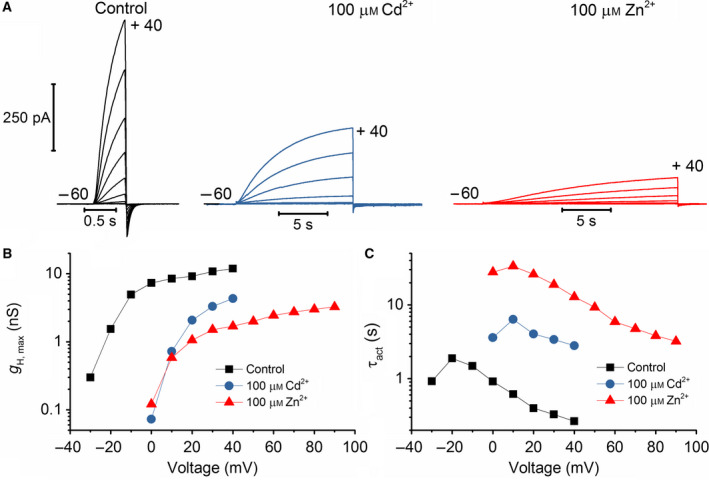
The HV 1 voltage-gated proton (HV 1) channel is a key component of the cellular proton extrusion machinery and is pivotal for charge compensation during the respiratory burst of phagocytes. The best-described physiological inhibitor of HV 1 is Zn2+ . Externally applied ZnCl2 drastically reduces proton currents reportedly recorded in Homo sapiens, Rattus norvegicus, Mus musculus, Oryctolagus cuniculus, Rana esculenta, Helix aspersa, Ciona intestinalis, Coccolithus pelagicus, Emiliania huxleyi, Danio rerio, Helisoma trivolvis, and Lingulodinium polyedrum, but with considerable species variability. Here, we report the effects of Zn2+ and Cd2+ on HV 1 from Nicoletia phytophila, NpHV 1. We introduced mutations at potential Zn2+ coordination sites and measured Zn2+ inhibition in different extracellular pH, with Zn2+ concentrations up to 1000 μm. Zn2+ inhibition in NpHV 1 was quantified by the slowing of the activation time constant and a positive shift of the conductance-voltage curve. Replacing aspartate in the S3-S4 loop with histidine (D145H) enhanced both the slowing of activation kinetics and the shift in the voltage-conductance curve, such that Zn2+ inhibition closely resembled that of the human channel. Histidine is much more effective than aspartate in coordinating Zn2+ in the S3-S4 linker. A simple Hodgkin Huxley model of NpHV 1 suggests a decrease in the opening rate if it is inhibited by zinc or cadmium. Limiting slope measurements and high-resolution clear native gel electrophoresis (hrCNE) confirmed that NpHV 1 functions as a dimer. The data support the hypothesis that zinc is coordinated in between the dimer instead of the monomer. Zinc coordination sites may be potential targets for drug development.

Keywords: HV1; ion channel; patch-clamp; structure-function; zinc.


Conflict of interest statement

The authors declare no conflict of interest.

Figures

Fig. 1
Fig. 1
WT NpHV1 voltage‐gated proton channel is inhibited by zinc. (A) Whole‐cell voltage‐clamp current measurement in the same cell at three zinc concentrations pHo 7.0//pHi 6.5. Pulses were applied in 10 mV increments up to the voltage shown up to +40 mV. The holding potential was −60 mV and the first pulse at −50 mV. (B) Conductance determined by single exponential fits of the activation kinetics (C). Activation kinetics at indicated [Zn2+].
Fig. 2
Fig. 2
Zinc inhibition of NpHV1 WT in pHo 5.0, pHo 6.0, pHo 7.0, and pHo 8.0. (A) Comparison of the zinc inhibition at four different pHo measured in the absence (left‐most family) and presence of Zn2+, as indicated. The data in each row are from the same cell, and the calibration bars apply to each row. The internal pH was 7.5 for pHo 8.0, 6.5 for pHo 7.0, and pHi 5.5 for pHo 6.0 and pHo 5.0. The cell at pHo 7 was held at −60 mV, and pulses applied in 10 mV increments from −50 to +40 mV. This is the same cell shown in Fig. 1. The cell at pHo 8 was held at −40 mV, and pulses applied in 10 mV increments. The cell at pHo 6.0 was held at −60 mV, and pulses applied in 10 mV increments from −50 to +10 mV. The cell at pHo 5.0 was held at −20 mV, and pulses applied in 10 mV increments from −10 to +100 mV. (B) Effects of [Zn2+] on the g HV rightward shifts analyzed with control measurements at 10% of the g H,max. The data are displayed as mean ± SEM. (C) The slowing of the activation kinetics due to [Zn2+] compared to control is shown. Plotted is the mean ± SEM. Slowing by [Zn2+] decreases drastically at lower pHo. τact was determined as the average of the same three consecutive voltage steps of the τact–voltage curve for all [Zn2+]. Number of the cells studied in B and C pHo 8.0 n = 5–9, pHo 7.0 n = 4–8, pHo 6.0 n = 4–8, and pHo 5.0 n = 2–4. The current families at pHo 7.0 are the same as in Fig. 1.
Fig. 3
Fig. 3
Alignment of human, rat, mouse, insect, newt, sea squirt, and algae proton channels. Alignment of the seven voltage‐gated proton channels. Location of the transmembrane domains is highlighted S1 = red, S2 = gray, S3 = yellow, S4 = turquoise. Potential zinc‐coordinating residues are highlighted green. Externally accessible histidines are colored red if not highlighted. The aspartate responsible for selectivity is colored yellow, and the signature sequence for proton channels RxWRxxR is colored orange. Aspartate 145 of NpHV1 is shaded yellow at the corresponding position of histidines, and glycine is labeled too. The proton channels are abbreviated as the following: hHV1 = human, RnHV1 = rat, MmHV1/VSOP = mouse, NpHV1 = Nicoletia phytophila, AmHV1 = Ambystoma mexicanum[95], CiHV1 = Ciona intestinalis, and EhHV1 = Emiliania huxleyi.
Fig. 4
Fig. 4
Substitution of the aspartate at position 145 with histidine strongly increases zinc inhibition. (A) Whole‐cell measurement of the D145H mutant at pHo 7 with increasing [Zn2+]. Pulses were applied in 10 mV increments up to +20 mV. The holding potential was −60 mV. The raw data show the immense slowing of the channel due to zinc (note the changing calibration bars). (B) Shift of the conductance–voltage curve in all recorded mutants due to increasing [Zn2+]. The conductance was determined by single exponential fit of the activation kinetic. Data are depicted as mean ± SEM. (C) Slowing of τact displayed as a ratio τact (Zn2+)/ τact corrected for the g HV shift. Data are depicted as mean ± SEM. Number of cells analyzed in B and C, WT n = 3–8, D145A n = 3–6, D145H n = 3–8, H92A n = 3–6, and H92A_D145A n = 3–8.
Fig. 5
Fig. 5
Biochemical analysis of NpHV1 architecture. (A) SDS/PAGE analysis of NpHV1‐GFP heterologously expressed in HEK 293T (tsA 201) cells. Protein samples were separated on a 10% SDS gel either in the presence (left) or in the absence (right) of β‐mercaptoethanol. In the absence of β‐mercaptoethanol, a second band of higher molecular weight appears presumably representing NpHV1 multimers (n = 9). (B) hrCNE analysis of the same protein constructs displaying both monomeric and dimeric NpHV1‐GFP. GFP‐tagged proteins were visualized by fluorescence scanning of the gels. C‐terminal extension of NpHV1 GFP with a deca‐His Tag or StrepTagII was used to demonstrate full‐length protein expression (n = 6). (C) Western blot analysis of heated (Δ) or nonheated protein samples (3 min at 95 °C) (n = 1). Without heating, there is a discrepancy in the calculated MW (56 kDa) and the apparent MW (45 kDa). After heating, the apparent MW confirms the calculated MW. The MW standard of A and C does not apply for B.
Fig. 6
Fig. 6
Limiting slope analysis and instantaneous currents of NpHV1. (A) Measurement of the limiting slope based on voltage steps near the threshold of 2 mV. Current families of pulse length from 2 to 30 s are plotted to show the full conductance–voltage curve. A linear fitting was applied to the steepest part of the conductance–voltage curve. This cell’s calculated gating charge was around 4.8 e 0. (B) Instantaneous current–voltage relationship of NpHV1 WT with Zn2+ concentrations ranging from 0 to 100 μm. While the traces with zinc 1–100 μm overlap, the currents for control conditions diverge mostly at higher voltages.
Fig. 7
Fig. 7
Model of zinc inhibition based on Fig. 1. (A) Modeled current families with pulses from −60 to +40 mV in 10 mV increments. The left‐most family was compiled using a kinetic model with rate constants determined from the control family in Fig. 1. Currents close to threshold and above were best fitted to the power of 1.5. The other three families were then generated by mainly changing the rate of channel opening. Except in the last family also the rate constant of closing was decreased twice. (B) Conductance–voltage curves showing the effects of changing rate constant of opening by scaling to the g H values of Fig. 1. (C) Activation kinetics is given by the model in the logarithmic scale. (D) Activation kinetics is given by the model in a linear scale.
Fig. 8
Fig. 8
Cadmium inhibits NpHV1 WT channel. (A) Current families with pulses from −60 to +10 mV and a 10 mV increment. Measurements were conducted in pHo = 7.0 pHi = 6.5. Cadmium concentration is indicated. (B) Decreasing of activation kinetics by four concentrations of Cd2+. (C) Proton conductance at increasing Cd2+ concentration. (D) Shift of g H relative to control conductance n = 3–8. (E) Activation kinetic slowed and corrected for g HV shift in comparison with control n = 3–8. All error bars are SEM Legend in C applies to C and B.
Fig. 9
Fig. 9
Model of cadmium inhibition based on Fig. 8. (A) Control model family was compiled using α and β rate constants determined from the control family of Fig. 8. At 1 mm, Cd2+ β was decreased additional to α. (B) Conductance–voltage plot, g H scaled to the values from Fig. 8 for each Cd2+ concentration. (C) Activation kinetics–voltage graph including the deactivation kinetics given by the model. (D) Activation kinetics vs. voltage depicted on a half logarithmic plot.
Fig. 10
Fig. 10
Direct comparison of 100 μm Cd2+ and 100 μm Zn2+ effects on NpHV1 WT. (A) Comparison of Zn2+ inhibition and Cd2+ inhibition of NpHV1 at identical metal concentrations, in the same cell. Voltage pulses are form −60 to +40 mV in 10 mV increments, pHo 7.0, pHi 6.5. (B) Conductance–voltage plot shows both metals shift the conductance identically to the right. (C) Activation kinetics is slowed less by Cd2+ than by Zn2+.

Similar articles

Cited by

References

    1. Thomas RC & Meech RW (1982) Hydrogen ion currents and intracellular pH in depolarized voltage‐clamped snail neurones. Nature 299, 826–828. - PubMed
    1. Ramsey IS, Moran MM, Chong JA & Clapham DE (2006) A voltage‐gated proton‐selective channel lacking the pore domain. Nature 440, 1213–1216. - PMC - PubMed
    1. Sasaki M, Takagi M & Okamura Y (2006) A voltage sensor‐domain protein is a voltage‐gated proton channel. Science 312, 589–592. - PubMed
    1. Taylor AR, Chrachri A, Wheeler G, Goddard H & Brownlee C (2011) A voltage‐gated H+ channel underlying pH homeostasis in calcifying coccolithophores. PLoS Biol 9, e1001085. - PMC - PubMed
    1. Chaves G, Derst C, Franzen A, Mashimo Y, Machida R & Musset B (2016) Identification of an HV 1 voltage‐gated proton channel in insects. FEBS J 283, 1453–464. - PubMed

Publication types

MeSH terms