. 2020 Feb 21:7:20.
doi: 10.3389/fmolb.2020.00020. eCollection 2020.

Routine Optical Clearing of 3D-Cell Cultures: Simplicity Forward

Affiliations

Routine Optical Clearing of 3D-Cell Cultures: Simplicity Forward

Elina Nürnberg et al. Front Mol Biosci. .

Abstract

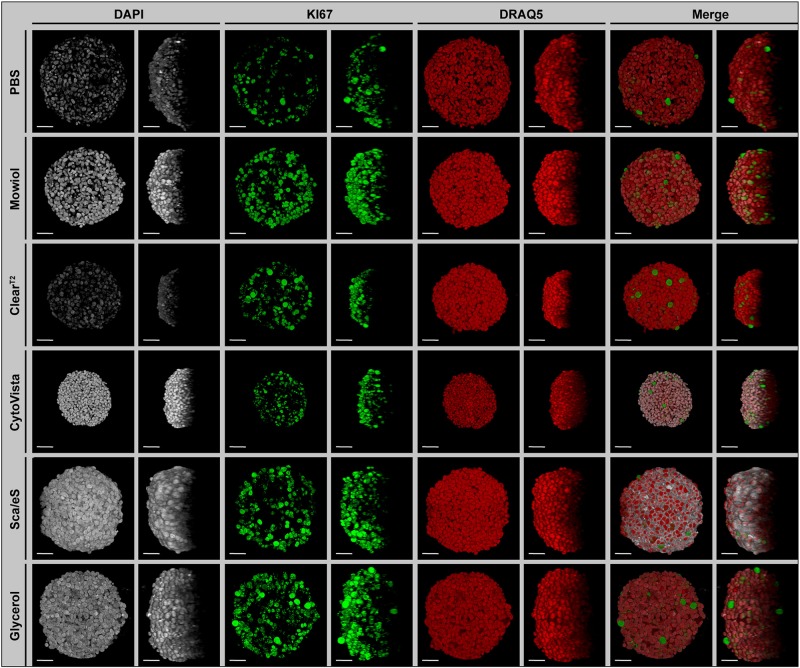
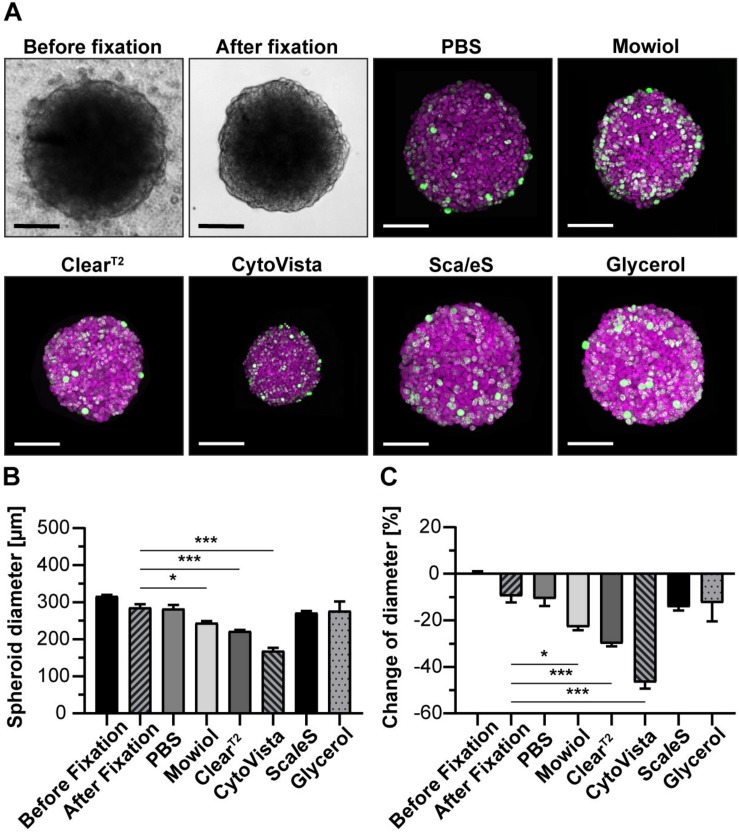
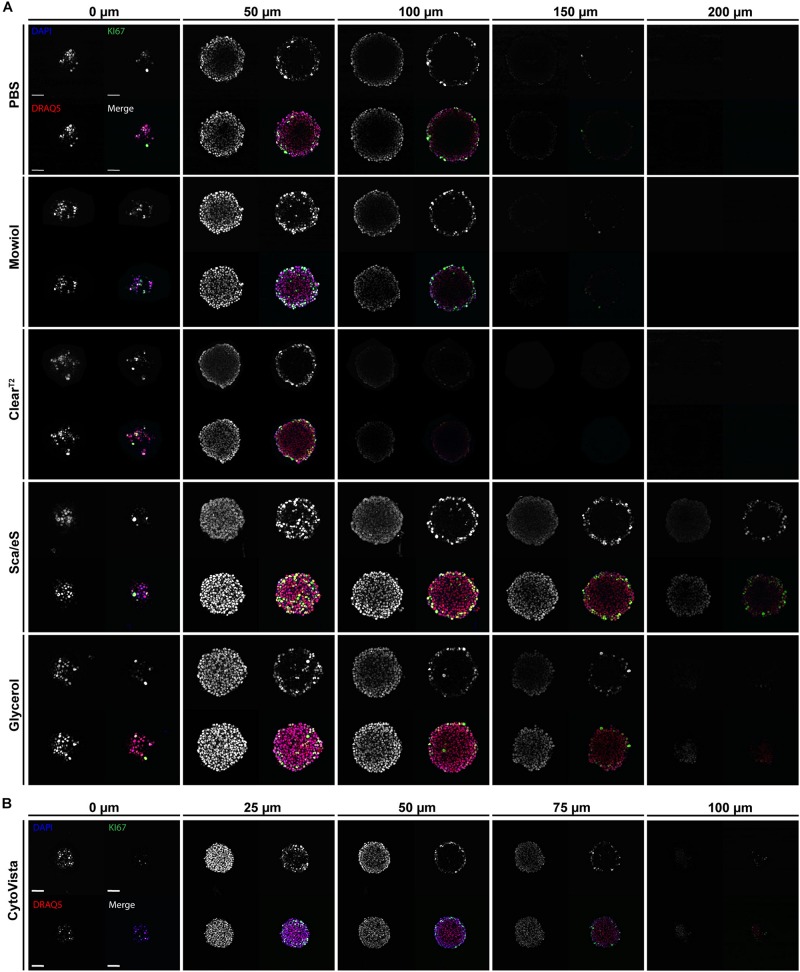
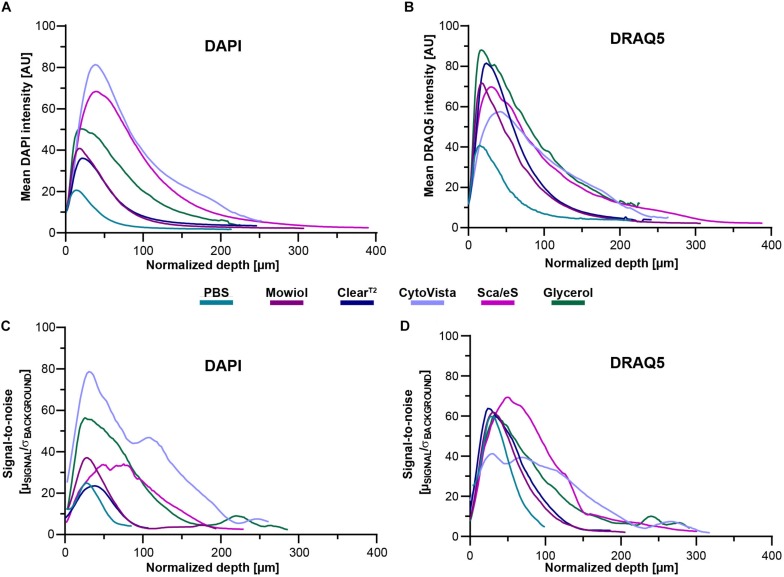
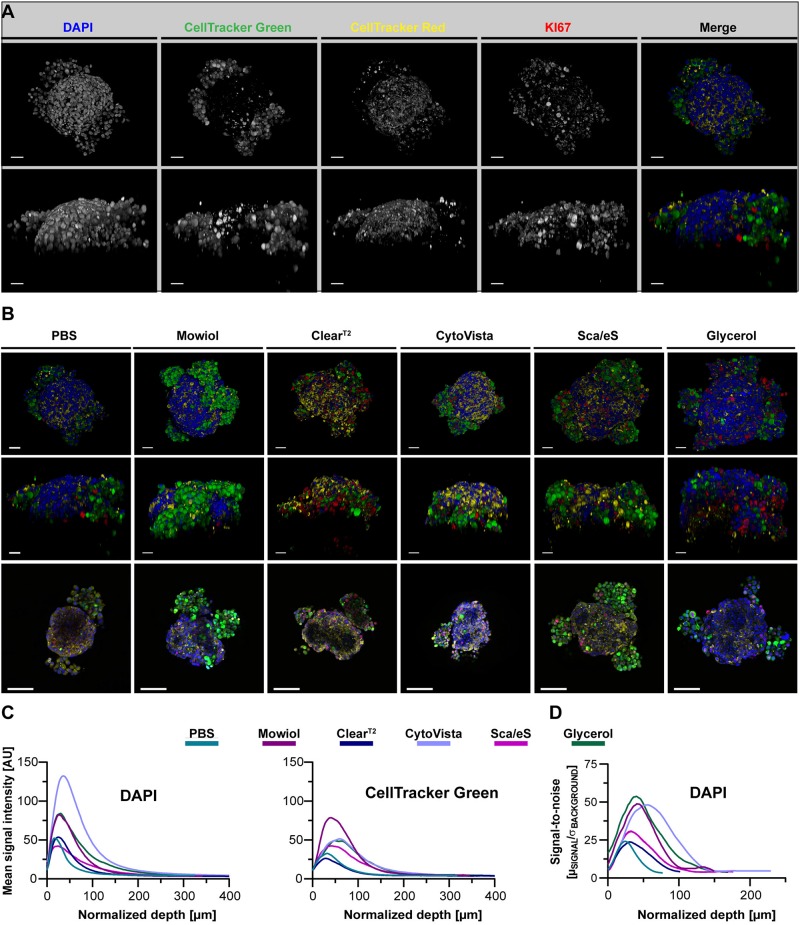
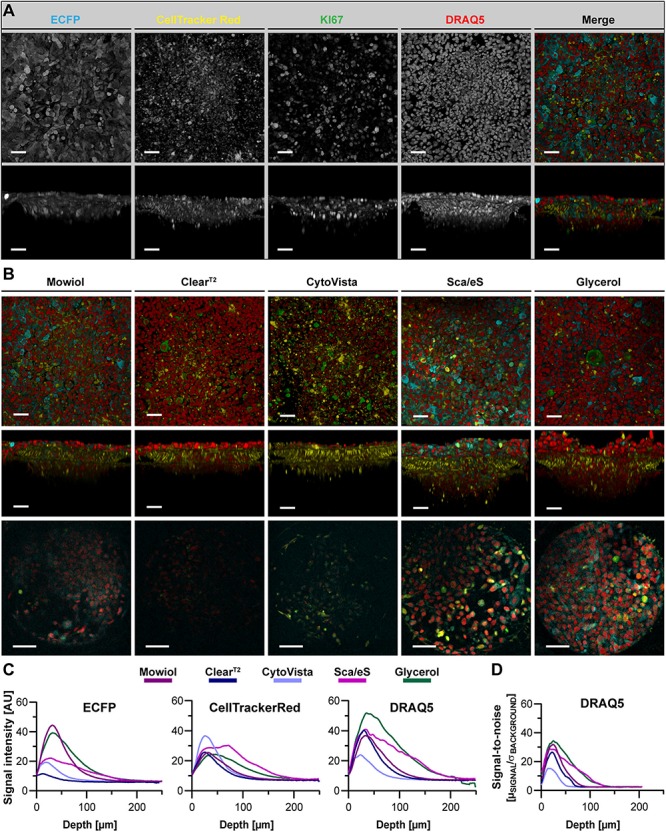
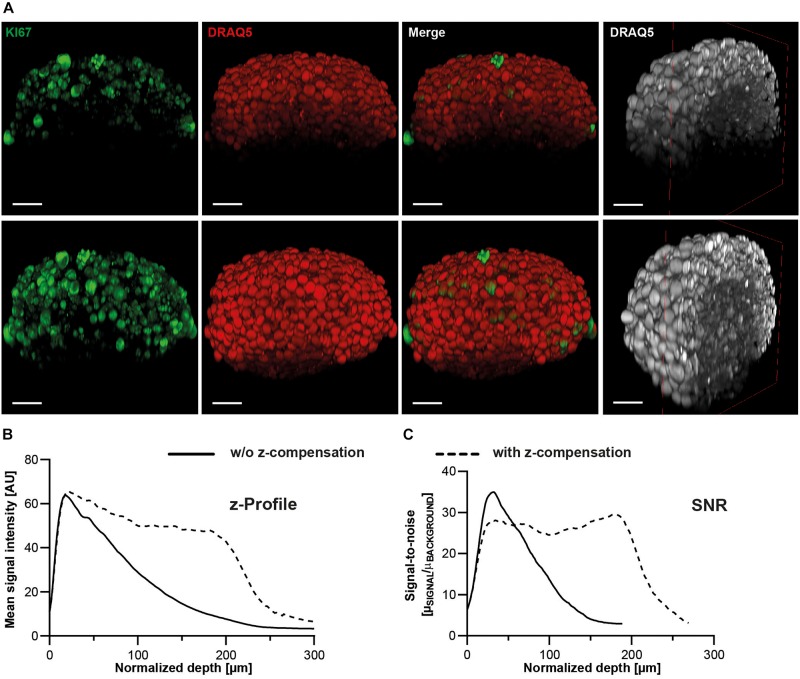
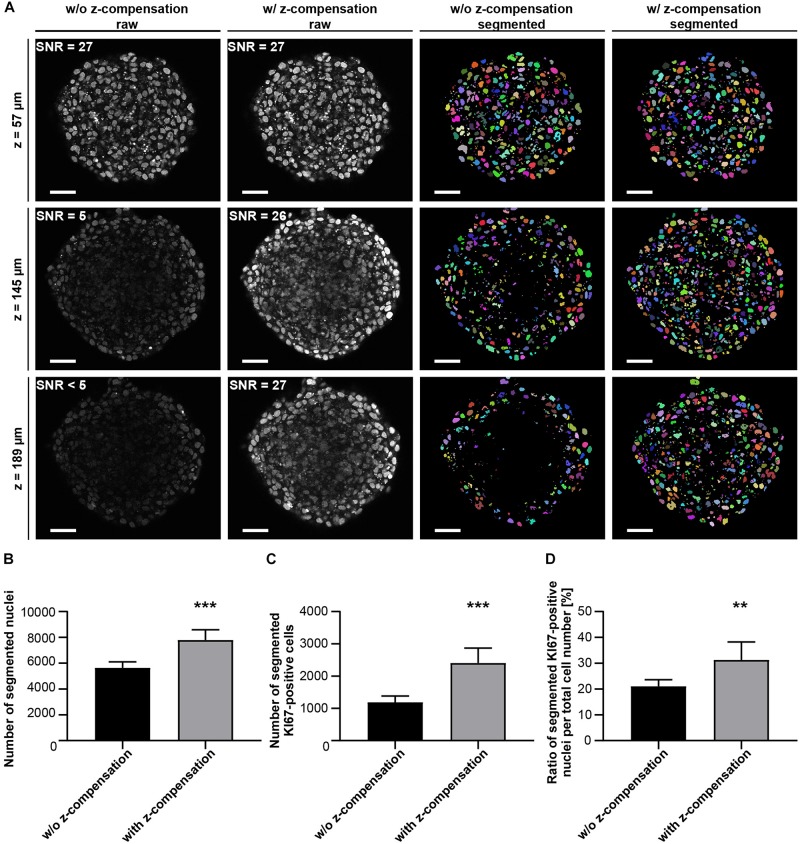
Three-dimensional cell cultures, such as spheroids and organoids, serve as increasingly important models in fundamental and applied research and start to be used for drug screening purposes. Optical tissue clearing procedures are employed to enhance visualization of fluorescence-stained organs, tissues, and three-dimensional cell cultures. To get a more systematic overview about the effects and applicability of optical tissue clearing on three-dimensional cell cultures, we compared six different clearing/embedding protocols on seven types of spheroid- and chip-based three-dimensional cell cultures of approximately 300 μm in size that were stained with nuclear dyes, immunofluorescence, cell trackers, and cyan fluorescent protein. Subsequent whole mount confocal microscopy and semi-automated image analysis were performed to quantify the effects. Quantitative analysis included fluorescence signal intensity and signal-to-noise ratio as a function of z-depth as well as segmentation and counting of nuclei and immunopositive cells. In general, these analyses revealed five key points, which largely confirmed current knowledge and were quantified in this study. First, there was a massive variability of effects of different clearing protocols on sample transparency and shrinkage as well as on dye quenching. Second, all tested clearing protocols worked more efficiently on samples prepared with one cell type than on co-cultures. Third, z-compensation was imperative to minimize variations in signal-to-noise ratio. Fourth, a combination of sample-inherent cell density, sample shrinkage, uniformity of signal-to-noise ratio, and image resolution had a strong impact on data segmentation, cell counts, and relative numbers of immunofluorescence-positive cells. Finally, considering all mentioned aspects and including a wish for simplicity and speed of protocols - in particular, for screening purposes - clearing with 88% Glycerol appeared to be the most promising option amongst the ones tested.

Keywords: glycerol; optical tissue clearing; organoid; spheroid; z-compensation.


Figures

FIGURE 1
FIGURE 1
Preservation of fluorescence signal intensity, sample volume and optical transparency is strongly dependent on optical clearing protocol. Upon growth to a diameter of approximately 300 μm, spheroids made of HaCaT keratinocytes were fixed, stained with anti-KI67 (green) and the nuclear dyes, DAPI (gray) and DRAQ5 (red), followed by optical tissue clearing or embedding as indicated and subsequent confocal whole mount microscopy. Images show representative top (Left panels for each staining) and orthogonal (Right panels for each staining) 3D volume projections of single and merged channels after corresponding clearing method. Scale bars, 50 μm.
FIGURE 2
FIGURE 2
Aqueous clearing methods and detergent-containing hyperhydration prevent massive post-fixation volume changes. Upon growth to a diameter of approximately 300 μm, spheroids made of HaCaT keratinocytes were fixed, stained with anti-KI67 and DRAQ5, followed by optical tissue clearing or embedding as indicated. Spheroid diameters were determined from brightfield images before and after fixation and from confocal microscopy stacks after staining. (A) Representative brightfield images of spheroids before and after fixation as well as maximum projections of confocal image stacks upon staining and clearing/embedding as indicated. In the confocal panels, DRAQ5 and KI67 fluorescence signals are shown in magenta and green, respectively. Scale bars, 100 μm. Quantitative analysis of average spheroid diameter (B) and change of average spheroid diameter relative to pre-fixation state (C). Graphs depict mean + standard deviation (SD); n ≥ 9; *p ≤ 0.05, ***p ≤ 0.001.
FIGURE 3
FIGURE 3
High-refractive index aqueous solutions or detergent-containing hyperhydration improve light penetration into spheroids. Upon growth to a diameter of approximately 300 μm, spheroids made of HaCaT keratinocytes were fixed, stained with anti-KI67, DAPI, and DRAQ5, followed by optical tissue clearing or embedding as indicated and subsequent confocal whole mount microscopy. (A,B) Depicted are single optical sections of spheroids at discrete z-depths with fixed intervals of 50 μm (A) or 25 μm (B). Each panel shows DAPI, DRAQ5, and KI67 fluorescence signals, as well as a merge. In merged panels DAPI is shown in blue, DRAQ5 in red, and KI67 in green. Colocalization of DAPI and DRAQ5 appears in magenta, additional colocalization with KI67 in green to white hues. Scale bars 50 μm.
FIGURE 4
FIGURE 4
Optical transparency, preservation of fluorescence signals and depth-dependent SNR are dependent on clearing method and cell line. Mono-culture spheroids of HaCaT cells were grown to approximately 300 μm diameter and then fixed. Upon staining of proliferating cells (anti-KI67) and nuclei (DAPI and DRAQ5), spheroids were embedded/cleared as indicated and then imaged in toto using confocal microscopy. Analysis of depth-dependent signal intensity of DAPI and DRAQ5 was performed by selecting one circular region of interest (ROI) per sample through the central region of the spheroid followed by mean intensity measurement throughout the entire stack depth. SNR values for DAPI and DRAQ5 were determined by measurement of mean intensity and standard deviation of background and nuclear signal via semi-automated thresholding. Then, SNR was calculated as the ratio of mean signal intensity in identified nuclear regions to the average standard deviation of background intensity (μSIGNALBACKGROUND). To account for volume-changing effects of individual clearing methods, all depth values were normalized by the method-dependent degree of swelling or shrinkage. (A,B) Graphs show mean intensities of DAPI and DRAQ5 as a function of normalized z-depth HaCaT spheroids. (C,D) Graphs show mean SNR values for staining with DAPI and DRAQ5 as a function of normalized z-depth for HaCaT spheroids. All mean values were calculated from n ≥ 7 spheroids per condition.
FIGURE 5
FIGURE 5
Optical clearing efficiency is affected by complexity of a spheroid-based tri-culture model. Melanoma tri-culture spheroids were generated starting with formation of a core spheroid of CCD-1337SK fibroblasts, followed after 72 h by simultaneous addition of HaCaT keratinocytes labeled with CellTracker Red and SK-MEL-28 melanoma cells marked with CellTracker Green. After another two days of cultivation, spheroids were fixed, stained with anti-KI67 and DAPI, and then embedded or cleared as indicated. Confocal 3D-imaging of whole spheroid cultures was performed. (A) Representative top and orthogonal 3D-volume projections of fluorescence signals (indicated) of a PBS-embedded spheroid are shown in upper and lower panels, respectively. In the merge, DAPI appears in blue, CellTracker Green in green, CellTracker Red in yellow, and KI67 in red. Scale bars, 50 μm. (B) Depicted are representative images of tri-culture spheroids after different types of embedding/clearing as indicated. Top and side view maximum projections are shown in upper and middle panels. Lower panels show single optical sections at 75 μm of imaging depth. Scale bars, 50 μm in upper and middle row, 100 μm in lower row. Quantitative analysis of mean signal intensity of DAPI and CellTracker Green (C) and SNR of DAPI signals (D) as a function of normalized depth. Mean of n = 10 spheroids per condition.
FIGURE 6
FIGURE 6
ECFP fluorescence is maintained by Glycerol-RI matching in a chip-based co-culture model of breast cancer cells and fibroblasts. ECFP-expressing MDA-MB-231 breast cancer cells were co-seeded with CellTracker Red labeled CCD-1337SK fibroblasts into Dynarray chips with 300 μm wide cavities. After 9 days of cultivation, chips were fixed, stained with anti-KI67 and DRAQ5, and then embedded or cleared as indicated. (A) Representative top and orthogonal 3D-volume projections of fluorescence signals (indicated) of Mowiol-embedded chip cavities are shown in upper and lower panels, respectively. In the merge, ECFP appears in cyan, CellTracker Red in yellow, KI67 in green, and DRAQ5 in red. Scale bars, 50 μm. (B) Depicted are representative images of chip cavities after different types of embedding/clearing as indicated. Top and side view maximum projections are shown in upper and middle panels. Lower panels show single optical sections at 75 μm of imaging depth. Scale bars, 50 μm in upper and middle row, 100 μm in lower row. (C,D) Quantitative analysis of mean signal intensity of ECFP, CellTracker Red, and DRAQ5 (C) and SNR of DRAQ5 signals (D) as a function of depth. Mean of n = 10 cavities per condition.
FIGURE 7
FIGURE 7
Optical clearing of HaCaT spheroids with Glycerol improves detection and quantification of cell nuclei. Upon growth to a diameter of approximately 300 μm, spheroids made of HaCaT keratinocytes were fixed, stained with anti-KI67 and DRAQ5, followed by optical tissue clearing or embedding as indicated and subsequent confocal whole mount microscopy. Semi-automated image segmentation was performed to detect and count KI67+ and DRAQ5+ nuclei. (A) Depicted are raw single optical sections and orthogonal views from central regions for both markers (KI67 – raw; DRAQ5 – raw) and corresponding segmented images (KI67 – segmented; DRAQ5 – segmented). In raw images, fluorescence signals of KI67 and DRAQ5 are shown in green and red, respectively. Different colors of segmented nuclei were used for better visual discrimination. Scale bars, 50 μm. B-C: Quantitative analysis of KI67+ (B) and Draq5+ nuclei (C) as a function of clearing/embedding protocol. Data show mean + SD; n ≥ 9; **p ≤ 0.01; ***p ≤ 0.001.
FIGURE 8
FIGURE 8
Z-profiles of signal intensity and SNR remain more stable upon z-compensation. Upon growth to a diameter of approximately 300 μm, spheroids made of HaCaT keratinocytes were fixed, stained with anti-KI67 and DRAQ5, followed by optical tissue clearing with Glycerol and subsequent confocal whole mount microscopy. (A) Depicted are orthogonal maximum projections (left three columns) and a clipped projection to visualize the spheroid core (right column) of the same spheroid imaged in the absence (upper panels) or presence of z-compensation (lower panels). In the left panels, fluorescence signals of KI67 and DRAQ5 are shown in green and red, respectively. The right panels show only DRAQ5 signals in gray. Scale bars, 50 μm. Graphical representations of z-profiles for DRAQ5 channel signal intensity (B) and SNR (C) in a z-extended column through the central region of the spheroid.
FIGURE 9
FIGURE 9
Z-compensation improves semi-automated segmentation of nuclei. Upon growth to a diameter of approximately 300 μm, spheroids made of HaCaT keratinocytes were fixed, stained with anti-KI67 and DRAQ5, followed by optical tissue clearing with Glycerol and subsequent confocal whole mount microscopy. (A) Depicted are single raw confocal images (left two columns) and corresponding segmented nuclei (right two columns) at different z-depths showing DRAQ5 signals in gray and segmented nuclei in different colors. The corresponding image stacks were taken in the absence or presence of z-compensation, as indicated. SNR values measured in the shown raw images are given in their upper left angles. Scale bars, 50 μm. Quantitative analysis of Draq5+ nuclei (B), KI67+ nuclei (C), and ratio of KI67+/DRAQ5+ nuclei (D) in the absence or presence of z-compensation. Data show mean + SD; n ≥ 9; **p ≤ 0.01; ***p ≤ 0.001.

Similar articles

Cited by

References

    1. Alepee N., Bahinski A., Daneshian M., De Wever B., Fritsche E., Goldberg A., et al. (2014). State-of-the-art of 3D cultures (organs-on-a-chip) in safety testing and pathophysiology. ALTEX 31 441–477. 10.14573/altex.1406111 - DOI - PMC - PubMed
    1. Ariel P. (2017). A beginner’s guide to tissue clearing. Int. J. Biochem. Cell Biol. 84 35–39. 10.1016/j.biocel.2016.12.009 - DOI - PMC - PubMed
    1. Bassel G. W. (2015). Accuracy in quantitative 3D image analysis. Plant Cell 27 950–953. 10.1105/tpc.114.135061 - DOI - PMC - PubMed
    1. Bauer S., Wennberg Huldt C., Kanebratt K. P., Durieux I., Gunne D., Andersson S., et al. (2018). Functional coupling of human pancreatic islets and liver spheroids on-a-chip: towards a novel human ex vivo type 2 diabetes model. Sci. Rep. 8:1672. 10.1038/s41598-017-14815-w - DOI - PMC - PubMed
    1. Berlanga M. L., Phan S., Bushong E. A., Wu S., Kwon O., Phung B. S., et al. (2011). Three-dimensional reconstruction of serial mouse brain sections: solution for flattening high-resolution large-scale mosaics. Front. Neuroanat. 5:17. 10.3389/fnana.2011.00017 - DOI - PMC - PubMed

LinkOut - more resources