Potential function of CbuSPL and gene encoding its interacting protein during flowering in Catalpa bungei
- PMID: 32143577
- PMCID: PMC7060540
- DOI: 10.1186/s12870-020-2303-z
Potential function of CbuSPL and gene encoding its interacting protein during flowering in Catalpa bungei
Abstract
Background: "Bairihua", a variety of the Catalpa bungei, has a large amount of flowers and a long flowering period which make it an excellent material for flowering researches in trees. SPL is one of the hub genes that regulate both flowering transition and development.
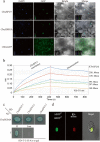
Results: SPL homologues CbuSPL9 was cloned using degenerate primers with RACE. Expression studies during flowering transition in "Bairihua" and ectopic expression in Arabidopsis showed that CbuSPL9 was functional similarly with its Arabidopsis homologues. In the next step, we used Y2H to identify the proteins that could interact with CbuSPL9. HMGA, an architectural transcriptional factor, was identified and cloned for further research. BiFC and BLI showed that CbuSPL9 could form a heterodimer with CbuHMGA in the nucleus. The expression analysis showed that CbuHMGA had a similar expression trend to that of CbuSPL9 during flowering in "Bairihua". Intriguingly, ectopic expression of CbuHMGA in Arabidopsis would lead to aberrant flowers, but did not effect flowering time.
Conclusions: Our results implied a novel pathway that CbuSPL9 regulated flowering development, but not flowering transition, with the participation of CbuHMGA. Further investments need to be done to verify the details of this pathway.
Keywords: Architectural transcriptional factor; Catalpa bungei; Flowering; HMGA; SPL.
Conflict of interest statement
The authors declare that they have no competing interests.
Figures


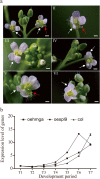
 represents the PCR results in oe-hmga;
  represents the PCR results in oespl9; and
  represents the PCR results in col. Three independent biological replicates were performed, and each replicate was measured in triplicate. The error bars show the standard deviation of the results of three technical replicates
Similar articles
-
Multi-omics sequencing provides insight into floral transition in Catalpa bungei. C.A. Mey.BMC Genomics. 2020 Jul 22;21(1):508. doi: 10.1186/s12864-020-06918-y. BMC Genomics. 2020. PMID: 32698759 Free PMC article.
-
Ectopic expression of a Catalpa bungei (Bignoniaceae) PISTILLATA homologue rescues the petal and stamen identities in Arabidopsis pi-1 mutant.Plant Sci. 2015 Feb;231:40-51. doi: 10.1016/j.plantsci.2014.11.004. Epub 2014 Nov 25. Plant Sci. 2015. PMID: 25575990
-
The Role of EjSPL3, EjSPL4, EjSPL5, and EjSPL9 in Regulating Flowering in Loquat (Eriobotrya japonica Lindl.).Int J Mol Sci. 2019 Dec 30;21(1):248. doi: 10.3390/ijms21010248. Int J Mol Sci. 2019. PMID: 31905863 Free PMC article.
-
Genome-wide analysis of long non-coding RNAs in Catalpa bungei and their potential function in floral transition using high-throughput sequencing.BMC Genet. 2018 Sep 20;19(1):86. doi: 10.1186/s12863-018-0671-2. BMC Genet. 2018. PMID: 30236060 Free PMC article.
-
Current progress in orchid flowering/flower development research.Plant Signal Behav. 2017 May 4;12(5):e1322245. doi: 10.1080/15592324.2017.1322245. Epub 2017 Apr 27. Plant Signal Behav. 2017. PMID: 28448202 Free PMC article. Review.
Cited by
-
Multi-omics sequencing provides insight into floral transition in Catalpa bungei. C.A. Mey.BMC Genomics. 2020 Jul 22;21(1):508. doi: 10.1186/s12864-020-06918-y. BMC Genomics. 2020. PMID: 32698759 Free PMC article.
-
Genome-Wide Identification and Expression Analysis of the SQUAMOSA Promoter-Binding Protein-like (SPL) Transcription Factor Family in Catalpabungei.Int J Mol Sci. 2023 Dec 20;25(1):97. doi: 10.3390/ijms25010097. Int J Mol Sci. 2023. PMID: 38203267 Free PMC article.
-
Molecular identification and functional verification of SPL9 and SPL15 of Lilium.Mol Genet Genomics. 2022 Jan;297(1):63-74. doi: 10.1007/s00438-021-01832-8. Epub 2021 Nov 15. Mol Genet Genomics. 2022. PMID: 34779936
-
In Vitro Analytical Approaches to Study Plant Ligand-Receptor Interactions.Plant Physiol. 2020 Apr;182(4):1697-1712. doi: 10.1104/pp.19.01396. Epub 2020 Feb 7. Plant Physiol. 2020. PMID: 32034053 Free PMC article. Review.
-
TaSPL6B, a member of the Squamosa promoter binding protein-like family, regulates shoot branching and florescence in Arabidopsis thaliana.BMC Plant Biol. 2024 Jul 25;24(1):708. doi: 10.1186/s12870-024-05429-2. BMC Plant Biol. 2024. PMID: 39054432 Free PMC article.
References
MeSH terms
Substances
Grants and funding
LinkOut - more resources
Full Text Sources

