. 2020 Mar 16;37(3):387-402.e7.
doi: 10.1016/j.ccell.2020.02.003. Epub 2020 Mar 5.

Neurofibromin Is an Estrogen Receptor-α Transcriptional Co-repressor in Breast Cancer

Affiliations

Neurofibromin Is an Estrogen Receptor-α Transcriptional Co-repressor in Breast Cancer

Ze-Yi Zheng et al. Cancer Cell. .

Abstract

We report that neurofibromin, a tumor suppressor and Ras-GAP (GTPase-activating protein), is also an estrogen receptor-α (ER) transcriptional co-repressor through leucine/isoleucine-rich motifs that are functionally independent of GAP activity. GAP activity, in turn, does not affect ER binding. Consequently, neurofibromin depletion causes estradiol hypersensitivity and tamoxifen agonism, explaining the poor prognosis associated with neurofibromin loss in endocrine therapy-treated ER+ breast cancer. Neurofibromin-deficient ER+ breast cancer cells initially retain sensitivity to selective ER degraders (SERDs). However, Ras activation does play a role in acquired SERD resistance, which can be reversed upon MEK inhibitor addition, and SERD/MEK inhibitor combinations induce tumor regression. Thus, neurofibromin is a dual repressor for both Ras and ER signaling, and co-targeting may treat neurofibromin-deficient ER+ breast tumors.

Keywords: Drosophila; GTPase; NF1; RAS; breast cancer; co-regulator; endocrine therapy; estrogen receptor; neurofibromatosis; yeast.


Conflict of interest statement

Declaration of Interests K.C.B. and R.B.L. are stockholders and employees of Guardant Health, Inc., C.E.F. discloses an equity position in Coactigon, Inc., and M.J.E. received consulting fees from Abbvie, Sermonix, Pfizer, AstraZeneca, Celgene, NanoString, Puma, and Novartis, and is an equity stockholder, consultant, and Board Director member of BioClassifier, and inventor on a patent for the Breast PAM50 assay.

Figures
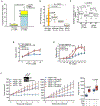
Figure 1.
Figure 1.. NF1 loss promotes tamoxifen agonism and E2 hypersensitivity leading to poor patient outcome in ER+ breast cancer.
A. The percentages of ER+ primary vs. metastatic breast cancers carrying NF1 mutations were analyzed by Fisher Exact test. NS and FS stand for nonsense and frameshift, respectively. The number of patients carrying a particular type of NF1 mutation is shown at the upper left side of each column. B. Boxplot analysis of NF1 mRNA levels in ER+ breast tumors carrying different NF1 mutations in the RNA-seq database of TCGA. P value by Wilcoxon rank sum test. The line in the middle of the box is the median. The box edges are the 25th and 75th percentiles and the whiskers denote 1.5 times the inter-quartile range. C. Patient samples were stratified by NF1 mRNA levels according to TCGA definitions of high vs. low expression (mean – 1.5 × SD). The boxplot analysis was similarly performed as in (B) to compare multigene proliferation score (MGPS) in tumors before treatment (BT) and on treatment (OT) with AI. The differences in MGPS before and during treatment in each NF1 group were analyzed by the Wilcoxon signed-rank test. The differences in MGPS as a result of treatment between the two NF1 groups were further analyzed by Wilcoxon rank sum test. D. DOX-inducible gene silencing using NF1 shRNA clone C5 and CRISPR-mediated NF1-KO were performed in MCF-7 cells. These cells were seeded in E2-deprived medium, to which 4-OHT was added, and cultured for 6 days. Cell numbers relative to vehicle control are plotted. Experiments were conducted as biological triplicates (n = 3 experiments), except for MCF-7 cells carrying NF1 shRNA C5 (n = 8 experiments). E. Cell growth in response to E2 was similarly analyzed as in (D). n = 3 experiments, except for MCF-7 cells carrying NF1 shRNA C5 (n = 8 experiments). F. MCF-7 cells carrying DOX-inducible NF1 shRNA were transplanted into the mammary fat pads of ovariectomized nude mice, supplemented by an E2-capsule. When tumors appeared, the original E2-capsule was removed, and the resulting mice were randomized, DOX or vehicle treated. Each set was then treated by either tamoxifen (5 mg/mouse, left), or E2 (at two doses, middle). For NF1+ (−DOX) tumors, n=10, 12, 12, and 8 mice per group for treatment of vehicle, 0.05 mg E2, 0.5 mg E2, and tamoxifen; for NF1KD (+DOX) tumors, n = 10, 13, 11, and 8 mice per group. The inset shows NF1-silencing validation by qPCR 2 weeks post-DOX addition. Data are reported as mean±SEM. On the far right, “Δ tumor volumes” between vehicle and either tamoxifen or E2 treated were analyzed by box plot as in (C). *p<0.05, **p<0.01 by pair-wise two-tailed Student’s t-test, unless otherwise indicated. See also Figure S1 and Tables S1 and S2.
Figure 2.
Figure 2.. NF1-depletion globally enhances ER transcriptional activity.
A. RNA-seq was performed on NF1+ or NF1KD MCF-7 cells treated with E2 or vehicle. A Venn diagram depicts the number of E2-mediated differentially expressed genes in NF1+ (red), NF1KD cells (blue), and those that overlap (“common E2-regulon,” purple). The common E2-regulon genes identified in NF1+ and NF1KD cells were ranked by (Log2) fold-change in gene expression, and enrichment for Hallmark Pathways by GSEA is shown to the right (red line marks an FDR cutoff at 0.05). GSEA analysis was also performed to examine Hallmark Pathways selectively enriched in NF1KD cells (“NF1KD unique E2-regulon”). B. Genes identified in (A) were examined in the TCGA and METABRIC ER+ breast cancer cases to identify those genes that are differentially expressed between tumors with wild-type NF1 and NF1 frameshift/nonsense mutations. The enriched Hallmark Pathways in the patient data are presented along with the results of the two E2-regulons identified in MCF-7 cells. C. ER was immunoprecipitated from cross-linked NF1+ or NF1KD MCF-7 cells treated by E2 or vehicle, and ChIP-qPCR was performed to measure ER occupancy at ten ERE sites in six genes. Two previous known ERE-negative regions (Carroll et al., 2005; Carroll et al., 2006) were assessed as negative controls. n = 2 ChIP experiments. D. ER ChIP-qPCR fold-enrichment values from all ERE sites examined in (C) were averaged and compared in NF1+ vs. NF1KD (+DOX) cells seeded with or without added E2 (n=10 sites). *p<0.05, **p<0.01, and ***p<0.001 by pair-wise two-tailed Student’s t-test. See also Figure S2 and Tables S3 and S4.
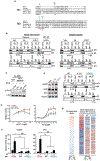
Figure 3.
Figure 3.. Neurofibromin binding to ER is selectively mediated by co-repressor motifs.
A. Protein alignment was created by ClustalW (MUSCLE). NF1 has two potential co-repressor motifs, M1 and M2 (potential consensus sequences shown at the bottom). Mutations found in cancers (COSMIC) or neurofibromatosis are colored blue, and the numbers in parentheses are the number of times found in the COSMIC database. B. Parental MCF-7 or the NF1-KO (clone #1) MCF-7 cells were grown in E2-deprived medium to which E2, 4-OHT, or vehicle was added. Whole cell or nuclear extracts were immunoprecipitated with NF1 or ER antibody, and the resulting samples were analyzed by immunoblotting. The number below the blot shows the percentage of co-immunoprecipitated protein. C. Recombinant purified ER-α preincubated with E2, 4-OHT, or vehicle was pulled-down by amylose beads containing His-MBP-tagged NF1-M2/GAP domain, or His-MBP-GST control, and the results were analyzed by immunoblotting. D. Left, whole cell lysates from parental MCF-7 cells (WT) or from a CRISPR “knock-in” mutant carrying either a I417M (colored red) or a R1362Q (colored blue) mutation grown in full-serum medium were examined by immunoblotting to measure the pERK/total ERK ratios (below). Right, reciprocal co-immunoprecipitation experiments in the presence of 4-OHT similar to those in (B) assessed ER binding to various NF1 proteins. E. Parental or NF1 mutant cells were seeded in E2-deprived medium and were examined for cell growth in response to E2 or 4-OHT (6 days later) n=3 experiments. F. GREB1 and TFF1 mRNA levels from parental or NF1 mutant cells treated with vehicle or E2 were measured by qPCR (n = 3 independent experiments). Expression levels were normalized to those of vehicle-treated wild-type cells. Data are reported as mean±SEM. *p<0.05, **p<0.01 by pair-wise two-tailed Student’s t-test. NS, not significant. G. mRNAs from cells seeded in charcoal-stripped serum were analyzed by RNA-seq. “E2-responsive genes” as defined in Figure 2A is shown on the left to which expression levels of genes (row Z-scores from “Log2 Transcripts per Million” values) in various strains were aligned. See also Figure S3 and Table S5.
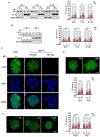
Figure 4.
Figure 4.. ER ligand-mediated nuclear accumulation of neurofibromin.
A. Left, whole cell lysates from indicated cell lines treated with LMB were separated into nuclear (Nu.) and cytoplasmic (Cyt.) fractions. NF1, histone-3 (His. 3, nuclear marker), and GAPDH (cytoplasmic marker) were examined by immunoblotting. Right, NF1 levels in the cytoplasmic fraction (light blue) and the nuclear fraction (red) were normalized to GAPDH and His.−3, respectively, and the sum of these two fractions is defined as total NF1 (100%). The numbers in the graph represent the percentages of NF1 determined to be nuclear. The pair-wise comparisons were between NF1 nuclear fractions. n = 2 experiments. B. Left, Cells after ligand stimulation were similarly analyzed as in (A) and an immunoblot of treated MCF-7 cells is shown as an example. n = 3 experiments. C. Immuno-fluorescence deconvolution microscopy was performed using our monoclonal NF1 antibody on cells with varying levels of NF1 protein. A single focal plane across the middle of the nucleus (marked by DAPI) is shown. D. Cells treated with LMB were examined by microscopy. NF1 nuclear fractions were quantified in the indicated number of cells. E. Cells after treatment with ER-ligands were similarly examined by microscopy and quantified. Scale bars = 20 μm. Data are reported as mean±SEM. *p<0.05, **p<0.01, ***p<0.001 by pair-wise two-tailed Student’s t-test. See also Figure S4.
Figure 5.
Figure 5.. Ligand-dependent association of neurofibromin with the ER-ERE complex.
A. Ligands were added to the HeLa nuclear extract together with purified ER and biotinylated EREs immobilized onto streptavidin beads. After washing, the proteins bound to EREs with ER were analyzed by immunoblotting (left) and quantified (right). n = 4 experiments. B. ChIP-qPCR experiment was performed using NF1 antibody Ab-2 to assess NF1 occupancy at the EREs in GREB1 (Region 2, Figure 2C) or TFF1 (Region 1, Figure 2C) in parental or NF1-KO (clone 1) MCF-7 cells treated with 4-OHT. An ERE-negative region (site 2) (Carroll et al., 2006) was also analyzed as negative control. n = 2 experiments. C. NF1 occupancy in MCF-7 cells at ten ERE sites in six genes and two negative control regions was assessed by qPCR (n=3 separate ChIP experiments). Data are reported as mean±SEM. *p<0.05, **p<0.01, ***p<0.001 by pair-wise two-tailed Student’s t-test. NS, not significant. See also Figure S5.
Figure 6.
Figure 6.. Co-targeting Ras and ER to treat NF1-deficient ER+ breast cancer.
A. MCF-7 cells were seeded in 10−11 M E2 to which fulvestrant (F), dabrafenib (D), trametinib (T) or selumetinib (S) were subsequently added at 10−9, 10−6, 10−7 or 10−6 M, respectively. After 6 days, proteins were measured by immunoblotting, and phosphorylation levels (as defined by the levels of the phosphorylated form over total protein) relative to the vehicle-treated cells were set to 1. ND, not detectable. B. Top: cells were grown for 6 days in the presence of 10−11 M E2 and 10−9 M fulvestrant, to which increasing concentration of selumetinib was added. Cell numbers relative to the vehicle control are plotted. n = 3 experiments. Bottom: the cells were treated similarly except 10−6 M selumetinib was used, and apoptosis was measured 6 days post-treatment. n = 2 experiments. C. WHIM16 tumors were transplanted into cleared mammary fat pad of mice and later randomized to receive treatment (n=15 per treatment arm) when tumor volumes reached 200 mm3. Tumor volume comparison was performed at 52 days post-treatment by t-test between indicated treatment groups, and at the same time, binimetinib (B) was added to the fulvestrant-only arm (marked by the black arrow). After 84 days (grey arrow), treatments were withdrawn from all treatment groups expect the group receiving late binimetinib after initial fulvestrant monotherapy. D. WHIM16 tumors from each treatment arm at week-4 post-treatment in (C) were analyzed by immunoblot (one representative tumor shown on the left), and the results relative to those treated by the vehicle control were quantified on the right (n = 3 tumors). E. qPCR was performed to analyze expression levels of indicated genes from the same tumor samples as in (D). mRNA levels in vehicle-treated samples were set to 1. Data are reported as mean±SEM. *p<0.05, **p<0.01 by t-test. NS, not significant.

Similar articles

Cited by

References

    1. Anbalagan M, and Rowan BG (2015). Estrogen receptor alpha phosphorylation and its functional impact in human breast cancer. Mol Cell Endocrinol 418 Pt 3, 264–272. - PubMed
    1. Ballester R, Marchuk D, Boguski M, Saulino A, Letcher R, Wigler M, and Collins F (1990). The NF1 locus encodes a protein functionally related to mammalian GAP and yeast IRA proteins. Cell 63, 851–859. - PubMed
    1. Beausoleil SA, Jedrychowski M, Schwartz D, Elias JE, Villen J, Li J, Cohn MA, Cantley LC, and Gygi SP (2004). Large-scale characterization of HeLa cell nuclear phosphoproteins. Proc Natl Acad Sci U S A 101, 12130–12135. - PMC - PubMed
    1. Berto M, Jean V, Zwart W, and Picard D (2018). ERalpha activity depends on interaction and target site corecruitment with phosphorylated CREB1. Life Sci Alliance 1, e201800055. - PMC - PubMed
    1. Bertucci F, Ng CKY, Patsouris A, Droin N, Piscuoglio S, Carbuccia N, Soria JC, Dien AT, Adnani Y, Kamal M, et al. (2019). Genomic characterization of metastatic breast cancers. Nature 569, 560–564. - PubMed

Publication types

MeSH terms