. 2020 Mar 5;3(1):101.
doi: 10.1038/s42003-020-0804-9.

Transcriptomic signatures of brain regional vulnerability to Parkinson's disease

Affiliations

Transcriptomic signatures of brain regional vulnerability to Parkinson's disease

Arlin Keo et al. Commun Biol. .

Abstract

The molecular mechanisms underlying caudal-to-rostral progression of Lewy body pathology in Parkinson's disease remain poorly understood. Here, we identified transcriptomic signatures across brain regions involved in Braak Lewy body stages in non-neurological adults from the Allen Human Brain Atlas. Among the genes that are indicative of regional vulnerability, we found known genetic risk factors for Parkinson's disease: SCARB2, ELOVL7, SH3GL2, SNCA, BAP1, and ZNF184. Results were confirmed in two datasets of non-neurological subjects, while in two datasets of Parkinson's disease patients we found altered expression patterns. Co-expression analysis across vulnerable regions identified a module enriched for genes associated with dopamine synthesis and microglia, and another module related to the immune system, blood-oxygen transport, and endothelial cells. Both were highly expressed in regions involved in the preclinical stages of the disease. Finally, alterations in genes underlying these region-specific functions may contribute to the selective regional vulnerability in Parkinson's disease brains.


Conflict of interest statement

The authors declare no competing interests.

Figures

Fig. 1
Fig. 1. Study overview.
Differential vulnerability to Parkinson’s disease (PD) was examined across brain regions R1–R6 (image credit: Allen Institute). N is the number of samples across all six non-neurological donors from the Allen Human Brain Atlas (AHBA), which are involved in the six PD Braak stages as they sequentially accumulate Lewy bodies during disease progression (Supplementary Table 1 and Supplementary Fig. 1). Through correlation and differential expression analysis, we identified Braak stage-related genes (BRGs) with expression patterns that are either positively (r > 0) or negatively (r < 0) correlated with Braak stages in the non-neurological brain. These were validated in cohorts of non-neurological individuals and subsequently in PD patients and age-matched controls. To obtain a more global view of BRG expression signatures, we focused on co-expression modules of all genes and correlated the module eigengene expression with Braak stages. The resulting modules of genes were subsequently analyzed to detect common biologically meaningful pathways.
Fig. 2
Fig. 2. Expression patterns of Braak stage-related genes (BRGs) across brain regions of non-neurological, incidental Lewy body disease (iLBD) and Parkinson’s disease (PD) brains.
a Selection of BRGs that were either negatively (blue; r < 0) or positively (red; r > 0) correlated with Braak stages. Genes were selected based on (1) highest absolute correlation (|r|) of gene expression and Braak stage labels, (2) highest absolute fold-change (FC) between R1 and R6, and (3) lowest P-value of FC in the differential expression analysis (BH-corrected PFC), for which the top 10% (2001) genes resulted in the shown thresholds. The overlap between the three sets of top 10% genes resulted in 960 BRGs. b Correlation r of BRGs (red and blue points) with Braak stages (x-axis) and –log10 BH-corrected P-value (y-axis). c Mean expression of BRGs for each region (colors) and donor (opacity) in the AHBA (number of samples in Supplementary Table 1). d Validation across 134 non-neurological individuals in UK Brain Expression Consortium (UKBEC; R1: medulla, R3: substantia nigra, R5: temporal cortex, R6: frontal cortex), and e 88–129 non-neurological individuals in Genotype-Tissue Expression Consortium (GTEx; R3: substantia nigra, R4: amygdala, R5: anterior cingulate cortex, R6: frontal cortex). Each data point is a sample with the mean expression of negatively or positively correlated BRGs. f Validation in PD microarray dataset (R1: medulla oblongata, R2: locus coeruleus, R3: substantia nigra; number of samples in Supplementary Table 2) and g PD RNA-seq dataset (R3: substantia nigra, R4/R5: medial temporal gyrus; number of samples in Supplementary Table 3). Boxplots (f, g) are shown per patient group (PD, iLBD, and control) and per brain region (Supplementary Fig. 5). The boxplots indicate the median and interquartile range (25th and 75th percentiles) with whiskers indicating 1.5 times the interquartile range; outliers beyond the whiskers are plotted individually.
Fig. 3
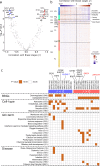
Fig. 3. Braak co-expression modules.
Genes were analyzed for co-expression across regions R1–R6 in the Allen Human Brain Atlas. a Module eigengene correlation with Braak stages. Each point reflects a module showing its correlation r with Braak stages (x-axis) and −log10-transformed P-values (BH-corrected; y-axis); 23 significant modules (BH-corrected P < 0.0001, t-test) were selected for further analysis (blue and red points). b Eigengene expression of all 167 modules across brain regions (rows) of donor 9861 sorted by their correlation with Braak stages (column colors). The vertical line separates negatively and positively correlated modules, and correlations are shown for two modules with the lowest and highest correlation. Brain regions involved in Braak includes the following anatomical structures: myelencephalon (MY), pontine tegmentum (PTg), substantia nigra (SN), CA2-field (CA2), basal nucleus of Meynert (nbM), amygdala (Amg), occipito-temporal gyrus (OTG), temporal lobe (TL), cingulate gyrus (CgG), parietal lobe (PL), and frontal lobe (FL). Modules were low expressed in the arcuate nucleus of medulla, locus coeruleus and CA2-field, independently of their correlation with Braak stages (Supplementary Fig. 7). c Significant modules were sorted based on their correlation with Braak stages (columns) and assessed for significant overlap with Braak stage-related genes (BRGs), cell-type markers, and gene sets associated with functional GO-terms or diseases (brown squares, BH-corrected P < 0.05, hypergeometric test). The number of genes within each module and tested gene set is given between brackets. Additionally, these modules revealed the presence of genes associated with Parkinson’s disease variants (annotated at the top) that have (blue and red) or have not (black) been identified as BRGs. A full version of this table showing all significant associations is given in Supplementary Fig. 10.
Fig. 4
Fig. 4. Differential expression of neuronal marker ADCY1 in the AHBA corrected for cell-type abundance.
ADCY1 is a neuronal marker identified as one of the 960 Braak stage-related genes (BRGs). We found it was still significantly differentially expressed between samples from region R1 (black) and R6 (red) when correcting for one of the five main cell-types with PSEA (BH-corrected P < 0.05, t-test). Significant BH-corrected P-values are highlighted in red text together with cell-type specific fold-changes (FC; slope change of red line).
Fig. 5
Fig. 5. SNCA expression in Braak stage-related regions R1–R6 of non-neurological individuals and Parkinson’s disease (PD) patients.
a Boxplots of SNCA expression in regions R1–R6 (colored) for each donor (opacity) in the AHBA (number of samples in Supplementary Table 1). Meta-analysis of b SNCA correlation with Braak stages and c SNCA expression fold-change (FC) between region R1 and R6 across the six donors in the AHBA. To calculate the summary effect size (orange diamonds) from the individual effect sizes (turquoise squares), the 95% confidence intervals (CI) and weights are taken into account. The positive correlation with Braak stages was validated in datasets from two healthy cohorts, d UK Brain Expression Consortium (UKBEC; 134 donors) and e Genotype-Tissue Expression Consortium (GTEx; 88-129 donors), and f, g two PD cohorts with PD patients, incidental Lewy body disease (iLBD) patients, and non-demented age-matched controls (number of samples in Supplementary Tables 2 and 3). In the PD datasets, SNCA expression was tested for differential expression between regions and conditions (red, BH-corrected P < 0.05, t-test and DESeq2, respectively). The boxplots indicate the median and interquartile range (25th and 75th percentiles) with whiskers indicating 1.5 times the interquartile range; outliers beyond the whiskers are plotted individually. h SNCA was still significantly differentially expressed between region R1 (black) and R6 (red) when correcting for five main cell-types with PSEA in the AHBA (BH-corrected P < 0.05, t-test). Significant BH-corrected P-values are highlighted in red together with cell-type specific fold-changes (slope change of red line). PSEA results for PD data are shown in Supplementary Fig. 13.
Fig. 6
Fig. 6. Schematic overview of molecular activity of dopaminergic genes in module M127 and SNCA across brain regions of the Braak staging scheme.
Lines across regions R1–R6 were based on transcriptomic data from the Allen Human Brain Atlas (Fig. 1 and Supplementary Fig. 14). Expression of module M127 is in the eigengene space. Genes showed peak activity in region R3 that includes the substantia nigra, basal nucleus of Meynert, and CA2-field. While SNCA was generally high expressed in all regions, dopaminergic genes in M127 were low or not expressed in other regions than R3. SNCA: responsible for dopamine release, GCH1: together with TH required for production of dopamine, TH: catalyzes tyrosine to the dopamine precursor L-3,4-dihydroxyphenylalanine (L-DOPA), SLC6A3 (also known as DAT): transports dopamine from the synaptic cleft back to the cytosol, SLC18A2 (also known as VMAT2): stores dopamine into synaptic vesicles.

Similar articles

Cited by

References

    1. Braak H, et al. Staging of brain pathology related to sporadic Parkinson’s disease. Neurobiol. Aging. 2003;24:197–211. doi: 10.1016/S0197-4580(02)00065-9. - DOI - PubMed
    1. Surmeier DJ, Obeso JA, Halliday GM. Selective neuronal vulnerability in Parkinson disease. Nat. Rev. Neurosci. 2016;3:973–982. - PMC - PubMed
    1. Borghammer P. How does parkinson’s disease begin? Perspectives on neuroanatomical pathways, prions, and histology. Mov. Disord. 2018;33:48–57. doi: 10.1002/mds.27138. - DOI - PubMed
    1. Chartier-Harlin M-C, et al. α-synuclein locus duplication as a cause of familial Parkinson’s disease. Lancet. 2004;364:1167–1169. doi: 10.1016/S0140-6736(04)17103-1. - DOI - PubMed
    1. Singleton AB, et al. α-Synuclein Locus Triplication Causes Parkinson’s Disease. Science. 2003;302:841. doi: 10.1126/science.1090278. - DOI - PubMed

Publication types

MeSH terms