. 2020 May 4;94(10):e00196-20.
doi: 10.1128/JVI.00196-20. Print 2020 May 4.

Pseudorabies Virus Infection of Epithelial Cells Leads to Persistent but Aberrant Activation of the NF-κB Pathway, Inhibiting Hallmark NF-κB-Induced Proinflammatory Gene Expression

Affiliations

Pseudorabies Virus Infection of Epithelial Cells Leads to Persistent but Aberrant Activation of the NF-κB Pathway, Inhibiting Hallmark NF-κB-Induced Proinflammatory Gene Expression

Nicolás Romero et al. J Virol. .

Abstract

The nuclear factor kappa B (NF-κB) is a potent transcription factor, activation of which typically results in robust proinflammatory signaling and triggering of fast negative feedback modulators to avoid excessive inflammatory responses. Here, we report that infection of epithelial cells, including primary porcine respiratory epithelial cells, with the porcine alphaherpesvirus pseudorabies virus (PRV) results in the gradual and persistent activation of NF-κB, illustrated by proteasome-dependent degradation of the inhibitory NF-κB regulator IκB and nuclear translocation and phosphorylation of the NF-κB subunit p65. PRV-induced persistent activation of NF-κB does not result in expression of negative feedback loop genes, like the gene for IκBα or A20, and does not trigger expression of prototypical proinflammatory genes, like the gene for tumor necrosis factor alpha (TNF-α) or interleukin-6 (IL-6). In addition, PRV infection inhibits TNF-α-induced canonical NF-κB activation. Hence, PRV infection triggers persistent NF-κB activation in an unorthodox way and dramatically modulates the NF-κB signaling axis, preventing typical proinflammatory gene expression and the responsiveness of cells to canonical NF-κB signaling, which may aid the virus in modulating early proinflammatory responses in the infected host.IMPORTANCE The NF-κB transcription factor is activated via different key inflammatory pathways and typically results in the fast expression of several proinflammatory genes as well as negative feedback loop genes to prevent excessive inflammation. In the current report, we describe that infection of cells with the porcine alphaherpesvirus pseudorabies virus (PRV) triggers a gradual and persistent aberrant activation of NF-κB, which does not result in expression of hallmark proinflammatory or negative feedback loop genes. In addition, although PRV-induced NF-κB activation shares some mechanistic features with canonical NF-κB activation, it also shows remarkable differences; e.g., it is largely independent of the canonical IκB kinase (IKK) and even renders infected cells resistant to canonical NF-κB activation by the inflammatory cytokine TNF-α. Aberrant PRV-induced NF-κB activation may therefore paradoxically serve as a viral immune evasion strategy and may represent an important tool to unravel currently unknown mechanisms and consequences of NF-κB activation.

Keywords: NF-κB; evasion; herpes; innate; pseudorabies virus.


Figures

FIG 1
FIG 1
(A) Western blot analysis of IκBα protein levels at different time points posttreatment of ST cells with porcine TNF-α (100 ng/ml). (B) Western blot analysis of IκBα protein levels at different time points postinoculation of ST cells with PRV strain Kaplan (MOI, 10 PFU/cell). (C) Western blot analysis of IκBα protein levels in ST cells at 8 hpi with PRV strain Kaplan, Becker, or NIA-3 (MOI, 10 PFU/cell). (D) Western blot analysis of IκBα protein levels at different time points postinoculation of ST cells with PRV strain Kaplan (MOI, 10 PFU/cell). For each panel, representative blots out of three independent repeats are shown.
FIG 2
FIG 2
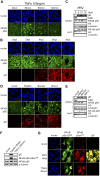
(A) Confocal microscopy of NF-κB p65 at different time points posttreatment of ST cells with porcine TNF-α (100 ng/ml). NF-κB p65 is shown in green, and nuclei are shown in blue. Bar, 50 μm. (B) Confocal microscopy of NF-κB p65 at different time points postinoculation of ST cells with PRV strain Kaplan (MOI, 10 PFU/cell). NF-κB p65 is shown in green, PRV gD is shown in red, and cell nuclei are shown in blue. Bar, 50 μm. (C) Western blot analysis of NF-κB p65 in the nuclear (nucl.) and cytoplasmic (cytopl.) fractions of PRV Kaplan-infected ST cells at 8, 12, and 16 hpi (MOI, 10 PFU/cell). Histone 3 (H3) and α-tubulin served as nuclear and cytoplasmic reference markers, respectively. (D) Confocal microscopy of NF-κB p65 in ST cells at 8 hpi with PRV strain Kaplan, Becker, or NIA-3 (MOI, 10 PFU/cell). NF-κB p65 is shown in green, PRV gD is shown in red, and nuclei are shown in blue. Bar, 50 μm. (E) Western blot analysis of NF-κB p65 in the nuclear and cytoplasmic fractions of ST cells at 8 hpi with PRV strain Kaplan, Becker, or NIA-3 (MOI, 10 PFU/cell). Histone 3 (H3) and α-tubulin served as nuclear and cytoplasmic markers, respectively. (F) Western blot analysis of total NF-κB p65 and phospho-Ser536-NF-κB p65 in mock-infected, PRV Kaplan-infected (8 hpi; MOI, 10 PFU/cell), and TNF-α-stimulated (30 min, 100 ng/ml) ST cells. (G) Confocal microscopy of ST cells transfected with GFP-p65 and subsequently infected with PRV Kaplan (8 hpi; MOI, 10 PFU/cell) or treated with TNF-α (30 min, 100 ng/ml) or left untreated and uninfected (mock). NF-κB p65-GFP is shown in green, phospho-Ser536-NF-κB p65 is shown in red, gB is shown in yellow, and nuclei are shown in blue. Bar, 50 μm. The confocal images and Western blots shown in this figure are representative examples from three independent repeats of the experiments.
FIG 3
FIG 3
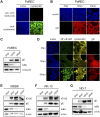
(A) Confocal microscopy of cytokeratin staining (and the corresponding secondary [sec.] antibody negative control) in tracheal porcine respiratory epithelial cells (PoRECs). Cytokeratin is shown in green, and nuclei are shown in blue. Bar, 50 μm. (B) Confocal microscopy of PRV gD expression in PoRECs infected with PRV Kaplan at 12 and 24 hpi (MOI, 10 PFU/cell; apical inoculation). PRV gD is shown in red, and nuclei are shown in blue. Bar, 50 μm. (C) Western blot analysis of IκBα in PRV Kaplan-infected PoRECs at 0, 12, and 24 hpi (MOI, 10 PFU/cell; apical inoculation). (D) Confocal microscopy of NF-κB p65 in PoRECs infected with PRV Kaplan at 0, 12, and 24 hpi (MOI, 10 PFU/cell; apical inoculation). NF-κB p65 is shown in green, cytokeratin is shown in yellow, gD is shown in red, and nuclei are shown in blue. Bar, 50 μm. The images in panels A to D are representative examples of the results obtained on PoRECs isolated from five different piglets. (E) Western blot analysis of IκBα in PRV Kaplan-infected bovine MDBK cells at 0, 4, 8, and 12 hpi (MOI, 10 PFU/cell). (F) Western blot analysis of IκBα in PRV Kaplan-infected rabbit kidney 13 (RK-13) cells at 0, 4, 8, and 12 hpi (MOI, 10 PFU/cell). (G) Western blot analysis of IκBα in PRV Kaplan-infected rat ND-7 cells at 0, 8, 16, and 24 hpi (MOI, 10 PFU/cell). The Western blots shown in panels E to G are representative examples from three independent repeats of the experiments.
FIG 4
FIG 4
(A and B) Western blot analysis of IκBα in PRV Kaplan-infected ST cells at 8 hpi (A) and 24 hpi (B) using an MOI of 0.1, 0.3, 1, 3, and 10 PFU/cell. (C) Western blot analysis of IκBα in ST cells infected with either PRV Kaplan or UV-inactivated PRV Kaplan at 8 hpi (MOI, 10 PFU/cell). (D) Western blot analysis of IκBα in PRV-infected ST cells (MOI, 10 PFU/cell) treated or not treated with phosphonoacetic acid (PAA; 200 or 400 μg/ml) from 30 min prior to infection onwards and collected at 4, 6, and 8 hpi. As a control for successful PAA treatment, expression of US3 (early [E]) and gE (late [L]) was analyzed. (E) Western blot analysis of IκBα in PRV-infected ST cells (MOI, 10 PFU/cell; 8 hpi) untreated or treated with PAA (400 μg/ml) starting at 30 min before inoculation or starting at 1, 2, 3, 4, and 6 hpi. All samples were analyzed at 8 hpi. As a control for successful PAA treatment, expression of IE180 (immediate early [IE]), US3 (E), and gE, gD, and gC (L) were analyzed. The Western blots shown are representative examples from three independent repeats of the experiments.
FIG 5
FIG 5
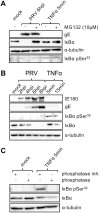
(A) Western blot analysis of total IκBα and IκBα phosphorylated at serine 32 (pSer32) either in PRV Kaplan-infected ST cells (6 hpi; MOI, 10 PFU/cell) or in TNF-α-treated ST cells (5 min posttreatment, 100 ng/ml) in the presence or absence of the proteasome inhibitor MG132 (10 μM; which was added for 4 h starting at 2 hpi in PRV-infected cells and which was used for preincubation for 4 h in TNF-α-stimulated cells). (B) Western blot analysis of total IκBα and IκBα phosphorylated at serine 32 either in PRV Kaplan-infected ST cells (0, 2, 4, 6, and 8 hpi; MOI, 10 PFU/cell) or in TNF-α-treated ST cells (5 and 15 min posttreatment, 100 ng/ml). (C) Western blot analysis of total IκBα and IκBα phosphorylated at serine 32 in mock-treated or TNF-α-treated ST cells (5 min, 100 ng/ml) incubated or not with bacteriophage lambda protein phosphatase. The Western blots shown are representative examples from three independent repeats of the experiments.
FIG 6
FIG 6
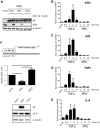
(A) Western blot analysis of IκBα in PRV Kaplan-infected ST cells (MOI, 10 PFU/cell) analyzed at 6, 8, and 12 hpi and treated or not with the proteasome inhibitor MG132 (10 μM) for 4 h starting at 2, 4, or 8 hpi. (B to E) RT-qPCR analysis of NFKBIA (IκBα) (B), TNFAIP3 (A20) (C), TNFA (TNF-α) (D), and IL-6 (IL-6) (E) gene transcription in PRV Kaplan-infected ST cells (4, 8, and 12 hpi; MOI, 10 PFU/cell) or TNF-α-treated ST cells (30 min, 1 h, 2 h, and 4 h; 100 ng/ml). Graphs represent the mean and standard deviation values of relative mRNA expression obtained from three independent repeats of the experiment. (F) Schematic representation of the NF-κB–luciferase reporter assay (pNiFty-Luc plasmid; Invivogen). The graph shows the mean and standard deviation values of relative light units registered in three independent NF-κB–luciferase reporter assays in mock-infected, PRV-infected (16 hpi; MOI, 10 PFU/cell), and TNF-α-stimulated (16 h; 100 ng/ml) ST cells that had previously been transfected with the pNiFty-Luc (5×NF-κB–luciferase) plasmid. The pCDNA3-eGFP plasmid was cotransfected to assess for a similar transfection efficiency under all analyzed conditions, as illustrated by the Western blot. Asterisks indicate statistically significant differences. **, P < 0.01; ***, P < 0.001.
FIG 7
FIG 7
(A) Western blot analysis of IκBα in either TNF-α-stimulated ST cells (100 ng/ml; left), PRV Kaplan-infected ST cells challenged at 4 hpi with TNF-α (MOI, 10 PFU/cell; 100 ng/ml; middle), or PRV Kaplan-infected ST cells that were left untreated (MOI, 10 PFU/cell; right), analyzed at the indicated time points. (B) Confocal microscopy of NF-κB p65 in mock-infected or PRV-infected ST cells (4 hpi; MOI, 10 PFU/cell) treated or not treated with TNF-α for 30 min (100 ng/ml). NF-κB p65 is shown in green, PRV gB is shown in red, and nuclei are shown in blue. Bar, 50 μm. (C) Western blot analysis of total and Ser32-phosphorylated IκBα protein in either mock-infected or PRV-infected cells (4 hpi; MOI, 10 PFU/cell) treated or not treated with TNF-α for 5 min (100 ng/ml). The Western blots and the confocal microscopy images shown are representative examples from three independent experimental repeats.
FIG 8
FIG 8
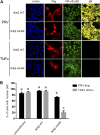
(A) Confocal microscopy of NF-κB p65 in PRV-infected (8 hpi; MOI, 10 PFU/cell) or TNF-α-treated (30 min, 100 ng/ml) ST cells that had previously been transfected with either the pCMV2-IKK-2 WT plasmid (encoding Flag-tagged WT IKKβ) or the pCMV2-IKK-2 K44M plasmid (encoding kinase-inactive Flag-tagged IKKβ). NF-κB p65 is shown in green, PRV gB is shown in yellow, the Flag tag is shown in red, and nuclei are shown in blue. Bar, 50 μm. (B) The graph represents the mean and standard deviation of the percentage of WT IKKβ- or kinase-inactive IKKβ-transfected cells with a predominant nuclear localization of NF-κB p65, based on three independent repeats of the experiment. Significantly different (P < 0.05) results are indicated with different letters.
FIG 9
FIG 9
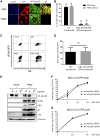
(A) Confocal microscopy of NF-κB p65 in PRV-infected (8 hpi; MOI, 10 PFU/cell) or TNF-α-stimulated (30 min, 100 ng/ml) ST cells that had previously been transfected with the pCMV4-3×HA-IκBα SS32,36AA plasmid encoding an IκBα superrepressor (SR; S32A/S36A) fused to a 3×HA tag. NF-κB p65 is shown in green, PRV gB is shown in yellow, the HA tag is shown in red, and cell nuclei are shown in blue. (B) The mean and standard deviation of the percentage of IκBα S32A/S36A (SR)-transfected cells and nontransfected cells with a predominant nuclear localization of NF-κB p65, based on three independent repeats of the experiment. Significantly different (P < 0.05) results are indicated with different letters. (C) Flow cytometric contour plots of ST cells that were either not transfected and not infected (mock, upper left), transfected with IκBα S32A/S36A-HA and not infected (SR, upper right), not transfected and infected with PRV-GS443 (VP26-GFP; MOI, 10 PFU/cell; 8 hpi) (PRV, lower left), and transfected with IκBα S32A/S36A-HA and infected with PRV-GS443 (MOI, 10 PFU/cell; 8 hpi) (PRV+SR, lower right). The y axis represents the fluorescence intensity registered for VP26-GFP, and the x axis shows the fluorescence intensity obtained for the APC channel (stained HA tag). (D) The mean and standard deviation of the median fluorescence intensity (MFI) ratios of VP26-GFP in nontransfected or IκBα S32A/S36A (SR)-transfected cells based on three independent repeats of the assay. ns, no significant difference. (E) Western blot analysis of IE180 (IE), US3 (E), gE (L), and VP5 (L) expression in mock-infected and PRV Kaplan-infected (MOI, 10 PFU/cell; 8 hpi) ST cells that had previously been transfected (or not) with scrambled or NF-κB p65-targeting silencing RNAs (siRNA). NF-κB p65 protein levels were determined to assess efficient knockdown. (F) Extracellular virus yields (log10 number of PFU per milliliter) determined at 8, 16, and 24 hpi in ST cells transfected with scrambled siRNA or NF-κB p65-targeting siRNA and infected at an MOI of 10 PFU/cell. (G) Extracellular virus yields (log10 number of PFU per milliliter) determined at 24 and 48 hpi in ST cells transfected with scrambled siRNA or NF-κB p65-targeting siRNA and infected at an MOI of 0.01 PFU/cell.
FIG 10
FIG 10
Schematic representation of a hypothetical model of how PRV modulates the NF-κB signaling axis, based on the findings obtained in the current work.

Similar articles

Cited by

References

    1. Pomeranz LE, Reynolds AE, Hengartner CJ. 2005. Molecular biology of pseudorabies virus: impact on neurobiology and veterinary medicine. Microbiol Mol Biol Rev 69:462–500. doi:10.1128/MMBR.69.3.462-500.2005. - DOI - PMC - PubMed
    1. Liu T, Zhang T, Joo D, Sun SC. 2017. NF-κB signaling in inflammation. Signal Transduct Target Ther 2:17023. doi:10.1038/sigtrans.2017.23. - DOI - PMC - PubMed
    1. Santoro MG, Rossi A, Amici C. 2003. NF-kappaB and virus infection: who controls whom. EMBO J 22:2552–2560. doi:10.1093/emboj/cdg267. - DOI - PMC - PubMed
    1. Hayden MS, West AP, Ghosh S. 2006. NF-kappaB and the immune response. Oncogene 25:6758–6780. doi:10.1038/sj.onc.1209943. - DOI - PubMed
    1. Hayden MS, Ghosh S. 2014. Regulation of NF-κB by TNF family of cytokines. Semin Immunol 26:253–266. doi:10.1016/j.smim.2014.05.004. - DOI - PMC - PubMed

Publication types

LinkOut - more resources