

Methylome Variation Predicts Exemestane Resistance in Advanced ER+ Breast Cancer
- PMID: 32129154
- PMCID: PMC7057408
- DOI: 10.1177/1533033819896331
Methylome Variation Predicts Exemestane Resistance in Advanced ER+ Breast Cancer
Abstract
Background: More than 30% of estrogen receptor-positive breast cancers are resistant to primary hormone therapy, and about 40% that initially respond to hormone therapy eventually acquire resistance. Although the mechanisms of hormone therapy resistance remain unclear, aberrant DNA methylation has been implicated in oncogenesis and drug resistance.
Purpose: We investigated the relationship between methylome variations in circulating tumor DNA and exemestane resistance, to track hormone therapy efficacy.
Methods: We prospectively recruited 16 patients who were receiving first-line therapy in our center. All patients received exemestane-based hormone therapy after enrollment. We collected blood samples at baseline, first follow-up (after 2 therapeutic cycles) and at detection of disease progression. Disease that progressed within 6 months under exemestane treatment was considered exemestane resistance but was considered relatively exemestane-sensitive otherwise. We obtained circulating tumor DNA-derived methylomes using the whole-genome bisulfide sequencing method. Methylation calling was done by BISMARK software; differentially methylated regions for exemestane resistance were calculated afterward.
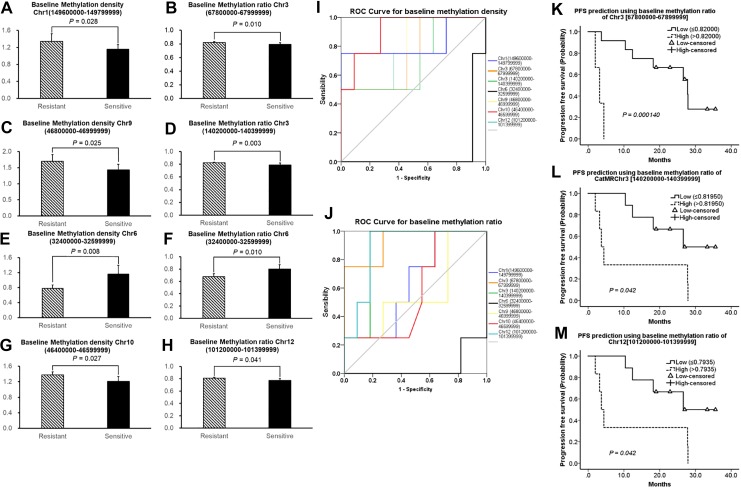
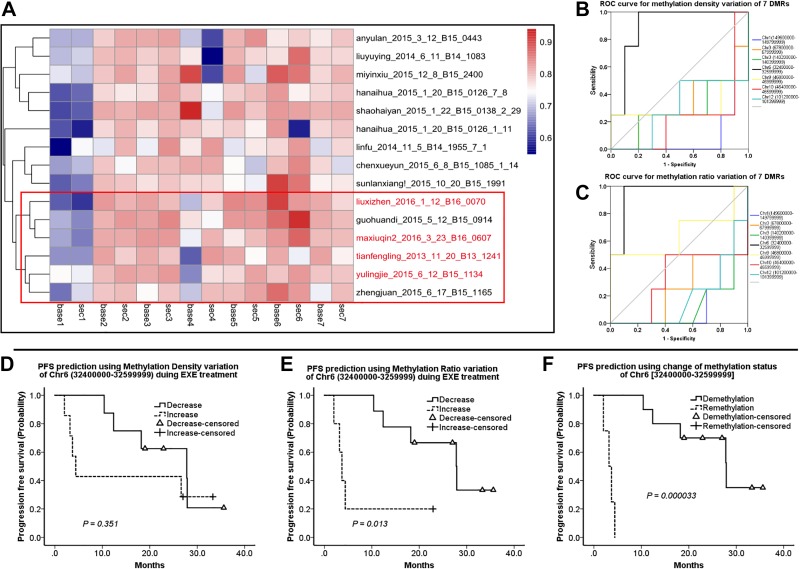
Results: Median follow-up for the 16 patients was 19.0 months. We found 7 exemestane resistance-related differentially methylated regions, located in different chromosomes, with both significantly different methylation density and methylation ratio. Baseline methylation density and methylation ratio of chromosome 6 [32400000-32599999] were both high in exemestane resistance. High baseline methylation ratios of chromosome 3 [67800000-67999999] (P = .013), chromosome 3 [140200000-140399999] (P = .037), and chromosome 12 [101200000-101399999] (P = .026) could also predict exemestane resistance. During exemestane treatment, synchronized changes in methylation density and methylation ratio in chromosome 6 [32400000-32599999] could accurately stratify patients in terms of progression-free survival (P = .000033). Cutoff values of methylation density and methylation ratio for chromosome 6 [149600000-149799999] were 0.066 and 0.076, respectively.
Conclusion: Methylation change in chromosome 6 [149600000-149799999] is an ideal predictor of exemestane resistance with great clinical potential.
Keywords: advanced breast cancer; circulating tumor DNA; exemestane resistance; methylomes.
Conflict of interest statement
Figures
Similar articles
-
ESR1 Mutations and Overall Survival on Fulvestrant versus Exemestane in Advanced Hormone Receptor-Positive Breast Cancer: A Combined Analysis of the Phase III SoFEA and EFECT Trials.Clin Cancer Res. 2020 Oct 1;26(19):5172-5177. doi: 10.1158/1078-0432.CCR-20-0224. Epub 2020 Jun 16. Clin Cancer Res. 2020. PMID: 32546646 Clinical Trial.
-
Tracking evolution of aromatase inhibitor resistance with circulating tumour DNA analysis in metastatic breast cancer.Ann Oncol. 2018 Jan 1;29(1):145-153. doi: 10.1093/annonc/mdx483. Ann Oncol. 2018. PMID: 29045530 Free PMC article.
-
Serial immunological parameters in a phase II trial of exemestane and low-dose oral cyclophosphamide in advanced hormone receptor-positive breast cancer.Breast Cancer Res Treat. 2018 Feb;168(1):57-67. doi: 10.1007/s10549-017-4570-4. Epub 2017 Nov 9. Breast Cancer Res Treat. 2018. PMID: 29124456 Clinical Trial.
-
Exemestane: a review of its use in postmenopausal women with advanced breast cancer.Drugs. 2000 Jun;59(6):1279-96. doi: 10.2165/00003495-200059060-00007. Drugs. 2000. PMID: 10882163 Review.
-
Systematic review of aromatase inhibitors in the first-line treatment for hormone sensitive advanced or metastatic breast cancer.Breast Cancer Res Treat. 2010 Aug;123(1):9-24. doi: 10.1007/s10549-010-0974-0. Epub 2010 Jun 10. Breast Cancer Res Treat. 2010. PMID: 20535542 Review.
Cited by
-
High expression of the RET receptor tyrosine kinase and its ligand GDNF identifies a high-risk subset of estrogen receptor positive breast cancer.Breast Cancer Res Treat. 2023 Jun;199(3):589-601. doi: 10.1007/s10549-023-06937-9. Epub 2023 Apr 15. Breast Cancer Res Treat. 2023. PMID: 37061618 Free PMC article.
-
Whole-Genome Methylation Study of Congenital Lung Malformations in Children.Front Oncol. 2021 Jun 28;11:689833. doi: 10.3389/fonc.2021.689833. eCollection 2021. Front Oncol. 2021. PMID: 34262872 Free PMC article.
-
A Systematic Review of the Use of Circulating Cell-Free DNA Dynamics to Monitor Response to Treatment in Metastatic Breast Cancer Patients.Cancers (Basel). 2021 Apr 10;13(8):1811. doi: 10.3390/cancers13081811. Cancers (Basel). 2021. PMID: 33920135 Free PMC article. Review.
References
Publication types
MeSH terms
Substances
LinkOut - more resources
Full Text Sources
Medical
Miscellaneous
