Effect of Optimized Immunosuppression (Including Rituximab) on Anti-Donor Alloresponses in Patients With Chronically Rejecting Renal Allografts
- PMID: 32117242
- PMCID: PMC7012933
- DOI: 10.3389/fimmu.2020.00079
Effect of Optimized Immunosuppression (Including Rituximab) on Anti-Donor Alloresponses in Patients With Chronically Rejecting Renal Allografts
Abstract
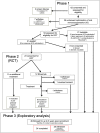
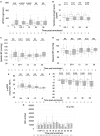
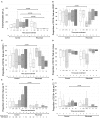
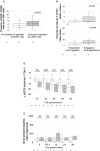
RituxiCAN-C4 combined an open-labeled randomized controlled trial (RCT) in 7 UK centers to assess whether rituximab could stabilize kidney function in patients with chronic rejection, with an exploratory analysis of how B cell-depletion influenced T cell anti-donor responses relative to outcome. Between January 2007 and March 2015, 59 recruits were enrolled after screening, 23 of whom consented to the embedded RCT. Recruitment was halted when in a pre-specified per protocol interim analysis, the RCT was discovered to be significantly underpowered. This report therefore focuses on the exploratory analysis, in which we confirmed that when B cells promoted CD4+ anti-donor IFNγ production assessed by ELISPOT, this associated with inferior clinical outcome; these patterns were inhibited by optimized immunosuppression but not rituximab. B cell suppression of IFNγ production, which associated with number of transitional B cells and correlated with slower declines in kidney function was abolished by rituximab, which depleted transitional B cells for prolonged periods. We conclude that in this patient population, optimized immunosuppression but not rituximab promotes anti-donor alloresponses associated with favorable outcomes. Clinical Trial Registration: Registered with EudraCT (2006-002330-38) and www.ClinicalTrials.gov, identifier: NCT00476164.
Keywords: B lymphocytes; chronic rejection in renal transplant; donor specific antibody (DSA); kidney transplantation; rituximab.
Copyright © 2020 Shiu, Stringer, McLaughlin, Shaw, Brookes, Burton, Wilkinson, Douthwaite, Tsui, Mclean, Hilton, Griffin, Geddes, Ball, Baker, Roufosse, Horsfield and Dorling.
Figures


Similar articles
-
Treatment of Biopsy-Proven Acute Antibody-Mediated Rejection Using Thymoglobulin (ATG) Monotherapy and a Combination of Rituximab, Intravenous Immunoglobulin, and Plasmapheresis: Lesson Learned from Primary Experience.Clin Transpl. 2014:223-30. Clin Transpl. 2014. PMID: 26281149
-
Efficacy of 2 Doses of Rituximab on B-Cell and Antidonor Antibody and Outcomes of ABO-Incompatible Living-Donor Pediatric Kidney Transplant.Exp Clin Transplant. 2019 Jan;17(Suppl 1):105-109. doi: 10.6002/ect.MESOT2018.O43. Exp Clin Transplant. 2019. PMID: 30777532
-
Clazakizumab in late antibody-mediated rejection: study protocol of a randomized controlled pilot trial.Trials. 2019 Jan 11;20(1):37. doi: 10.1186/s13063-018-3158-6. Trials. 2019. PMID: 30635033 Free PMC article.
-
Graft dysfunction in chronic antibody-mediated rejection correlates with B-cell-dependent indirect antidonor alloresponses and autocrine regulation of interferon-γ production by Th1 cells.Kidney Int. 2017 Feb;91(2):477-492. doi: 10.1016/j.kint.2016.10.009. Epub 2016 Dec 15. Kidney Int. 2017. PMID: 27988211 Free PMC article.
-
New treatments for acute humoral rejection of kidney allografts.Expert Opin Investig Drugs. 2007 May;16(5):625-33. doi: 10.1517/13543784.16.5.625. Expert Opin Investig Drugs. 2007. PMID: 17461736 Review.
Cited by
-
Tackling Chronic Kidney Transplant Rejection: Challenges and Promises.Front Immunol. 2021 May 20;12:661643. doi: 10.3389/fimmu.2021.661643. eCollection 2021. Front Immunol. 2021. PMID: 34093552 Free PMC article. Review.
-
Construction of predictive model of interstitial fibrosis and tubular atrophy after kidney transplantation with machine learning algorithms.Front Genet. 2023 Nov 1;14:1276963. doi: 10.3389/fgene.2023.1276963. eCollection 2023. Front Genet. 2023. PMID: 38028591 Free PMC article.
-
Regulatory B Cells in Solid Organ Transplantation: From Immune Monitoring to Immunotherapy.Transplantation. 2024 May 1;108(5):1080-1089. doi: 10.1097/TP.0000000000004798. Epub 2023 Oct 2. Transplantation. 2024. PMID: 37779239 Review.
-
Can regulatory T cells improve outcomes of sensitised patients after HLA-Ab incompatible renal transplantation: study protocol for the Phase IIa GAMECHANgER-1 trial.BMC Nephrol. 2023 Apr 28;24(1):117. doi: 10.1186/s12882-023-03157-7. BMC Nephrol. 2023. PMID: 37118685 Free PMC article.
-
Tracking Circulating HLA-Specific IgG-Producing Memory B Cells with the B-Cell ImmunoSpot Assay.Methods Mol Biol. 2024;2768:201-209. doi: 10.1007/978-1-0716-3690-9_12. Methods Mol Biol. 2024. PMID: 38502395
References
Publication types
MeSH terms
Substances
Associated data
Grants and funding
LinkOut - more resources
Full Text Sources
Medical
Research Materials
Miscellaneous

