

Activity-Dependent Plasticity of Axo-axonic Synapses at the Axon Initial Segment
- PMID: 32109363
- PMCID: PMC7181187
- DOI: 10.1016/j.neuron.2020.01.037
Activity-Dependent Plasticity of Axo-axonic Synapses at the Axon Initial Segment
Abstract
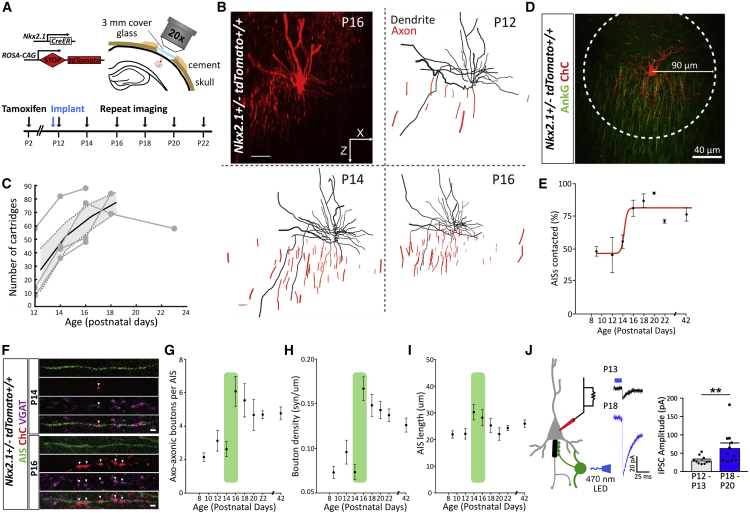
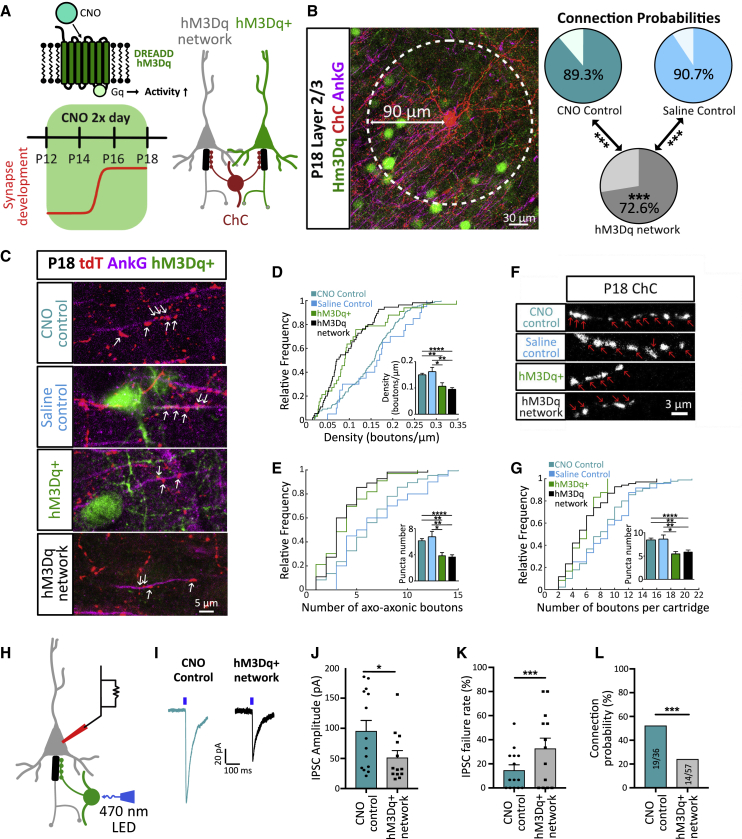
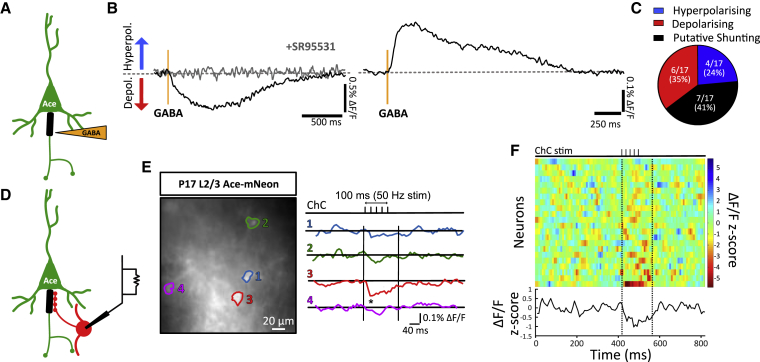
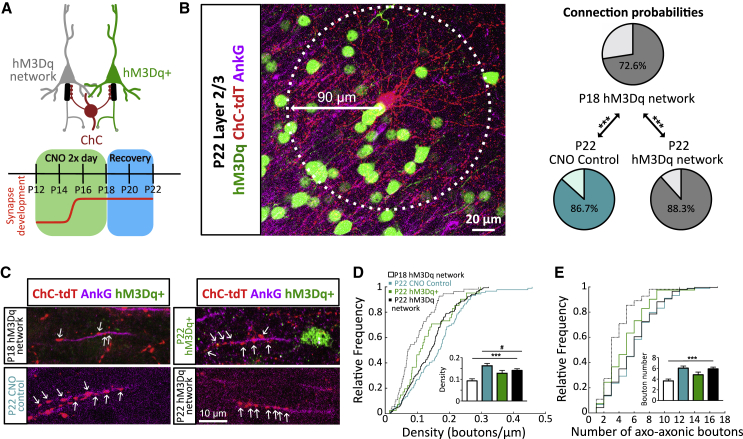
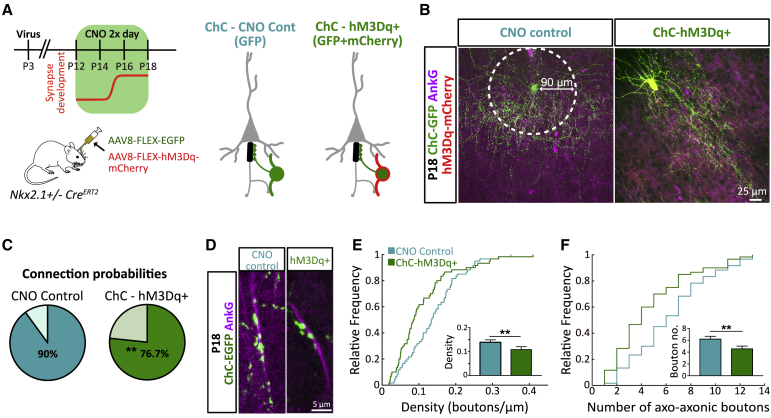
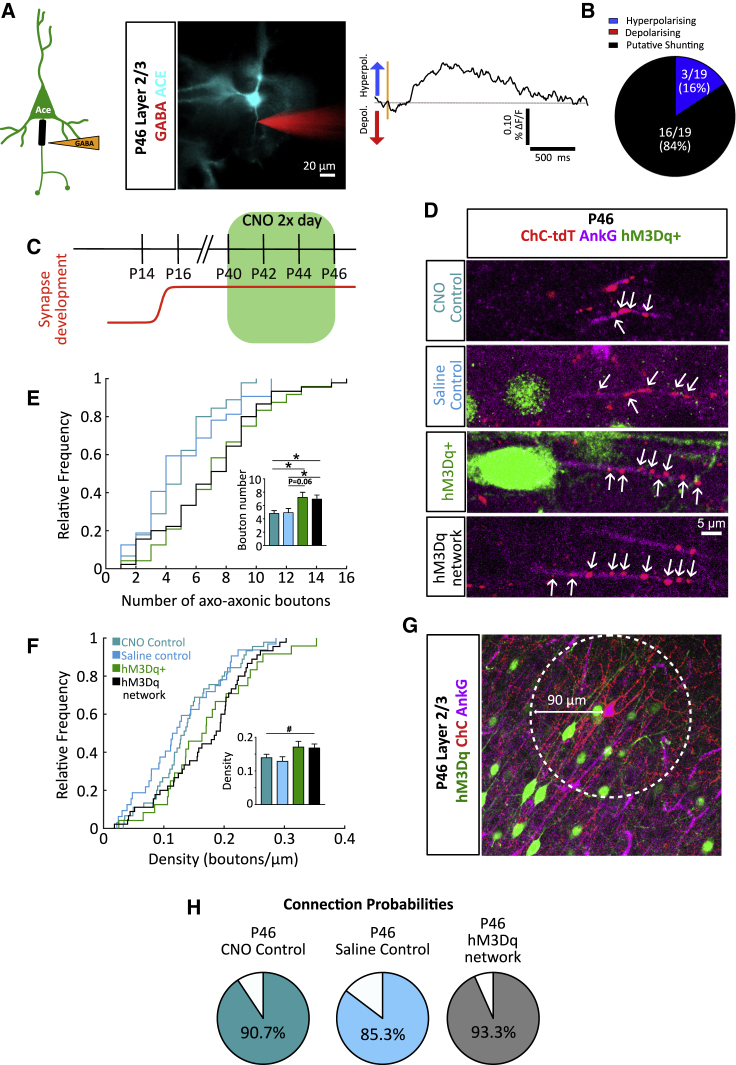
The activity-dependent rules that govern the wiring of GABAergic interneurons are not well understood. Chandelier cells (ChCs) are a type of GABAergic interneuron that control pyramidal cell output through axo-axonic synapses that target the axon initial segment. In vivo imaging of ChCs during development uncovered a narrow window (P12-P18) over which axons arborized and formed connections. We found that increases in the activity of either pyramidal cells or individual ChCs during this temporal window result in a reversible decrease in axo-axonic connections. Voltage imaging of GABAergic transmission at the axon initial segment (AIS) showed that axo-axonic synapses were depolarizing during this period. Identical manipulations of network activity in older mice (P40-P46), when ChC synapses are inhibitory, resulted instead in an increase in axo-axonic synapses. We propose that the direction of ChC synaptic plasticity follows homeostatic rules that depend on the polarity of axo-axonic synapses.
Keywords: Chandelier; GABA; activity-dependent; axo-axonic; axon initial segment; development; homeostatic; interneuron; plasticity.
Copyright © 2020 The Authors. Published by Elsevier Inc. All rights reserved.
Conflict of interest statement
Declaration of Interests The authors declare no competing interests.
Figures
Comment in
-
Held in the balance.Nat Rev Neurosci. 2020 May;21(5):244-245. doi: 10.1038/s41583-020-0295-1. Nat Rev Neurosci. 2020. PMID: 32214234 No abstract available.
-
Flipping the Switch: Homeostatic Tuning of Chandelier Synapses Follows Developmental Changes in GABA Polarity.Neuron. 2020 Apr 22;106(2):199-201. doi: 10.1016/j.neuron.2020.03.036. Neuron. 2020. PMID: 32325052
Similar articles
-
Microglia regulate chandelier cell axo-axonic synaptogenesis.Proc Natl Acad Sci U S A. 2022 Mar 15;119(11):e2114476119. doi: 10.1073/pnas.2114476119. Epub 2022 Mar 9. Proc Natl Acad Sci U S A. 2022. PMID: 35263225 Free PMC article.
-
Specific and comprehensive genetic targeting reveals brain-wide distribution and synaptic input patterns of GABAergic axo-axonic interneurons.Elife. 2024 Jul 16;13:RP93481. doi: 10.7554/eLife.93481. Elife. 2024. PMID: 39012795 Free PMC article.
-
Activity-dependent mismatch between axo-axonic synapses and the axon initial segment controls neuronal output.Proc Natl Acad Sci U S A. 2015 Aug 4;112(31):9757-62. doi: 10.1073/pnas.1502902112. Epub 2015 Jul 20. Proc Natl Acad Sci U S A. 2015. PMID: 26195803 Free PMC article.
-
Lighting the chandelier: new vistas for axo-axonic cells.Trends Neurosci. 2005 Jun;28(6):310-6. doi: 10.1016/j.tins.2005.04.004. Trends Neurosci. 2005. PMID: 15927687 Review.
-
Molecular mechanisms of axo-axonic innervation.Curr Opin Neurobiol. 2021 Aug;69:105-112. doi: 10.1016/j.conb.2021.03.002. Epub 2021 Apr 14. Curr Opin Neurobiol. 2021. PMID: 33862423 Free PMC article. Review.
Cited by
-
Neuromodulatory control of inhibitory network arborization in the developing postnatal neocortex.Sci Adv. 2022 Mar 11;8(10):eabe7192. doi: 10.1126/sciadv.abe7192. Epub 2022 Mar 9. Sci Adv. 2022. PMID: 35263136 Free PMC article.
-
Retinal and Callosal Activity-Dependent Chandelier Cell Elimination Shapes Binocularity in Primary Visual Cortex.Neuron. 2021 Feb 3;109(3):502-515.e7. doi: 10.1016/j.neuron.2020.11.004. Epub 2020 Dec 7. Neuron. 2021. PMID: 33290732 Free PMC article.
-
Tau reduction affects excitatory and inhibitory neurons differently, reduces excitation/inhibition ratios, and counteracts network hypersynchrony.Cell Rep. 2021 Oct 19;37(3):109855. doi: 10.1016/j.celrep.2021.109855. Cell Rep. 2021. PMID: 34686344 Free PMC article.
-
Repeated whole-cell patch-clamp recording from CA1 pyramidal cells in rodent hippocampal slices followed by axon initial segment labeling.STAR Protoc. 2021 Feb 5;2(1):100336. doi: 10.1016/j.xpro.2021.100336. eCollection 2021 Mar 19. STAR Protoc. 2021. PMID: 33644771 Free PMC article.
-
Specific and Plastic: Chandelier Cell-to-Axon Initial Segment Connections in Shaping Functional Cortical Network.Neurosci Bull. 2024 Nov;40(11):1774-1788. doi: 10.1007/s12264-024-01266-3. Epub 2024 Jul 30. Neurosci Bull. 2024. PMID: 39080101 Free PMC article. Review.
References
-
- Ben-Ari Y. Excitatory actions of gaba during development: the nature of the nurture. Nat. Rev. Neurosci. 2002;3:728–739. - PubMed
-
- Ben-Ari Y., Gaiarsa J.L., Tyzio R., Khazipov R. GABA: a pioneer transmitter that excites immature neurons and generates primitive oscillations. Physiol. Rev. 2007;87:1215–1284. - PubMed
-
- Bonifazi P., Goldin M., Picardo M.A., Jorquera I., Cattani A., Bianconi G., Represa A., Ben-Ari Y., Cossart R. GABAergic hub neurons orchestrate synchrony in developing hippocampal networks. Science. 2009;326:1419–1424. - PubMed
Publication types
MeSH terms
Substances
Grants and funding
LinkOut - more resources
Full Text Sources
Other Literature Sources
Molecular Biology Databases
