. 2020 Apr 8;28(4):1043-1055.
doi: 10.1016/j.ymthe.2020.01.027. Epub 2020 Feb 4.

Type 1 Interferon Responses Underlie Tumor-Selective Replication of Oncolytic Measles Virus

Affiliations

Type 1 Interferon Responses Underlie Tumor-Selective Replication of Oncolytic Measles Virus

Sarah Aref et al. Mol Ther. .

Abstract

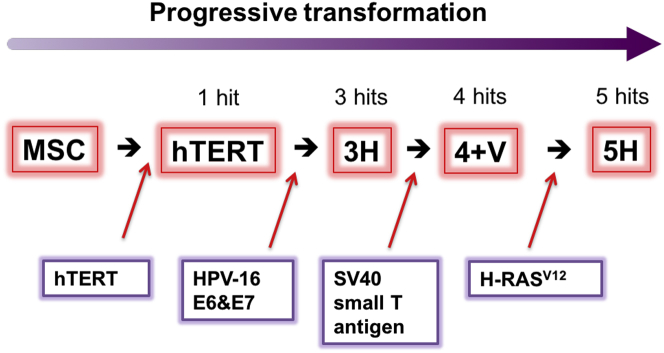
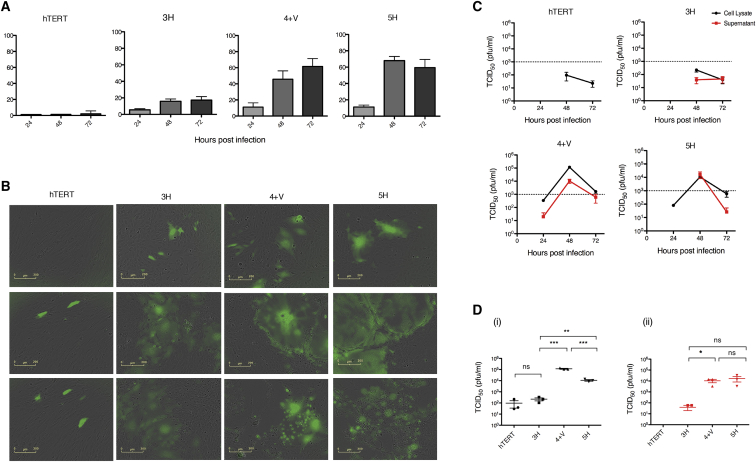
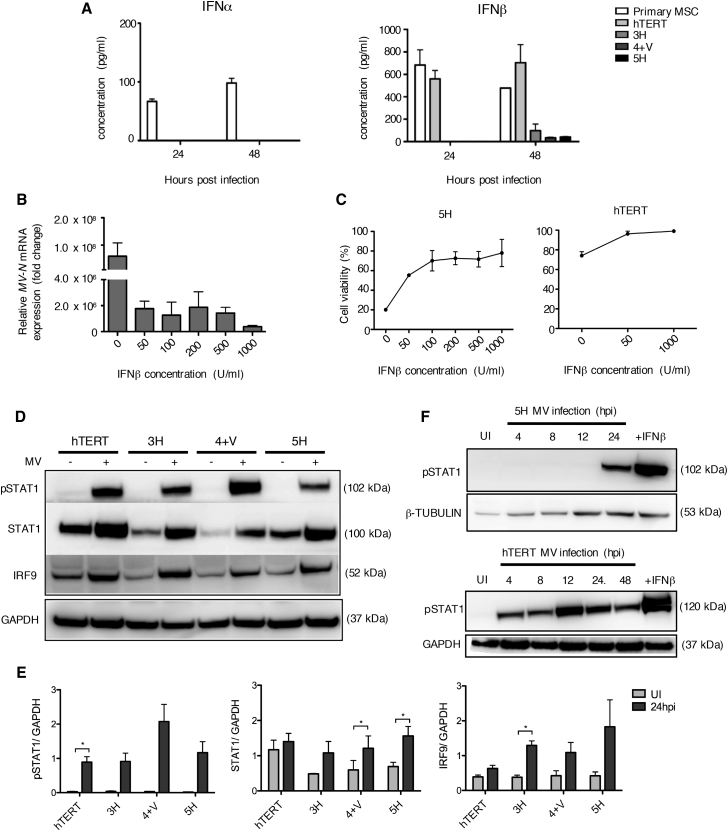
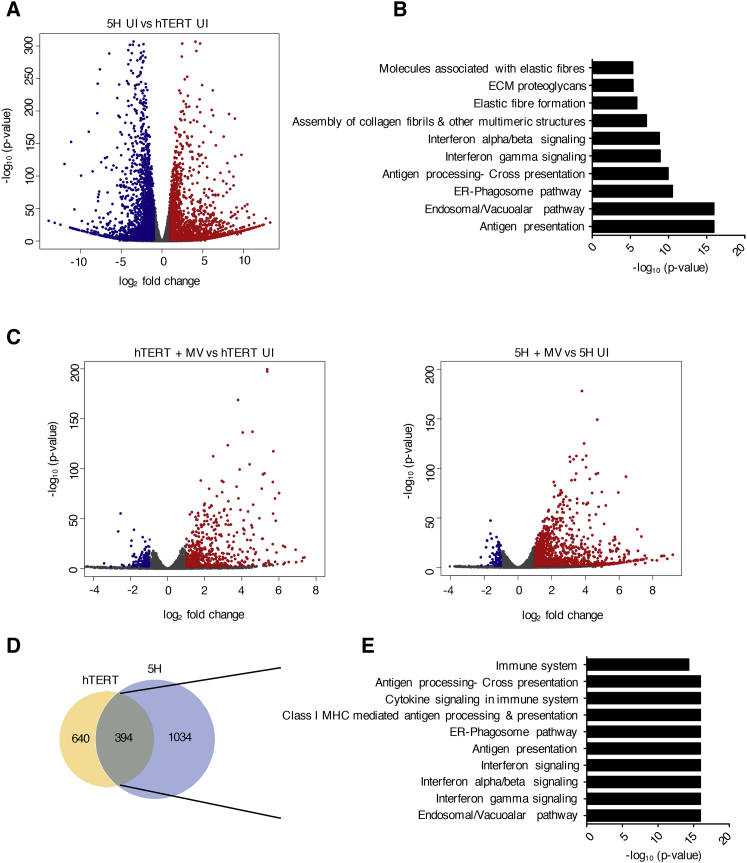
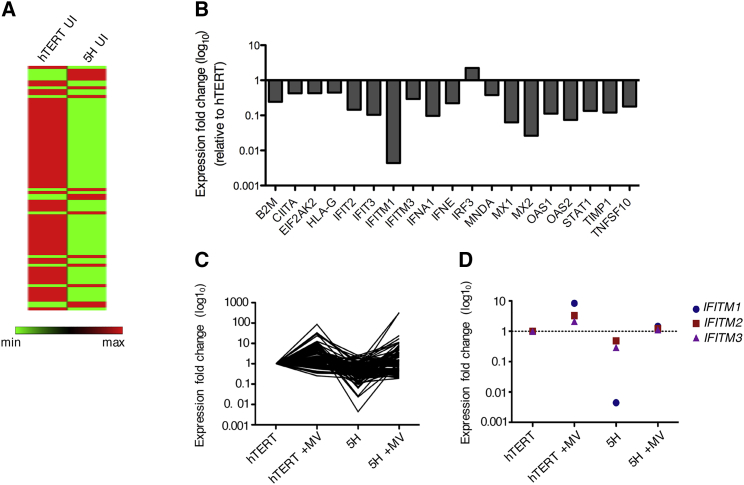
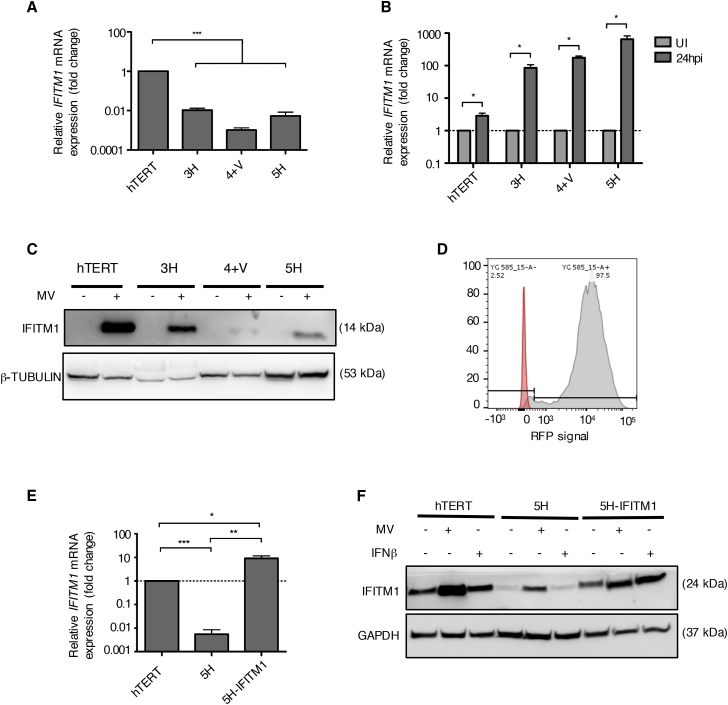
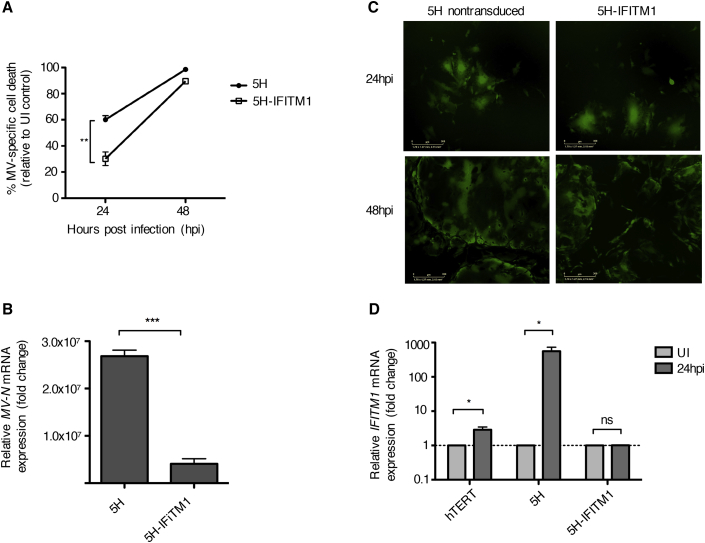
The mechanism of tumor-selective replication of oncolytic measles virus (MV) is poorly understood. Using a stepwise model of cellular transformation, in which oncogenic hits were additively expressed in human bone marrow-derived mesenchymal stromal cells, we show that MV-induced oncolysis increased progressively with transformation. The type 1 interferon (IFN) response to MV infection was significantly reduced and delayed, in accordance with the level of transformation. Consistently, we observed delayed and reduced signal transducer and activator of transcription (STAT1) phosphorylation in the fully transformed cells. Pre-treatment with IFNβ restored resistance to MV-mediated oncolysis. Gene expression profiling to identify the genetic correlates of susceptibility to MV oncolysis revealed a dampened basal level of immune-related genes in the fully transformed cells compared to their normal counterparts. IFN-induced transmembrane protein 1 (IFITM1) was the foremost basally downregulated immune gene. Stable IFITM1 overexpression in MV-susceptible cells resulted in a 50% increase in cell viability and a significant reduction in viral replication at 24 h after MV infection. Overall, our data indicate that the basal reduction in functions of the type 1 IFN pathway is a major contributor to the oncolytic selectivity of MV. In particular, we have identified IFITM1 as a restriction factor for oncolytic MV, acting at early stages of infection.

Keywords: IFITM1; ISG; MV; innate immune response; interferon-induced transmembrane protein 1; interferon-stimulated gene; measles virus; oncolytic measles virus; type 1 interferon.


Figures

Figure 1
Figure 1
Model of Stepwise Transformation of Human Bone Marrow-Derived Mesenchymal Stromal Cells Schematic diagram of MSC stepwise transformation (adapted from Funes et al.19). MSCs were named according to the number of oncogenes inserted by retroviral transduction. hTERT encodes the catalytic subunit of human telomerase and confers the cells extended lifespan in vitro. Human papilloma virus (HPV-16) E6 and E7 genes abrogate the functions of p53 and pRb tumor suppressors, respectively. SV40 small T antigen leads to the stabilization of c-Myc by inactivating protein phosphatase 2A. Finally, the insertion of an oncogenic allele of Ras (H-RasV12) provides the acquisition of a constitutive mitogenic signal.
Figure 2
Figure 2
Susceptibility to MV-Mediated Oncolysis Is Positively Correlated with Progressive Transformation of MSCs (A) MSCs were infected with MV-NSe (MOI of 1.0) and cell viability was assessed by trypan blue exclusion at 24, 48 and 72 h post-infection (hpi). Data are expressed as a percentage of cell killing by MV relative to uninfected control cells (n = 3). (B) Representative GFP and bright-field (BF) microscopy images of MSCs at 24, 48, and 72 hpi with MV-NSe-GFP (MOI of 1.0). Scale bars, 200 μm. (C) Tissue culture supernatants (red lines) and cell lysates (black lines) were harvested at the indicated time points after infection. (D) Viral titres at 48 hpi are shown for (i) cell lysates and (ii) supernatants. Viral titrations were performed on Vero cells and are calculated as TCID50 (plaque-forming units [PFU]/mL) (n = 3). Data are expressed as mean ± SEM. All results shown are representative of three independent experiments (unpaired t test, *p < 0.05, **p < 0.01, ***p < 0.001). MV, measles virus; NS, not significant.
Figure 3
Figure 3
Differential Production of Type 1 IFN by MSCs in Response to Oncolytic MV (A) IFNα and IFNβ production levels as assessed by ELISA using tissue culture supernatants collected from all MSCs, including primary patient-derived MSCS, at 24 and 48 hpi. Data are expressed as mean ± SEM of two independent experiments (n = 2) with samples measured in duplicates. (B) MV-N mRNA expression levels as assessed by qRT-PCR for 5H cells pre-treated with different concentrations of exogenous IFNβ for 16 h prior to MV infection. Data shown are relative to housekeeping gene GAPDH and normalized to uninfected control cells. Data are expressed as mean ± SEM (n = 3). (C) Cell viability of 5H cells following pre-treatment with IFNβ, and MV infection was assessed by trypan blue exclusion at 30 hpi. hTERT cells were used as a control. Results are reported as a the percentage of cell viability relative to uninfected control cells. Data are expressed as mean ± SEM (n = 3). (D) Immunoblotting of total STAT1, phosphorylated STAT1 (pSTAT1), and IRF9 using cell lysate of uninfected and MV-infected MSCs collected at 24 hpi. β-Tubulin or GAPDH was used as a loading control (n = 3). (E) Densitometry analysis of blot in (D) performed by ImageJ. (F) Immunoblot analysis of pSTAT1 during the time course of MV infection in 5H cells and hTERT cells using cell lysates collected at the indicated time points. Cells stimulated with IFNβ (1,000 U/mL) for 1 h were used as a positive control. Expression of β-tubulin and GAPDH was used as loading controls as indicated.
Figure 4
Figure 4
RNA Sequencing Reveals Differential Baseline Gene Expression in MV-Resistant and MV-Susceptible MSCs RNA-seq was performed on total RNA that was extracted from uninfected and MV-infected hTERT and 5H cells at 24 hpi. (A) Volcano plot of differentially expressed genes (DEGs) in 5H cells compared to hTERT cells at baseline levels (n = 3). Cut-off criteria for DEGs are absolute log2 fold change >1 and padjusted value <0.05. The y axis displays the log10 p value for each gene, while the x axis displays the log2 fold change for that gene relative to hTERT. Red dots indicate upregulated genes, green dots indicate downregulated genes, and gray dots indicate non-significant relative to hTERT. (B) Genes downregulated (more than 3-fold downregulation, p value < 0.05) in 5H compared to hTERT cells were selected and analyzed using the functional annotation tool in REACTOME. The top 12 enriched pathways (p value < 0.001) are shown. (C) Volcano plots depicting DEGs after infection of (i) hTERT cells and (ii) 5H cells (compared to mock-infected control cells). (D) Venn diagram illustrating the overlap of genes found to be upregulated in response to MV infection in both hTERT and 5H cells (absolute log2 fold change [FC] > 1, padjusted value < 0.05). (E) REACTOME pathway enrichment analysis of the 394 upregulated genes. The top 10 pathways are represented in the bar plot (p value < 0.001).
Figure 5
Figure 5
Genes Involved in the Type 1 IFN Signaling Pathway Are Repressed in 5H Compared to hTERT Cells and Induced by MV Infection Gene expression of 84 genes was validated by a custom type 1 IFN RT2 Profiler PCR array (n = 3). (A) Heatmap representation of array genes in uninfected hTERT and 5H cells. Green represents low expression levels, and red represents high expression levels. (B) Gene expression profile showing differentially expressed genes in 5H compared to hTERT (absolute log2 fold change [FC] > 1 and p < 0.05). Gene names are shown on the x axis. Data are expressed as mean ± SEM. (C) Fold change in gene expression of the 84 analyzed genes at basal levels and upon induction by MV infection. (D) Differential expression of IFITM genes (IFITM1, IFITM2, and IFITM3) before and after MV infection of hTERT and 5H cells. *p = 0.0338 for IFITM1, hTERT versus 5H.
Figure 6
Figure 6
IFITM1 Expression Is Correlated with Progressive MSC Transformation (A) IFITM1 mRNA expression in all MSCs as assessed by qRT-PCR. Data shown are relative to housekeeping gene GAPDH and normalized to hTERT cells (n = 3). (B) IFITM1 mRNA expression measured by qRT-PCR at 24 hpi of all MSCs. Data shown are relative to housekeeping gene GAPDH and normalized to uninfected control cells (n = 3). (C) Immunoblot showing IFITM1 protein expression at 24 hpi in uninfected and MV-infected MSCs. β-Tubulin is used as a loading control. (D) Histograms of FACS analysis of the expression levels of red fluorescent protein (RFP), which was co-expressed with IFITM1, in transduced 5H cells. (E) IFITM1 mRNA expression levels in mock-infected and MV-infected hTERT, 5H, and 5H-IFITM1 cells at 24 hpi. Data shown are relative to housekeeping gene GAPDH and normalized to uninfected control cells (n = 3). (F) Immunoblots confirming the overexpression of IFITM1 in transduced 5H cells. GAPDH is used as a loading control. Data are expressed as mean ± SEM. All results shown are representative of three independent experiments (unpaired t test, *p < 0.05, **p < 0.01, ***p < 0.001). NS, not significant.
Figure 7
Figure 7
IFITM1 Has Anti-Viral Properties and Partly Restricts MV Infection (A) Cell viability of 5H cells and IFITM1-overexpressing 5H cells was assessed by trypan blue exclusion at 24 and 48 hpi with MV-NSe (MOI of 1.0). Data are expressed as a percentage of cell killing by MV relative to mock-infected control cells (n = 3). (B) MV-N gene expression measured by qRT-PCR at 24 hpi. Results shown are relative to GAPDH and normalized to mock-infected control cells (n = 3). (C) Representative fluorescence microscopy images of MV-GFP-infected non-transduced and 5H-IFITM1 cells. Scale bars, 300 μm. (D) IFITM1 mRNA expression was measured by qRT-PCR at 24 hpi. Results shown are relative to GAPDH and normalized to mock-infected control cells (n = 3). All data are expressed as mean ± SEM (unpaired t test, *p < 0.05, **p < 0.01, ***p < 0.001). MV, measles virus; UI, uninfected; NS, not significant.

Similar articles

Cited by

References

    1. Prestwich R.J., Harrington K.J., Pandha H.S., Vile R.G., Melcher A.A., Errington F. Oncolytic viruses: a novel form of immunotherapy. Expert Rev. Anticancer Ther. 2008;8:1581–1588. - PMC - PubMed
    1. Msaouel P., Opyrchal M., Dispenzieri A., Peng K.W., Federspiel M.J., Russell S.J., Galanis E. Clinical trials with oncolytic measles virus: current status and future prospects. Curr. Cancer Drug Targets. 2018;18:177–187. - PMC - PubMed
    1. Moss W.J., Griffin D.E. Global measles elimination. Nat. Rev. Microbiol. 2006;4:900–908. - PMC - PubMed
    1. Naniche D., Varior-Krishnan G., Cervoni F., Wild T.F., Rossi B., Rabourdin-Combe C., Gerlier D. Human membrane cofactor protein (CD46) acts as a cellular receptor for measles virus. J. Virol. 1993;67:6025–6032. - PMC - PubMed
    1. Dörig R.E., Marcil A., Chopra A., Richardson C.D. The human CD46 molecule is a receptor for measles virus (Edmonston strain) Cell. 1993;75:295–305. - PubMed

Publication types