. 2020 Nov;72(5):1682-1700.
doi: 10.1002/hep.31196. Epub 2020 Oct 1.

Reciprocal Regulation Between Forkhead Box M1/NF-κB and Methionine Adenosyltransferase 1A Drives Liver Cancer

Affiliations

Reciprocal Regulation Between Forkhead Box M1/NF-κB and Methionine Adenosyltransferase 1A Drives Liver Cancer

Yuan Li et al. Hepatology. 2020 Nov.

Abstract

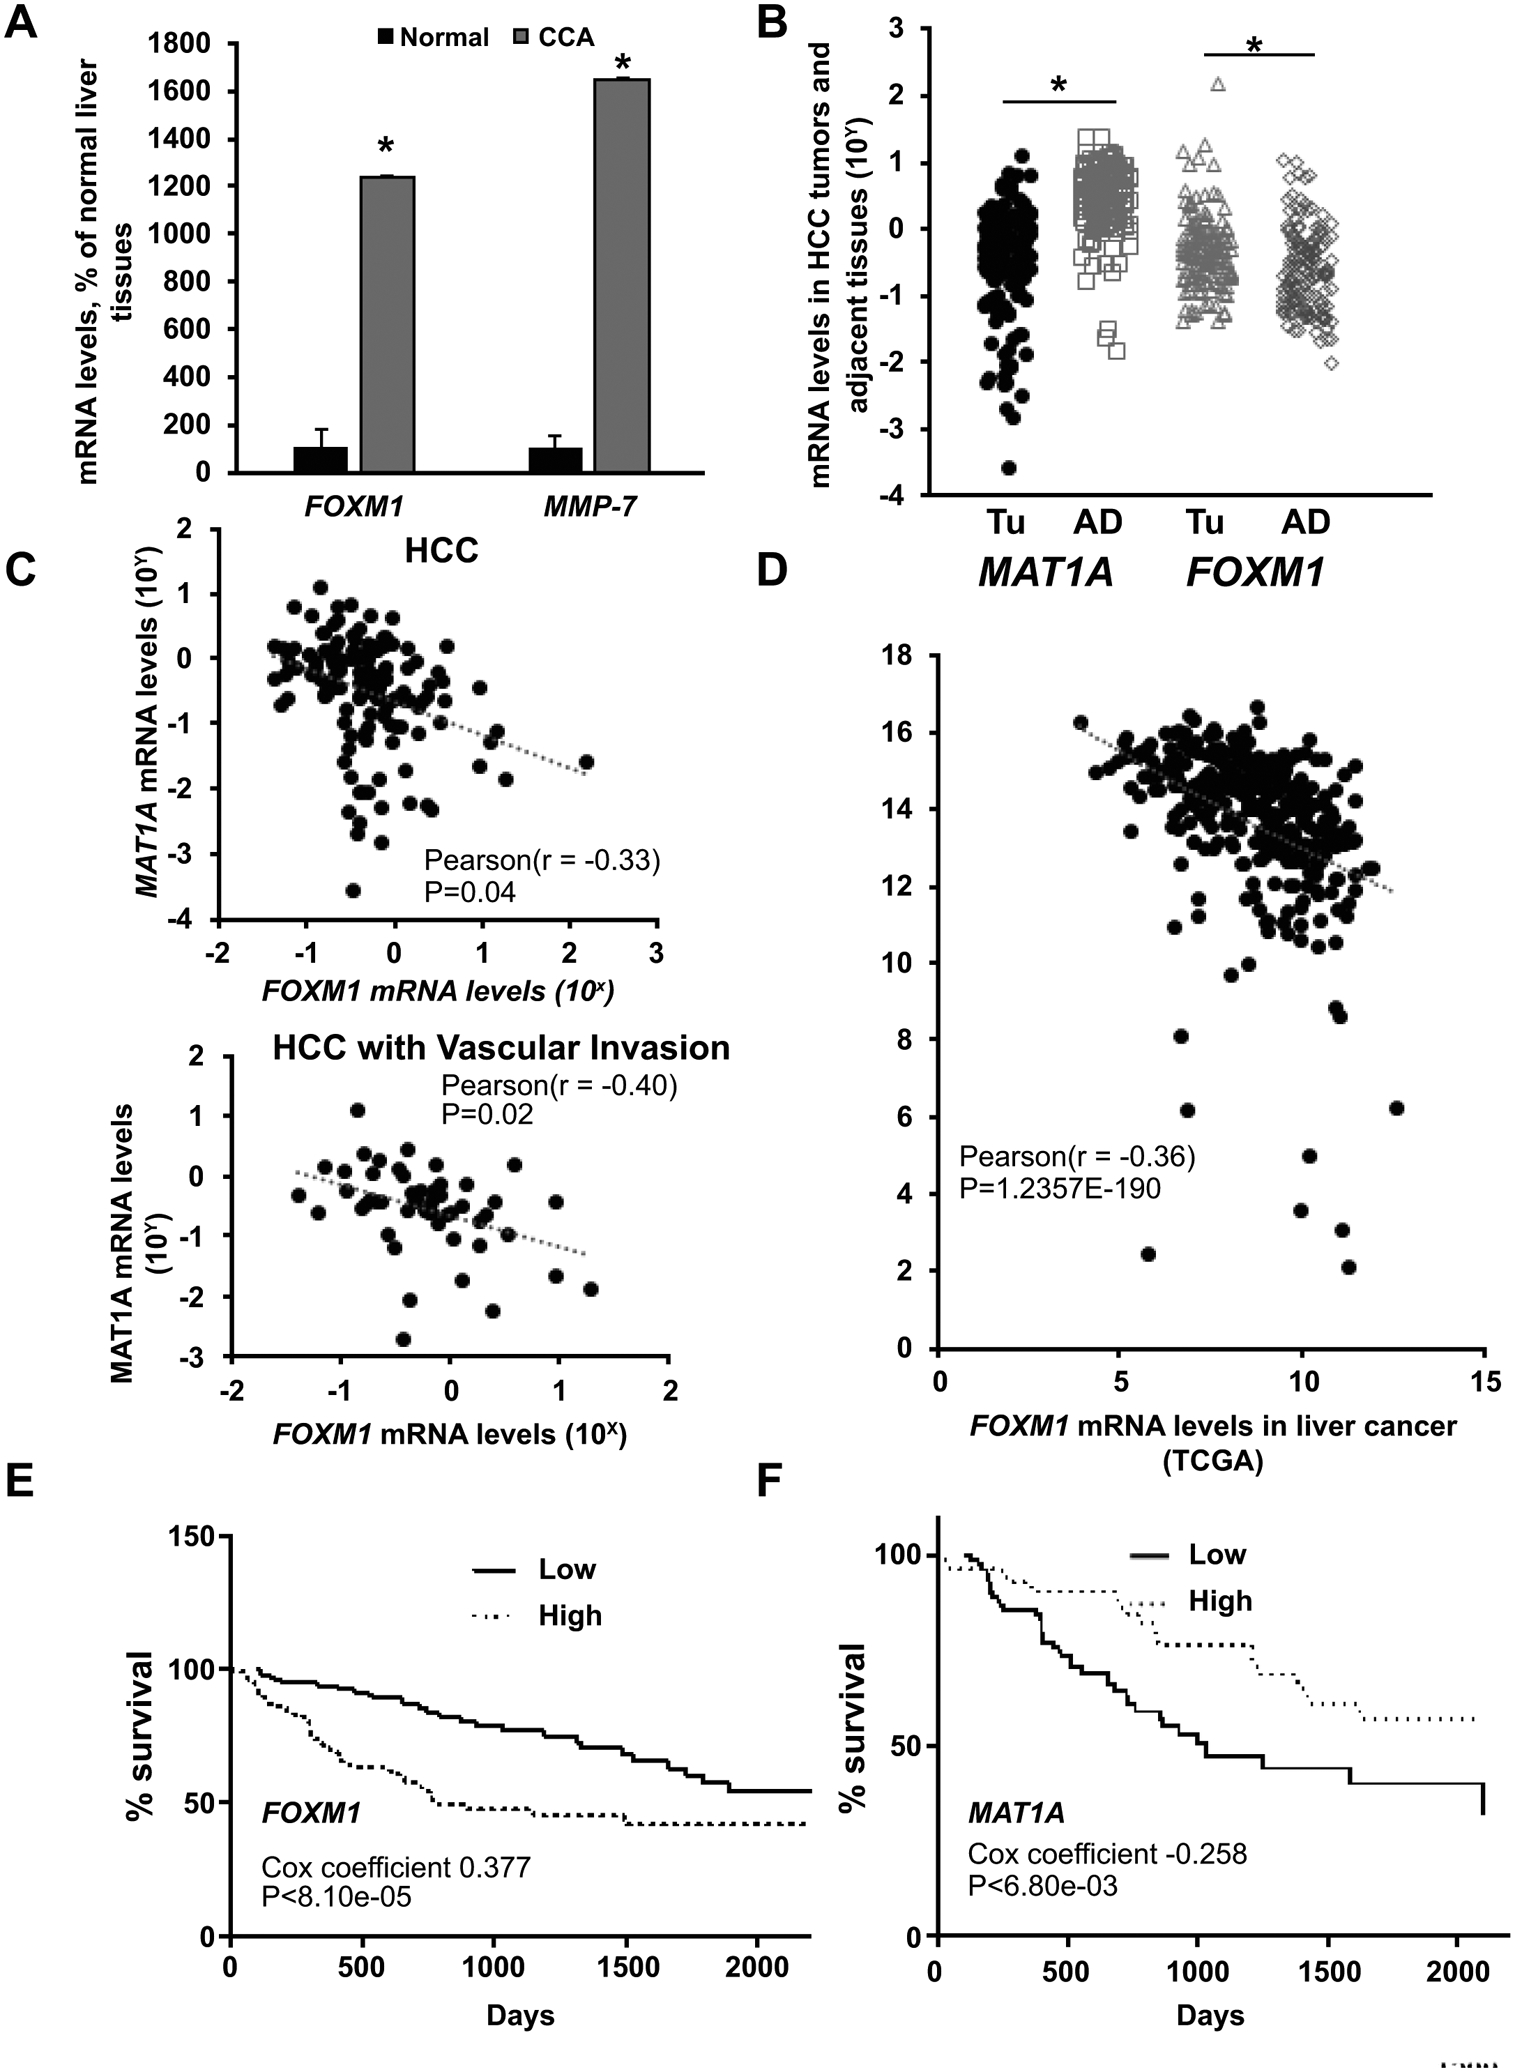
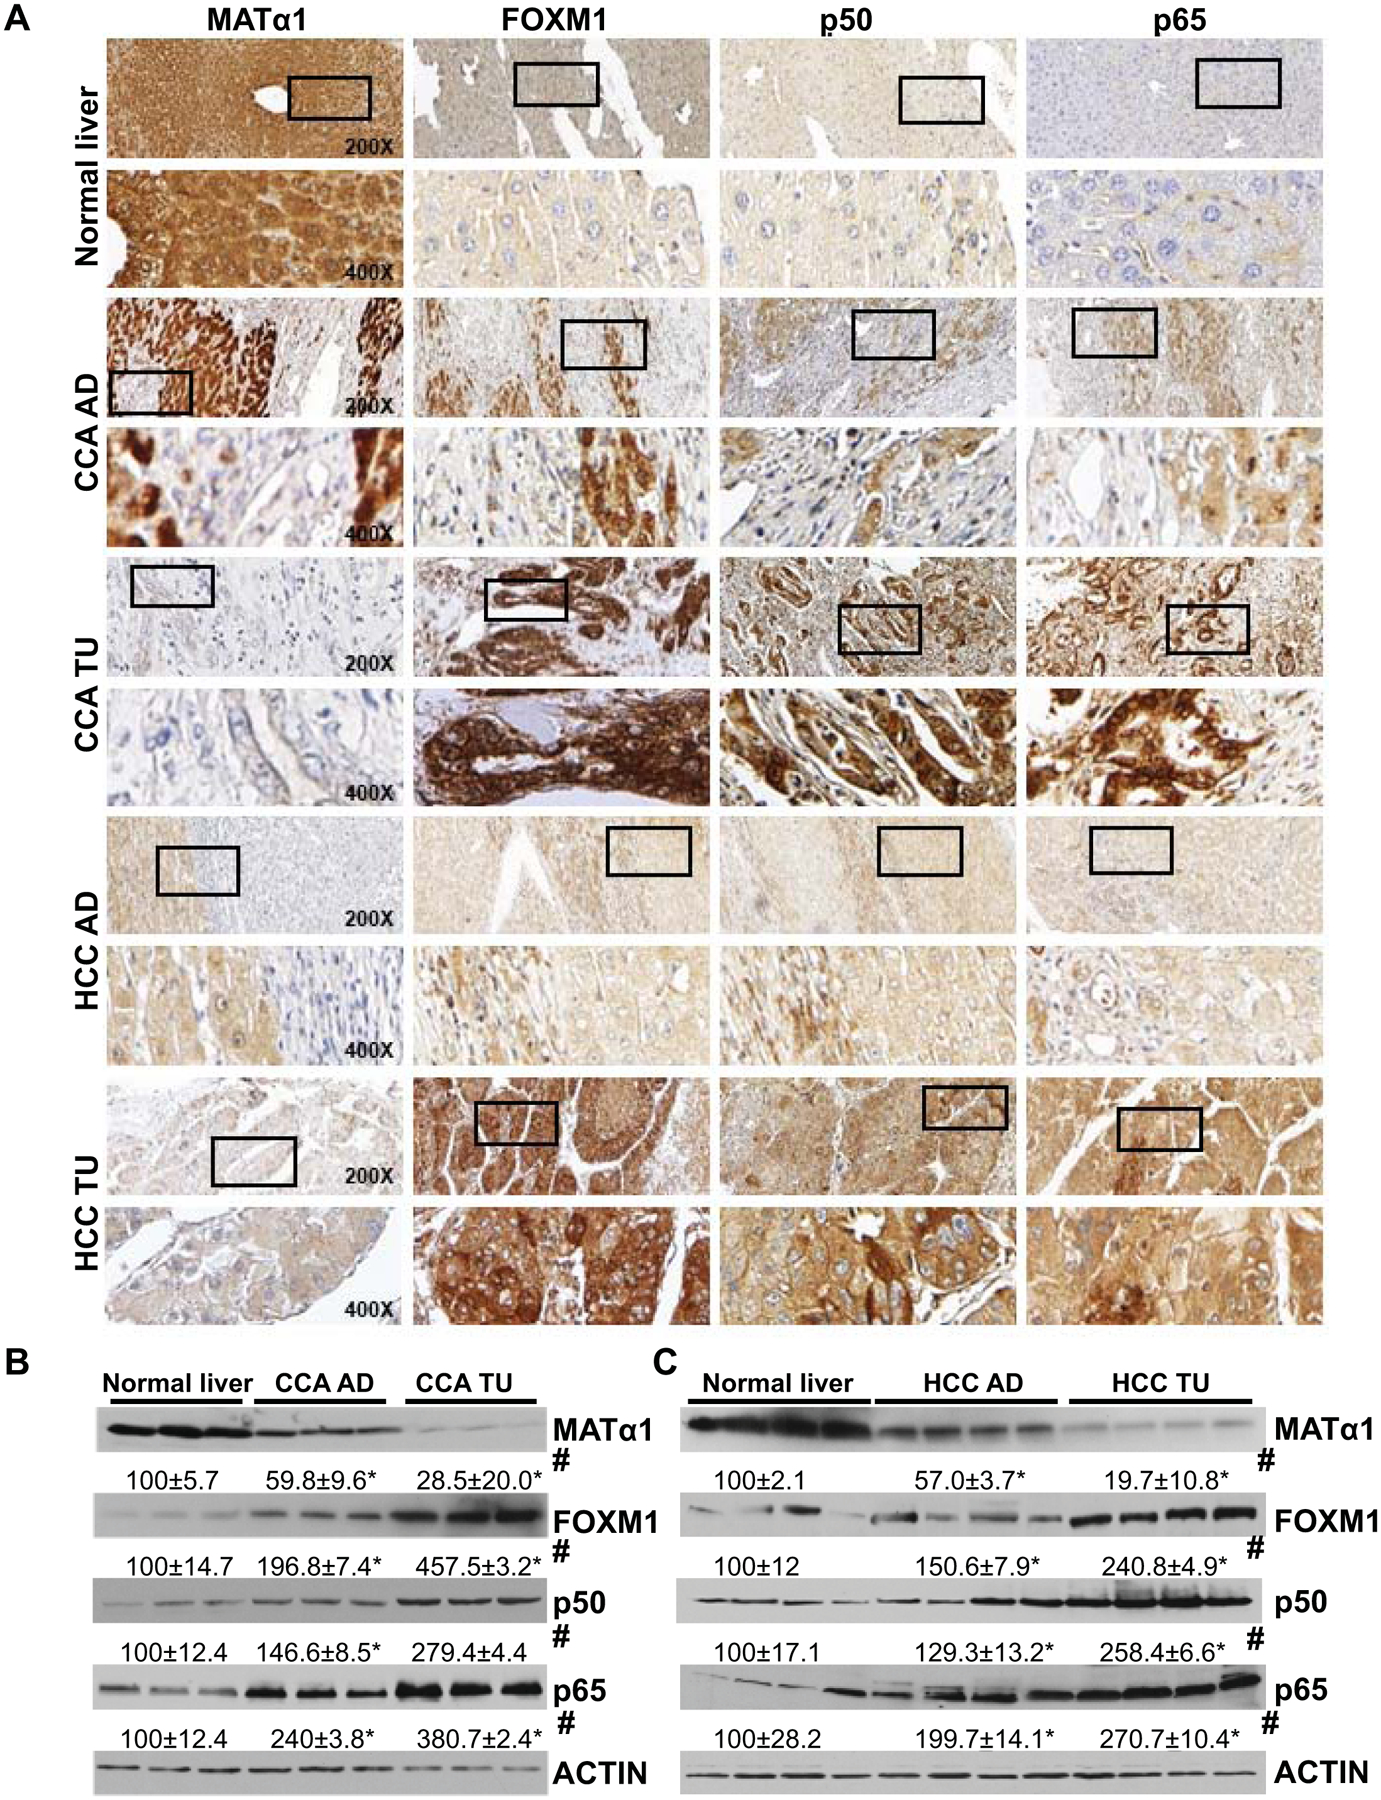
Background and aims: Forkhead box M1 (FOXM1) and nuclear factor kappa B (NF-ĸB) are oncogenic drivers in liver cancer that positively regulate each other. We showed that methionine adenosyltransferase 1A (MAT1A) is a tumor suppressor in the liver and inhibits NF-ĸB activity. Here, we examined the interplay between FOXM1/NF-κB and MAT1A in liver cancer.

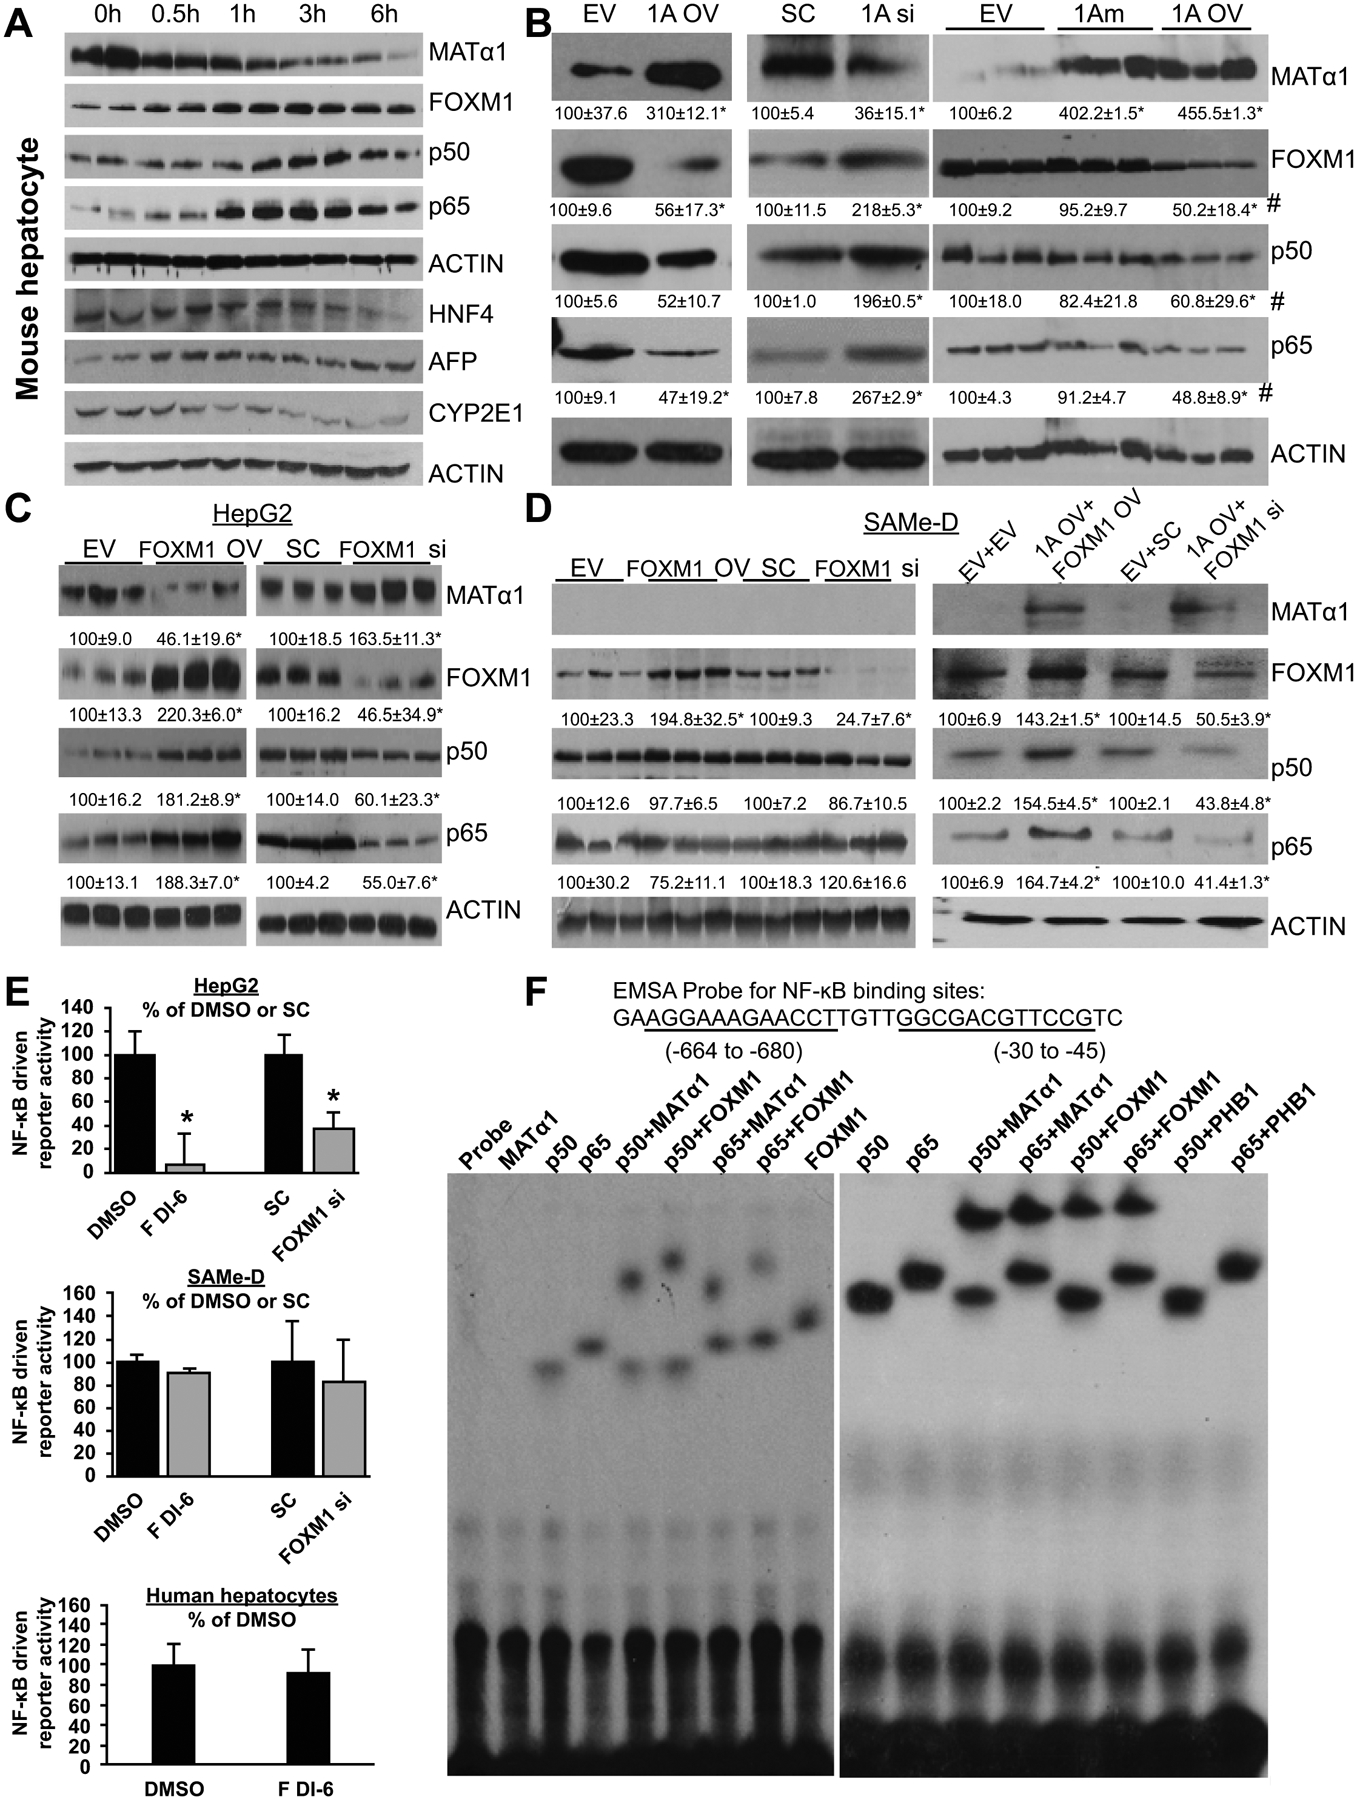
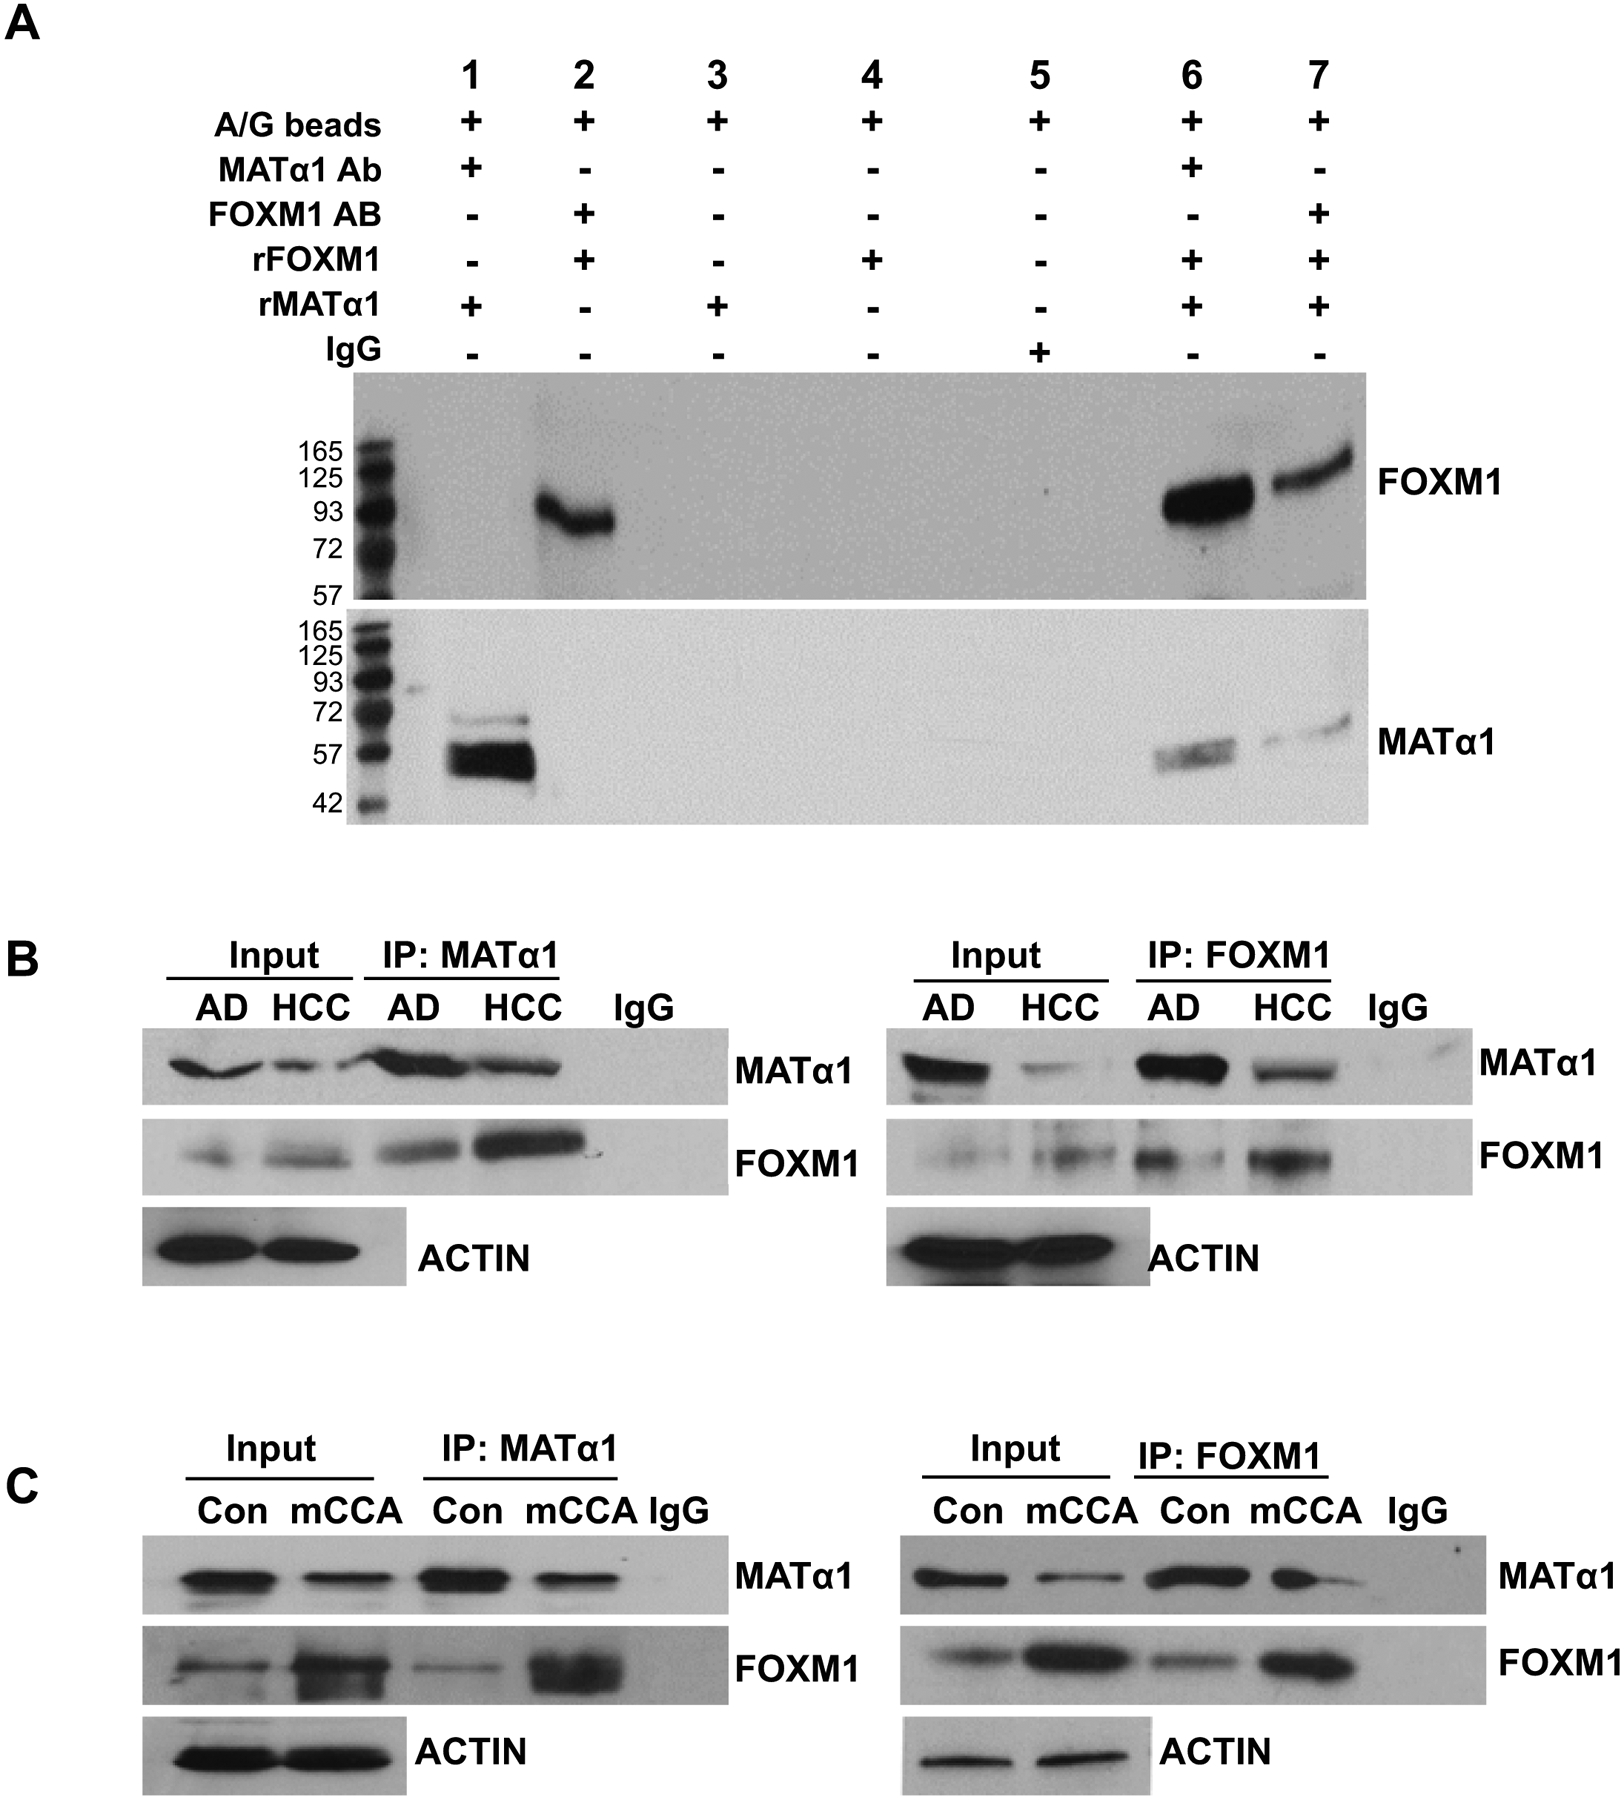
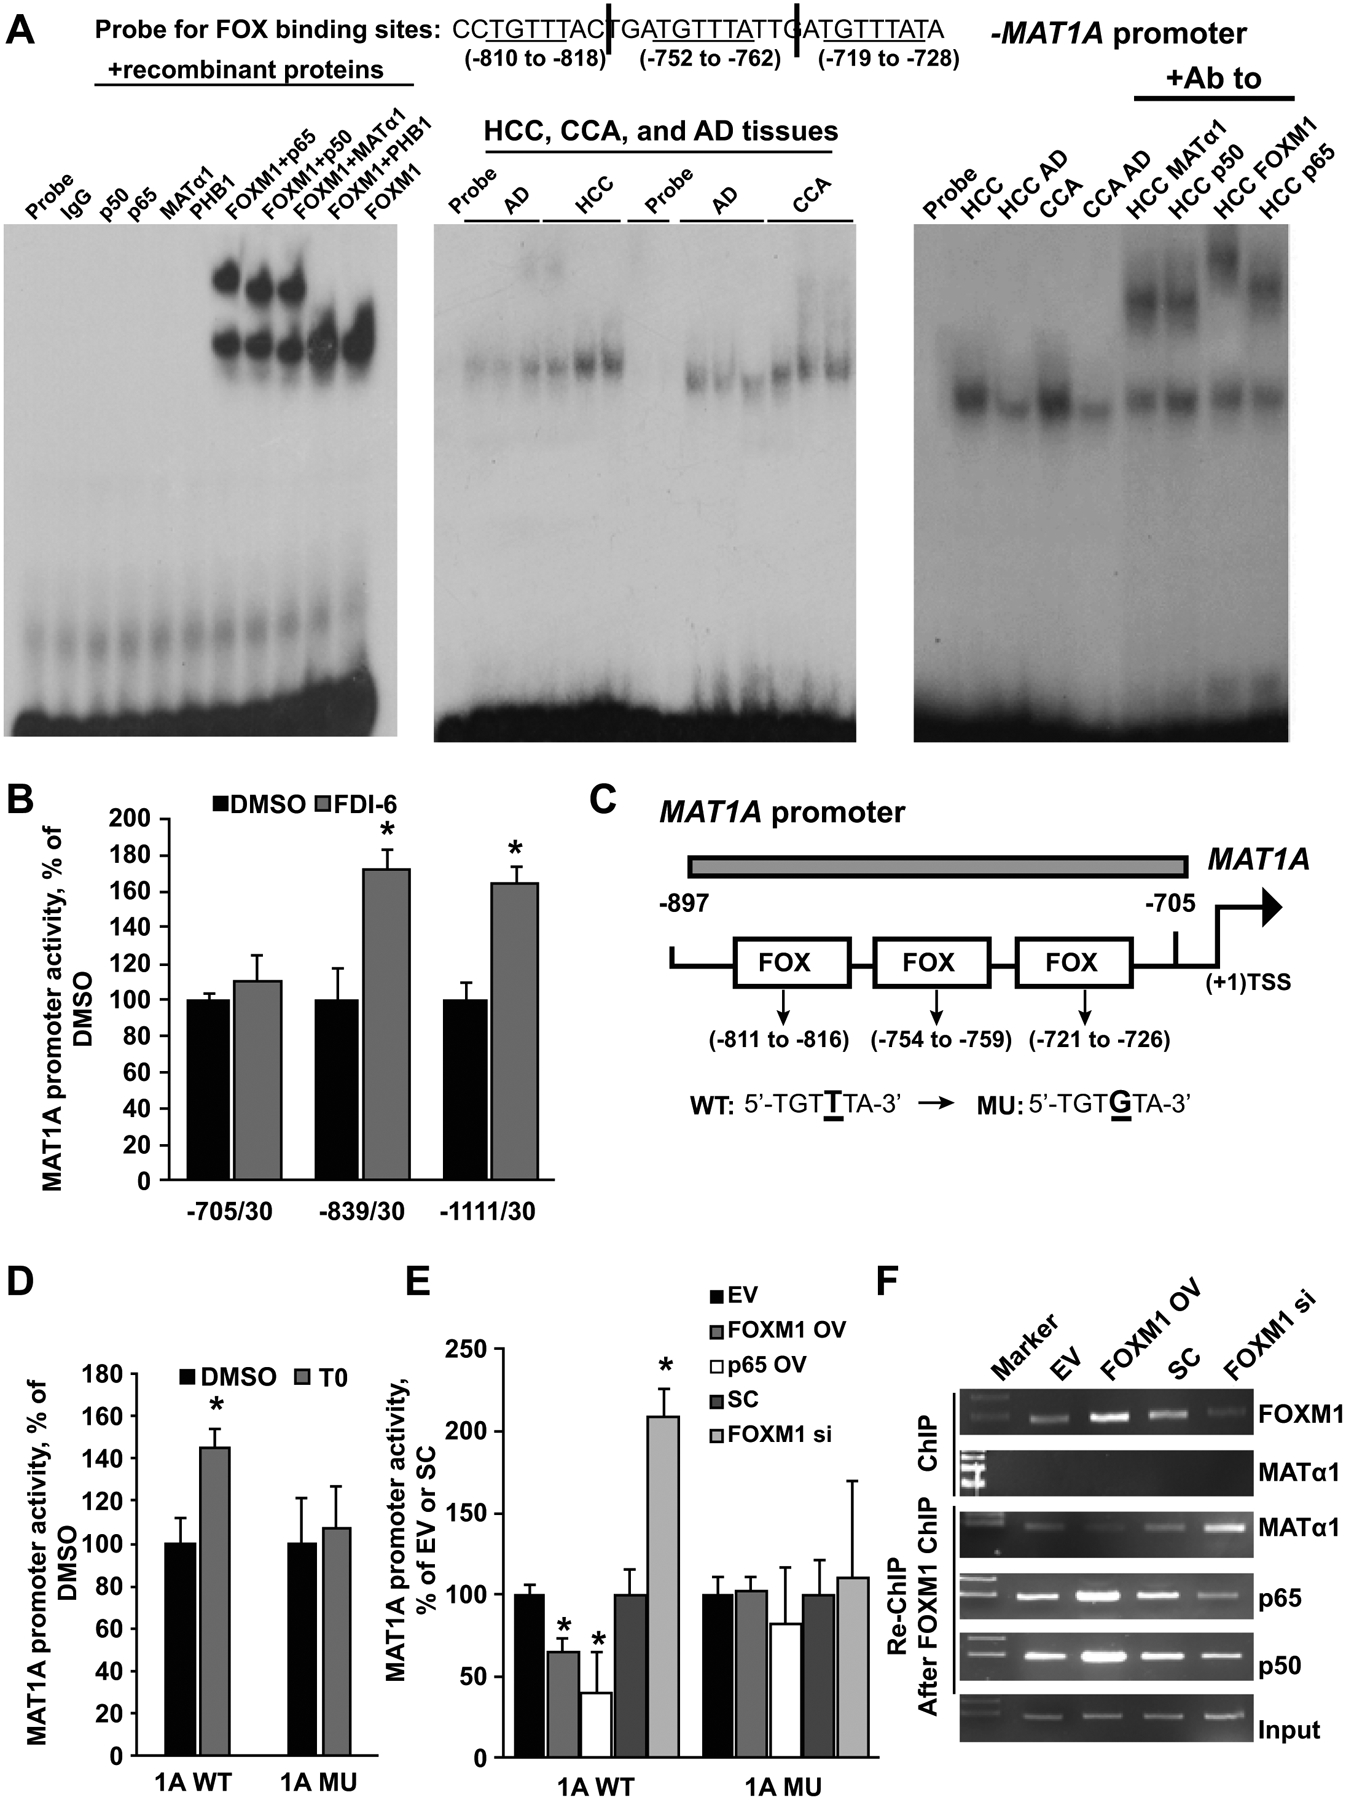
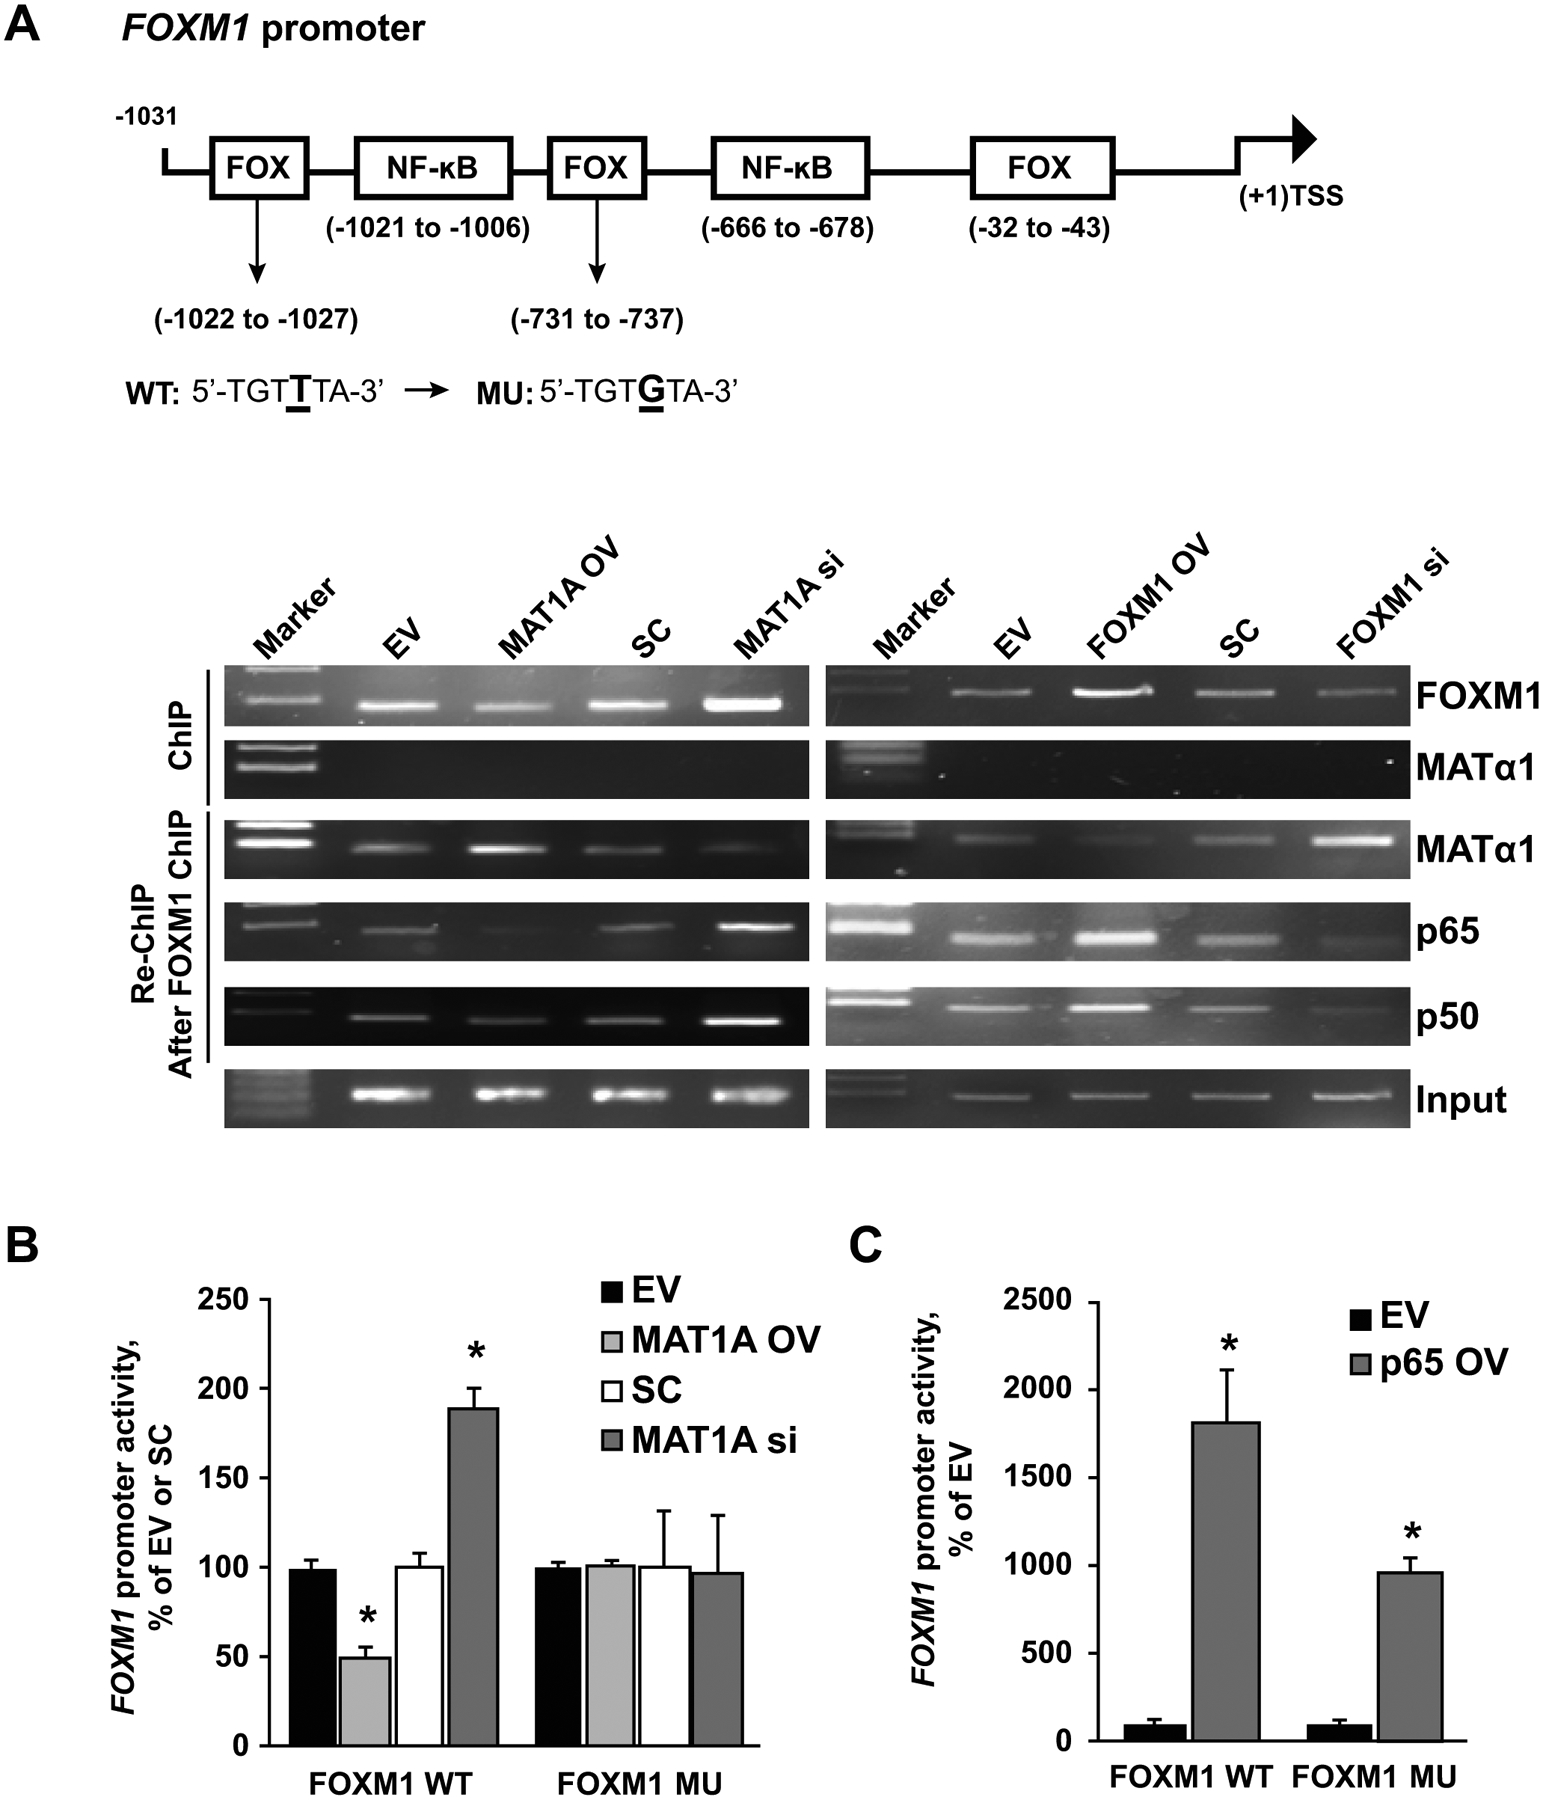
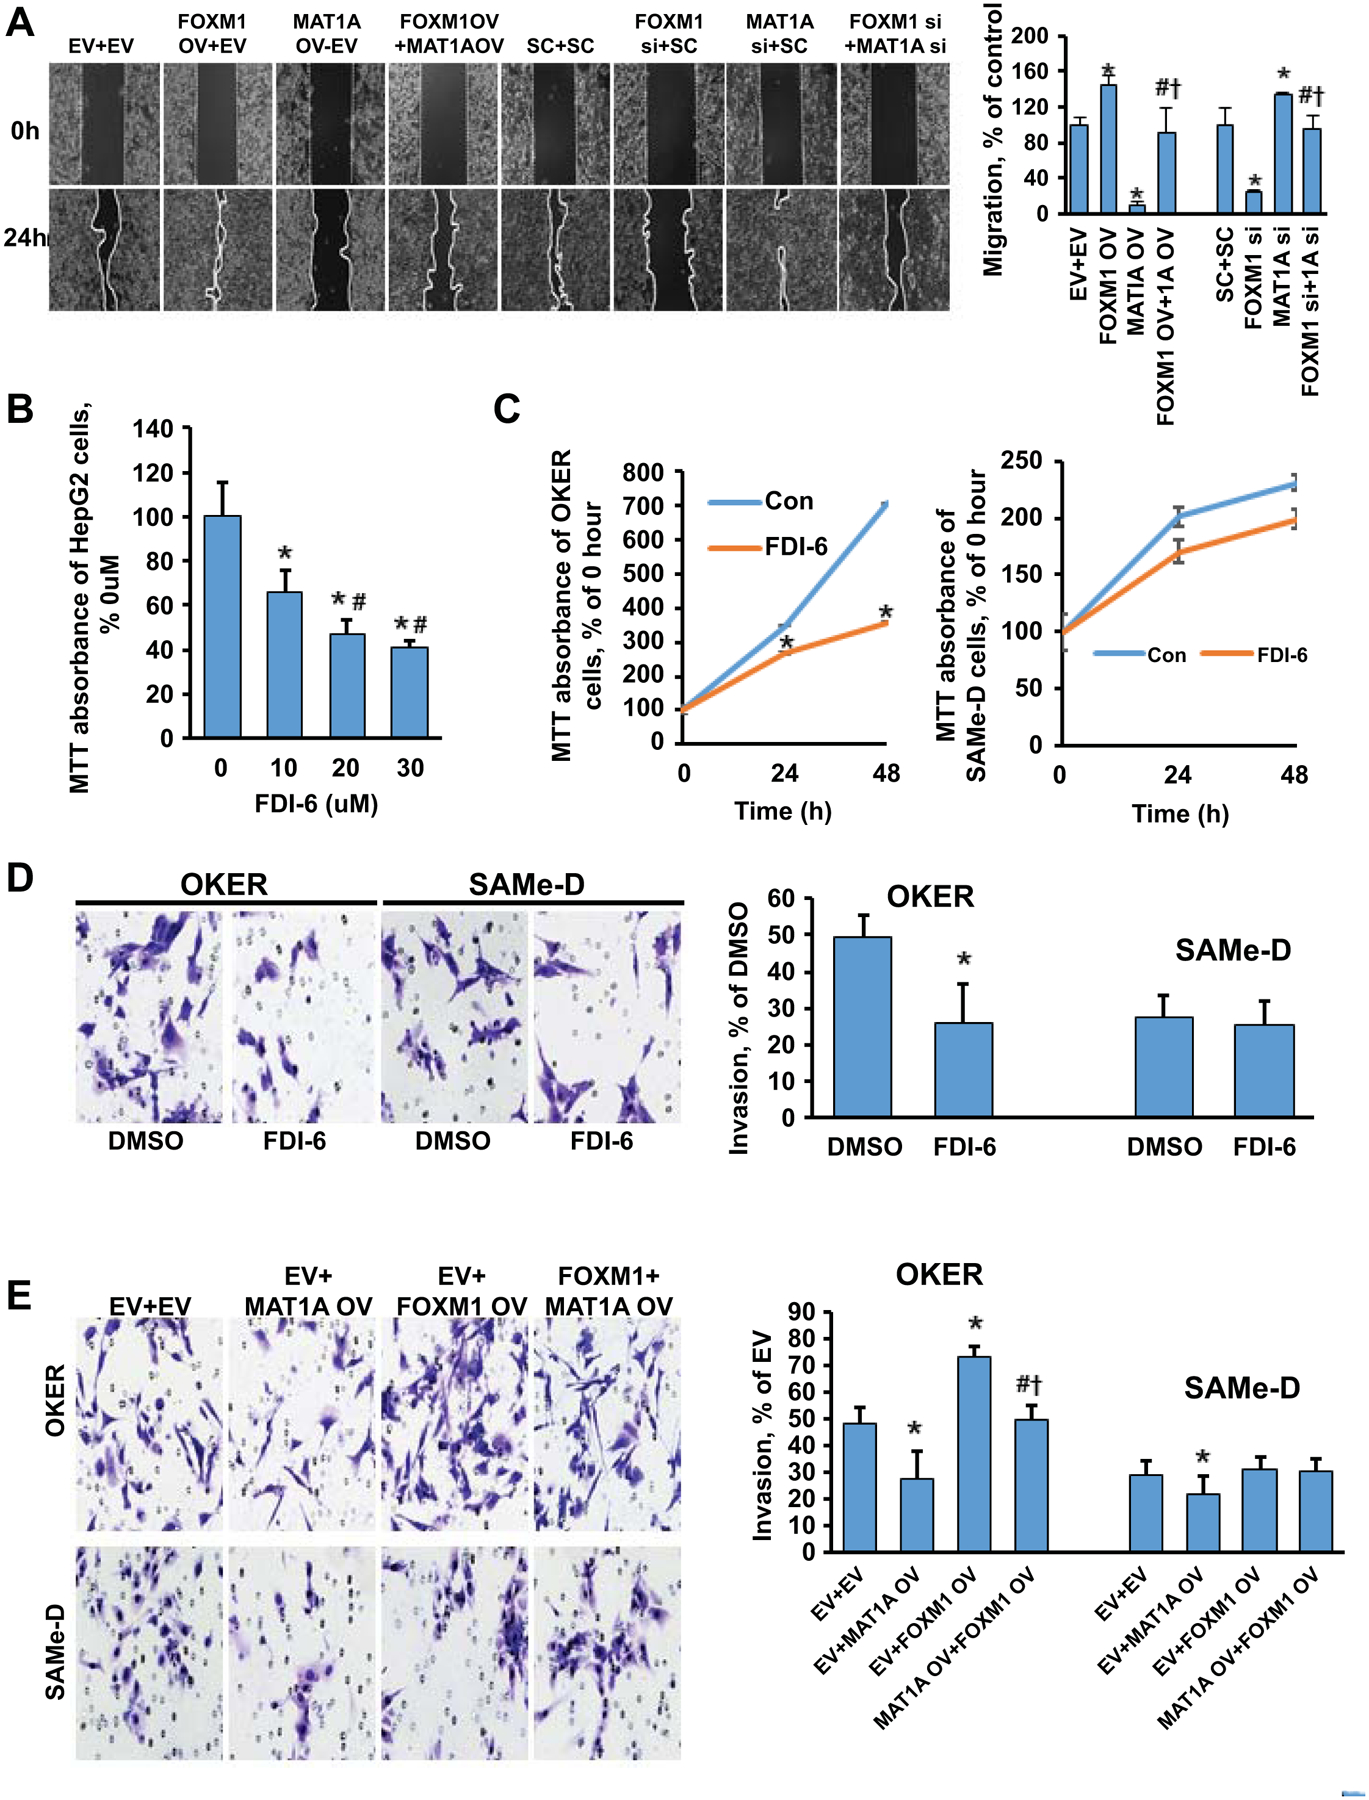
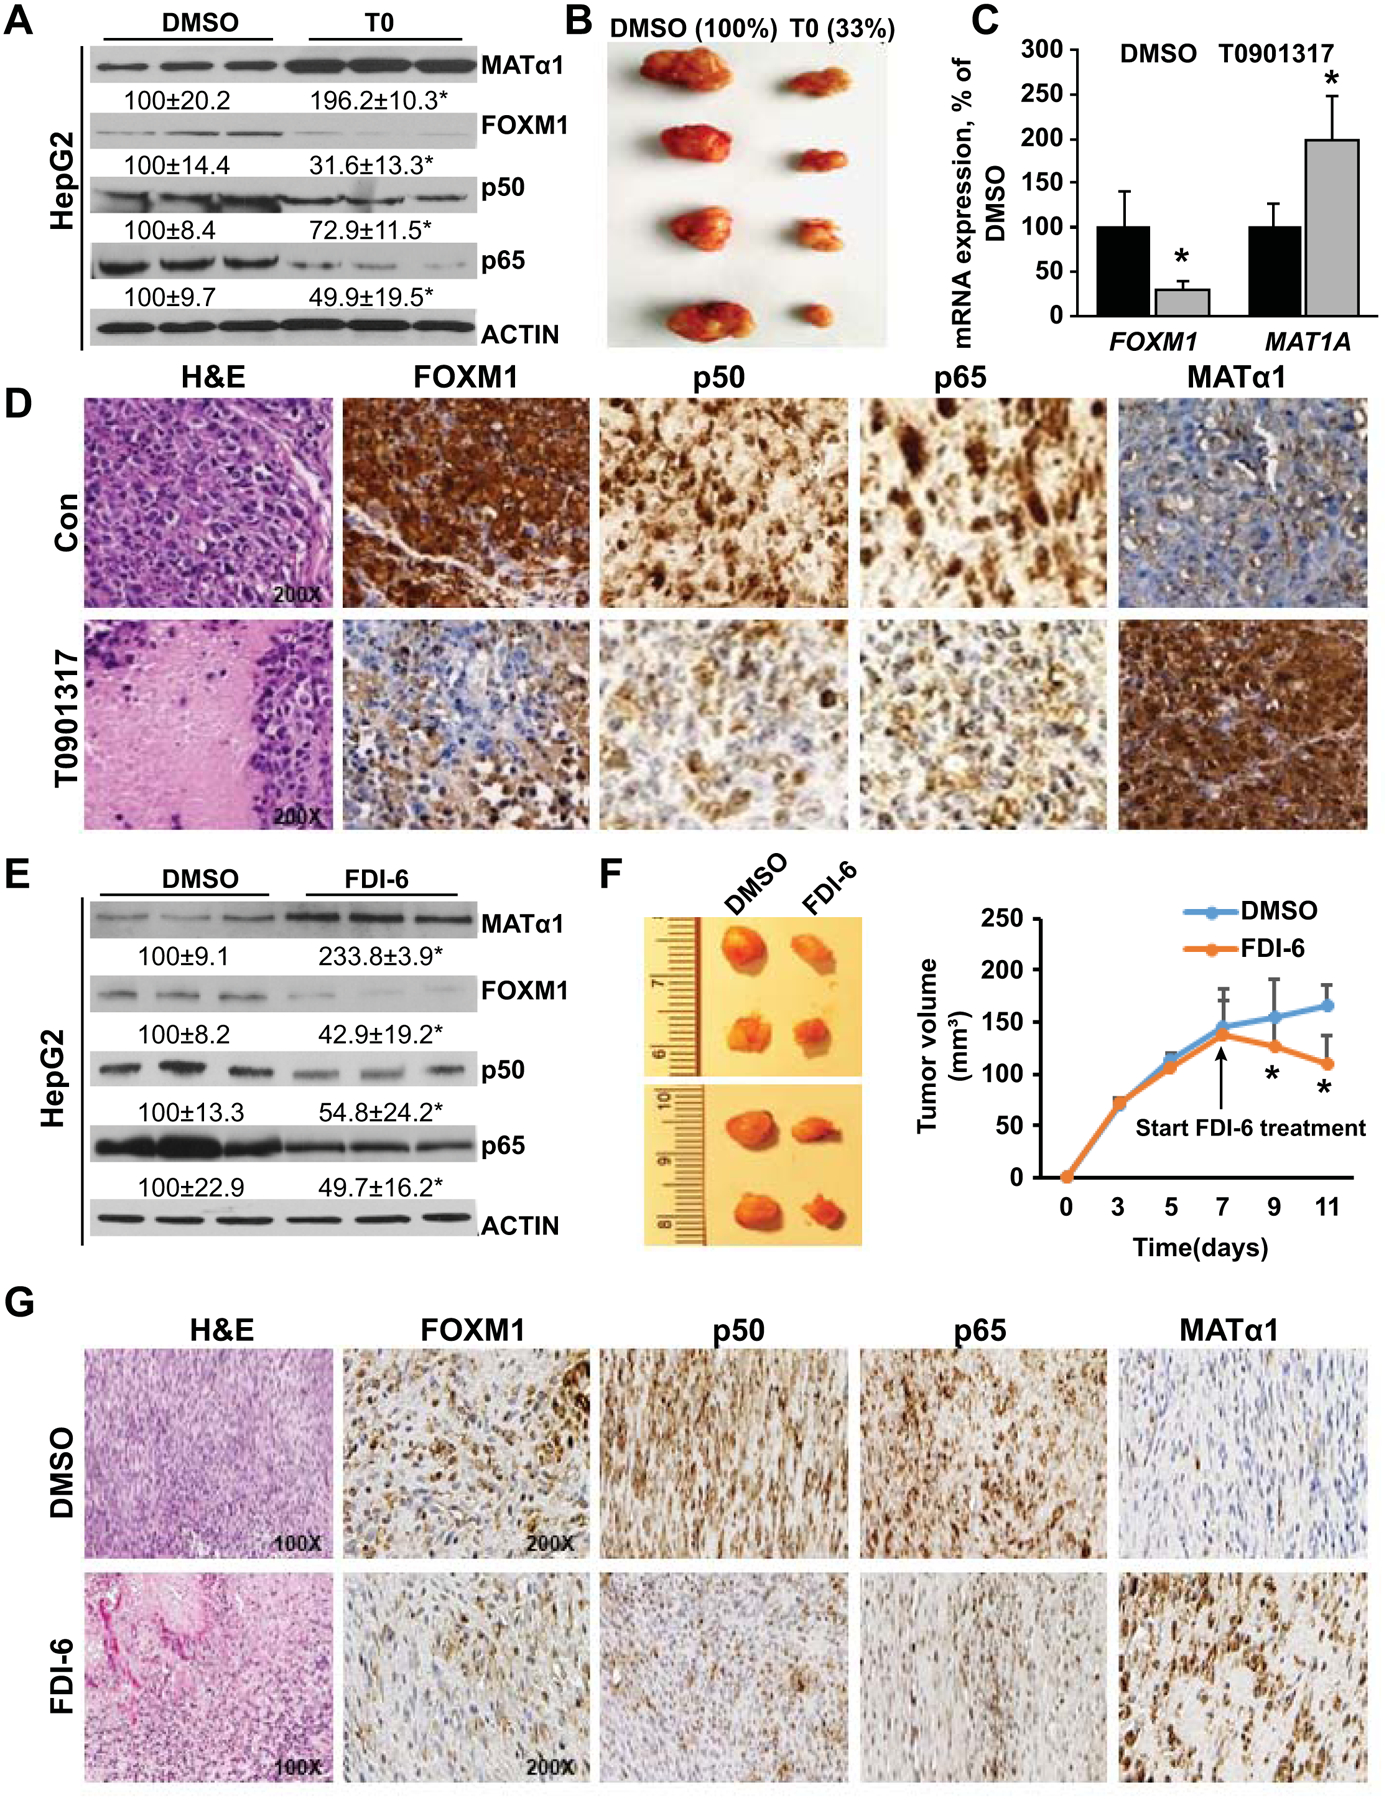
Approach and results: We examined gene and protein expression, effects on promoter activities and binding of proteins to promoter regions, as well as effects of FOXM1 inhibitors T0901317 (T0) and forkhead domain inhibitory-6 (FDI-6) in vitro and in xenograft and syngeneic models of liver cancer. We found, in both hepatocellular carcinoma and cholangiocarcinoma, that an induction in FOXM1 and NF-κB expression is accompanied by a fall in MATα1 (protein encoded by MAT1A). The Cancer Genome Atlas data set confirmed the inverse correlation between FOXM1 and MAT1A. Interestingly, FOXM1 directly interacts with MATα1 and they negatively regulate each other. In contrast, FOXM1 positively regulates p50 and p65 expression through MATα1, given that the effect is lost in its absence. FOXM1, MATα1, and NF-κB all bind to the FOX binding sites in the FOXM1 and MAT1A promoters. However, binding of FOXM1 and NF-κB repressed MAT1A promoter activity, but activated the FOXM1 promoter. In contrast, binding of MATα1 repressed the FOXM1 promoter. MATα1 also binds and represses the NF-κB element in the presence of p65 or p50. Inhibiting FOXM1 with either T0 or FDI-6 inhibited liver cancer cell growth in vitro and in vivo. However, inhibiting FOXM1 had minimal effects in liver cancer cells that do not express MAT1A.

Conclusions: We have found a crosstalk between FOXM1/NF-κB and MAT1A. Up-regulation in FOXM1 lowers MAT1A, but raises NF-κB, expression, and this is a feed-forward loop that enhances tumorigenesis.


Figures

Figure 1.
Figure 1.. FOXM1 and MAT1A mRNA levels in HCC and CCA, and their influences on survival curves in HCC.
A) Relative FOXM1 and MMP-7 mRNA levels from seven patients with CCA compared to normal liver tissues. *p < 0.05 vs. normal human liver tissues. B) Relative MAT1A and FOXM1 mRNA levels from 143 patients with HCC (TU) compared to adjacent non-tumorous tissues (AD). *p < 0.05 vs. AD. C) Pearson correlation analysis of MAT1A and FOXM1 mRNA levels in 143 HCC specimens and in 52 HCCs with vascular invasion. D) Pearson correlation analysis of FOXM1 and MAT1A mRNA levels in HCC Samples (N=366) from the Cancer Genome Atlas (TCGA) dataset. E and F) Kaplan-Meier survival curves of HCC patients from the TCGA dataset stratified into high (upper 33rd percentile, n=118) or low (lower 33rd percentile, n=118) FOXM1 (E) and MAT1A (F) mRNA levels.
Figure 2.
Figure 2.. Protein expression of MATα1, FOXM1, p50, and p65 from HCC and CCA, adjacent and normal liver tissues.
A) Representative immunohistochemistry (IHC) staining of MATα1, FOXM1, p50, and p65 from normal liver, non-tumorous tissue adjacent to CCA (CCA-AD), CCA (CCA-TU), HCC-AD, and HCC-TU. All are at 200X magnification. Higher magnification (400X) of boxed areas is shown below for each IHC. B) MATα1, FOXM1, p50, and p65 protein levels from three pairs of CCA and adjacent tissues (CCA-AD), and three normal liver specimens on western blotting. Numbers below the blots are densitometric values, expressed as percent of normal liver. *p < 0.05. vs. normal liver; #p < 0.05 vs. adjacent tissues. C) MATα1, FOXM1, p50, and p65 protein levels in four pairs of HCC and adjacent tissues (HCC-AD), and four normal liver specimens on western blotting. *p < 0.05 vs. normal liver tissues; #p < 0.05 vs. adjacent tissues.
Figure 3.
Figure 3.. Reciprocal regulation between FOXM1/NF-κB and MAT1A.
A) Protein levels of MATα1, FOXM1, p50, p65, HNF4, AFP, CYP2E1, and ACTIN were measured using western blotting in primary mouse hepatocytes at the time of isolation (0 hour = 0h) and up to 6 hours (6h) after plating. B) Protein levels of MATα1, FOXM1, p50 and p65 after overexpressing wild type MAT1A (1A OV), catalytic mutant of MAT1A (1Am) or siRNA knockdown (1A si) as compared to empty vector (EV) or scramble (SC) controls, respectively, in HepG2 cells. Numbers below the blots are densitometric values, expressed as percent of EV or SC in mean ± SEM from three experiments. *p < 0.05 vs. EV or SC; #p<0.05 vs. 1Am. C-D) Protein levels of MATα1, FOXM1, p50, and p65 after FOXM1 expression (FOXM1 OV) or siRNA knockdown (FOXM1 si) in HepG2 (C) and SAMe-D cells, which were also co-transfected with EV or MAT1A (D). Numbers below the blots are densitometric values, expressed as percent of EV or SC. Results are expressed as mean percent of control ± SEM from three experiments. *p < 0.05 vs. respective controls. E) Effect of FOXM1 siRNA or FDI-6 on NF-κB-driven promoter activity after 24h treatment in HepG2, SAMe-D cells, and human hepatocytes. *p < 0.05 FDI-6 vs. DMSO or FOXM1 si vs. SC. F) EMSA was performed by using a 32-bp double-stranded synthetic DNA containing two NF-κB motifs of the FOXM1 promoter and recombinant MATα1, p50, p65, FOXM1, PHB1 (all 100ng) alone or combined. The probe only served as a negative control. Results represent a total of at least 3 independent experiments.
Figure 4.
Figure 4.. Interaction between FOXM1 and MATα1.
A) In vitro pull-down assay using immobilized recombinant MATα1 or FOXM1 and Immunoblot (IB) for MATα1 and FOXM1. B) Western blotting and co-immunoprecipitation (Co-IP) were used to detect MATα1 and FOXM1 protein levels and their interactions in human HCC and adjacent tissues (AD). C) MATα1 and FOXM1 protein levels and their interactions in mouse CCA and control livers.
Figure 5.
Figure 5.. FOXM1 and NF-κB regulate MAT1A expression through FOX binding sites.
A) EMSA was done using labeled probes containing three FOX binding motifs of the MAT1A promoter as shown above and 100ng of recombinant FOXM1, MATα1, p50, p65, PHB1 alone or combined (left panel), nuclear proteins (0.2μg) from HCC, CCA, and respective adjacent non-tumorous tissues (AD) (middle panel), and with supershift using antibodies to MATα1, p50, FOXM1, and p65 (right panel). Results represent three or more independent experiments. Probe and IgG only served as negative controls. B) MAT1A promoter activity was measured in HepG2 cells following transient transfection with serial deletion constructs. Cells were treated during the last 24 hours of the transfection with DMSO or FDI-6 (5μM). Results represent mean ± SEM from four experiments done in triplicates, *p < 0.05 vs. DMSO. C) FOX binding sites and their mutants in the human MAT1A promoter were created as described in Materials and Methods. D). Effect of T0 (5μM) on the wild type MAT1A promoter (−839/30, 1A WT) or MAT1A promoter mutated at the FOX binding sites (1A MU) in HepG2 cells. Results represent mean ± SEM from four experiments done in triplicates, *p < 0.05 vs. DMSO. E) Activities of wild-type (WT) and FOX binding site mutants (MU) of the MAT1A promoter after FOXM1 OV, p65 OV, or FOXM1 si treatment for 24 hours in HepG2 cells. Results represent mean ± SEM from four experiments done in triplicates, *p < 0.05 vs. EV or SC. F) ChIP analysis spanning three FOX regions with anti-FOXM1 or anti-MATα1 antibody, and ChIP with anti-FOXM1 antibody followed by re-ChIP with MATα1, p65, or p50 antibodies spanning the FOX regions as shown in C) in HepG2 cells after FOXM1 OV or siRNA treatment for 24 hours.
Figure 6.
Figure 6.. Effects of MAT1A and p65 on the FOXM1 promoter.
A) HepG2 cells were treated with MAT1A OV or si, or FOXM1 OV or si, and respective controls for 24 hours. ChIP analysis with anti-FOXM1 or MATα1 antibody, and then re-ChIP with anti-MATα1, p65, p50 antibodies after FOXM1 ChIP were performed as described in Materials and Methods. Representative results from three experiments are shown. B) Activities of the wild-type (WT) and FOX binding site mutants (MU) of the FOXM1 promoter after MAT1A OV and si treatment for 24 hours in HepG2 cell. Results are expressed as mean % of EV or SC ± SEM from three experiments done in duplicates *p < 0.05 vs. EV or. SC. C) Promoter activities of the WT and FOX binding site MU of the FOXM1 promoter after p65 OV for 24 hours in the HepG2 cell. Results are expressed as mean % of EV ± SEM from three experiments done in duplicates. *p < 0.05 vs. EV. Results represent at least three independent experiments done in duplicate.
Figure 7.
Figure 7.. Effects of MAT1A and FOXM1 on cell proliferation, migration and invasion.
A) Effects of varying MAT1A and FOXM1 expressions on HepG2 cell migration. Quantitative values are summarized in the graph to the right. Results are expressed as mean % of respective controls ± SEM from three experiments done in duplicates. *p < 0.05 vs. EV+EV or SC+SC; #p < 0.05 vs. FOXM1 OV or siRNA; †p < 0.05 vs. MAT1A OV or siRNA. B) Dose-response effect of FDI-6 treatment on the MTT assay in HepG2 cells. Results are expressed as mean % of DMSO ± SEM from three experiments done in duplicates. *p < 0.05 vs. DMSO; #p < 0.05 vs FDI-6 (10uM). C) Time-dependent effect of FDI-6 (5uM) treatment on the MTT assay in OKER and SAMe-D cells. Results are expressed as mean % of DMSO ± SEM from three experiments done in duplicates. *p < 0.05 vs. DMSO. D) Representative invasion images of OKER and SAMe-D cells after FDI-6 (5uM) treatment. Quantitative analysis is summarized in the graph to the right. Results are expressed as mean % of DMSO ± SEM from three experiments done in duplicates. *p < 0.05 vs. DMSO. E) Effects of varied MAT1A and FOXM1 expressions on OKER (Top) and SAMe-D (Bottom) cell invasion. Quantitative values are summarized to the right of the invasion images. Results are expressed as mean % of EV ± SEM from three experiments done in duplicates. *p < 0.05 vs. EV+EV; #p < 0.05 vs. EV+MAT1A OV; †p<0.05 vs. EV+FOXM1 OV.
Figure 8.
Figure 8.. Effects of T0 and FDI-6 on expression of MATα1, FOXM1, p50 and p65, and tumor growth.
A) MATα1, FOXM1, p50, and p65 levels after T0 treatment (5μM) in HepG2 cells. Results are expressed as mean % of DMSO control ± SEM from three experiments done in duplicates. *p<0.05 vs. DMSO. B) Representative pictures of liver xenograft tumors at day 28 after injection of HepG2 cells in DMSO (left) and T0 treatment (right) groups. Results are expressed as mean % of DMSO from n=8 per group. C) FOXM1 and MAT1A mRNA levels from T0 (25 mg/kg/d) or DMSO treated xenograft tumor tissues. Results are expressed as mean % of control ± SEM from eight mice/group. D) Representative H&E and IHC pictures are shown from n = 8 each. Original magnification for H&E and IHCs is X200. E) Protein expression of MATα1, FOXM1, p50, and p65 after FDI-6 treatment in HepG2 cells. Results are expressed as mean % of control ± SEM from three experiments done in triplicates. *p < 0.05 vs. DMSO. F) Representative pictures of liver syngeneic tumors at day 11 after injection of OKER cells in DMSO (left) and FDI-6 treatment (right, 25 mg/kg/d started on day 7) groups. Tumor volumes are summarized in the graph to the right. Results are expressed as mean of control ± SEM from eight mice/group. *p < 0.05 vs. DMSO. G) Representative H&E and IHC of syngeneic tumors treated with DMSO or FDI-6 from day 7 after injection and sacrificed at day 11. Original magnification for H&E is X100, and X200 for all IHC.

Similar articles

Cited by

References

    1. Wierstra I FOXM1 (Forkhead box M1) in tumorigenesis: overexpression in human cancer, implication in tumorigenesis, oncogenic functions, tumor-suppressive properties, and target of anticancer therapy. Adv Cancer Res. 2013;119:191–419. - PubMed
    1. Yu M, Tang Z, Meng F, Tai M, Zhang J, Wang R, et al. Elevated expression of FoxM1 promotes the tumor cell proliferation in hepatocellular carcinoma. Tumour Biol. 2016;37:1289–97. - PubMed
    1. Koo CY, Muir KW, Lam EW. FOXM1: From cancer initiation to progression and treatment. Biochim Biophys Acta. 2012;1819:28–37. - PubMed
    1. Meng FD, Wei JC, Qu K, Wang ZX, Wu QF, Tai MH, et al. FoxM1 overexpression promotes epithelial-mesenchymal transition and metastasis of hepatocellular carcinoma. World J Gastroenterol. 2015;21:196–213. - PMC - PubMed
    1. Gormally MV, Dexheimer TS, Marsico G, Sanders DA, Lowe C, Matak-Vinković D, et al. Suppression of the FOXM1 transcriptional programme via novel small molecule inhibition. Nat Commun. 2014;5:5165. - PMC - PubMed

Publication types

MeSH terms