. 2020 Apr 16;94(9):e01597-19.
doi: 10.1128/JVI.01597-19. Print 2020 Apr 16.

Identification of Host Trafficking Genes Required for HIV-1 Virological Synapse Formation in Dendritic Cells

Affiliations

Identification of Host Trafficking Genes Required for HIV-1 Virological Synapse Formation in Dendritic Cells

Rebecca Bayliss et al. J Virol. .

Abstract

Dendritic cells (DCs) are one of the earliest targets of HIV-1 infection acting as a "Trojan horse," concealing the virus from the innate immune system and delivering it to T cells via virological synapses (VS). To explicate how the virus is trafficked through the cell to the VS and evades degradation, a high-throughput small interfering RNA screen targeting membrane trafficking proteins was performed in monocyte-derived DCs. We identified several proteins including BIN-1 and RAB7L1 that share common roles in transport from endosomal compartments. Depletion of target proteins resulted in an accumulation of virus in intracellular compartments and significantly reduced viral trans-infection via the VS. By targeting endocytic trafficking and retromer recycling to the plasma membrane, we were able to reduce the virus's ability to accumulate at budding microdomains and the VS. Thus, we identify key genes involved in a pathway within DCs that is exploited by HIV-1 to traffic to the VS.IMPORTANCE The lentivirus human immunodeficiency virus (HIV) targets and destroys CD4+ T cells, leaving the host vulnerable to life-threatening opportunistic infections associated with AIDS. Dendritic cells (DCs) form a virological synapse (VS) with CD4+ T cells, enabling the efficient transfer of virus between the two cells. We have identified cellular factors that are critical in the induction of the VS. We show that ADP-ribosylation factor 1 (ARF1), bridging integrator 1 (BIN1), and Rab GTPases RAB7L1 and RAB8A are important regulators of HIV-1 trafficking to the VS and therefore the infection of CD4+ T cells. We found these cellular factors were essential for endosomal protein trafficking and formation of the VS and that depletion of target proteins prevented virus trafficking to the plasma membrane by retaining virus in intracellular vesicles. Identification of key regulators in HIV-1 trans-infection between DC and CD4+ T cells has the potential for the development of targeted therapy to reduce trans-infection of HIV-1 in vivo.

Keywords: HIV-1; T-cell immunity; dendritic cell; host-cell interactions; virological synapse.


Figures

FIG 1
FIG 1
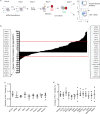
Procedure and results of the siRNA screen used to investigate trans-infection of HIV-1 between MDDCs and T cells. (a) Schematic of the method used to study the effects of siRNA knockdown on HIV-1 trans-infection between DCs and CD4+ T cells. (b) Results of siRNA screen on HIV-1 trans-infection between MDDCs and CD4+ T cells. Red dashed lines indicate the assay cutoffs of –20% and +50% for nonspecific variation of the assay. siRNA that reduced or increased HIV-1 trans-infection above or below the cutoff point (HITS) are listed in the gray boxes. (c) Identification of genes that reduced HIV-1 trans-infection between MDDCs and T cells. Results from initial screen conducted in SUPT1 cells (○) are shown in combination with repeats conducted in with autologous CD4+ T cells (●). Means and standard deviations (SD) of three independent donors shown. Only genes with a mean percentage below that of the nontarget siRNA are shown. (d) Identification of genes that increase HIV-1 trans-infection between MDDCs and T cells. Results from initial screen conducted in SUPT1 (○) cells are shown in combination with two repeats conducted with autologous CD4+ T cells (●). The means and SD for three independent donors were calculated per gene. Only genes with a mean above that of the nontarget siRNA are shown.
FIG 2
FIG 2
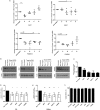
ARF1, BIN1, RAB7L1, and RAB8A regulate HIV trans-infection in DCs and T cells. (a) Validation of siRNA knockdown on trans-infection against four individual siRNAs from each candidate gene. The percentage of HIV-1 transfer is normalized to nontarget siRNA set at a value of 1.0. Each point represents an individual donor. The means ± the SD are shown. *, P < 0.05; **, P < 0.005. (b) Western blot analysis of pooled siRNA knockdown in MDDCs at 72 h posttransfection with ARF1, BIN1, RAB7L1, and RAB8A siRNA performed in triplicate in untreated MDDCs and non-target siRNA. Actin is used as a loading control. (c) Densitometry quantification of protein expression levels for ARF1, BIN1, RAB7L1, and RAB8A. The protein expression levels for siRNA-transfected MDDCs were normalized to an actin loading control. All values are relative to nontarget siRNA-transfected lanes (set at 1.0). The means ± the SD are shown (n = 3). (d) Effects of final target siRNA on HIV-1 trans-infection with CXCR4 (R9). The reduction in viral transfer was measured relative to nontarget siRNA. The means and SD are shown for each sample (n = 5). *, P < 0.05; **, P < 0.005. (e) Effects of final target siRNA on HIV-1 trans-infection with CCR5 (R8Bal). The reduction in viral transfer was measured relative to nontarget siRNA. The means and SD are shown for each sample (n = 5). *, P < 0.05; **, P < 0.005. (f) The effects of ARF1, BIN1, RAB7L1, and RAB8A siRNA transfection on the viability of MDDCs at 48 h posttransfection. All samples compared to untreated MDDCs. Cell viability is shown as a percentage. The means ± the SD are shown (n = 2).
FIG 3
FIG 3
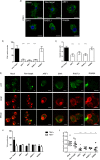
ARF1, BIN1, RAB7L1, and RAB8A are regulators virological synapse formation between HIV-1 infected MDDCs and CD4+ T cells. (a) Images of CXCR4 HIV-1 R9 (p24 green)-infected, siRNA-transfected MDDCs interacting with CD4+ T cells (identified by an asterisk [*]). Actin, red; nuclei, blue. Scale, 10 μm. (b) Quantification of virological synapse formation between MDDCs and CD4+ T cells was counted in siRNA-transfected MDDCs infected with HIV-1 R9 and cocultured with autologous CD4+ T cells. T cells are identified as the smaller cells with less cytoplasmic content compared to the larger MDDCs in coculture. Data were normalized to MDDCs transfected with nontarget siRNA. The means and SD for three independent donors (n = 500 cells) are shown. *, P < 0.05; **, P < 0.005. (c) Images of CCR5 HIV-1 R8BAL (p24 green)-infected, siRNA-transfected MDDCs interacting with CD4+ T cells (identified by an asterisk [*]). Actin, red; nuclei, blue. Scale, 10 μm. (d) Quantification of virological synapse formation between MDDCs and CD4+ T cells was performed in transfected MDDCs infected with HIV-1 R8BAL and cocultured with autologous CD4+ T-cells. Data were normalized to MDDCs transfected with nontarget siRNA. The means and SD for three independent donors (n = 300 cells) are shown. *, P < 0.05; **, P < 0.005.
FIG 4
FIG 4
CD81 localization and TEM formation is disrupted in MDDCs transfected with ARF1, BIN1, RAB7L1, and RAB8A siRNA. (a) Effects of target siRNA on CD81 staining and localization in MDDCs. CD81, green; nuclei, blue. Scale, 10 μm. (b) Quantification of CD81 vesicles in target siRNA transfected MDDCs compared to nontarget siRNA controls (n = 110 cells, across three independent donors). Means and standard errors of the mean (SEM) are shown. ***, P < 0.0005. (c) Average sizes (μm) of CD81-positive vesicles in MDDCs transfected with target siRNA compared to nontarget siRNA (n = 150 cells, across three independent donors). Means and SEM are shown. **, P < 0.005; ***, P < 0.0005. (d) Images of CD81 (red) and HIV-1 p24 Gag (green) in infected MDDCs transfected with nontarget and target siRNA. Images show HIV-1 at 4 h postinfection. Nuclei, red (spherical). Scale, 10 μm. (e) Quantification of CD81 and p24 at tetraspanin-enriched domains (TEMs) in infected MDDCs at 4 h postinfection. The mean percentages of cells with HIV-1 p24 Gag localized at CD81-enriched TEMs are represented by black bars. White bars represent the absence of CD81-enriched TEMs. Mean percentages and SD are shown (n = 170 cells, across two independent donors). (f) Colocalization analysis of TEM in siRNA-transfected MDDCs compared to control cells. The colocalization coefficient of CD81 with HIV-1 p24 Gag is shown for each condition. Means ± the SEM are shown (n = 11 fields, analyzed over two independent donors). **, P < 0.005; ***, P < 0.0005.
FIG 5
FIG 5
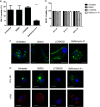
Retention of virus in endocyte-derived compartments reduces HIV trans-infection from DCs to T cells. (a) Effect of LY294002 and bafilomycin A1 treatment on HIV-1 transfer. MDDCs were pretreated with inhibitors overnight prior to infection with HIV-1 (R9) before coculture with autologous CD4+ T cells for 48 h in triplicate in two independent donors. Mean percentages (%) viral transfer and SD are shown. ***, P < 0.0005. (b) Percentage of viable MDDCs after overnight incubation with LY294002 and bafilomycin A1 at 0, 2, and 48 h postinfection (pi). The percentage (%) of reduction in cell viability was assessed by using a Live/Dead stain and flow cytometry analysis. The means and SD are shown. Experiments performed in triplicate in two independent donors. (c) Effect of inhibitor LY294002 and bafilomycin A1 on HIV-1 localization in MDDCs. MDDCs pretreated with inhibitors were infected with HIV-1 for analysis by confocal microscopy. p24 Gag HIV-1 (green) and nuclei (blue) are labeled as indicated. Scale, 10 μm. (d) Effect of LY294002 and bafilomycin A1 on LDL-DIL and HRP uptake into MDDCs. Inhibitors were added overnight before the addition of LDL-DIL (green) and HRP (red). Nuclei are blue. Scale, 10 μm.
FIG 6
FIG 6
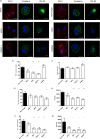
Endocytic trafficking is compromised in BIN1, RAB7L1, and RAB8A transfected MDDCs. The effect of target siRNA on vesicle trafficking in MDDCs was investigated. (a) MDDCs transfected with ARF1, BIN-1, RAB7L1, and RAB8A siRNA for 48 h were labeled with either EEA1 for early endosomes (red, first panel) or incubated with transferrin (green, second panel) for 20 min 37°C or LDL-DIL (green, third panel) for 2 h 37°C. Nontarget siRNA was used a control. Nuclei are indicated in blue. Scale, 10 μm. (b) Quantification of EEA1 vesicles in MDDCs transfected with target siRNA compared to nontarget siRNA control (n = 150 cells). Means and SEM from three independent donors are shown. **, P < 0.005; ***, P < 0.0005. (c) Average EEA1 vesicle sizes (μm) in MDDCs transfected with target siRNA compared to nontarget siRNA control (n = 150 cells). Means and SEM from three independent donors are shown. ***, P < 0.0005. (d) Quantification of the number of transferrin-positive vesicles under each condition compared to nontarget control (n = 150). Means and SEM from three independent donors are shown. **, P < 0.005. (e) Measurement of the intensity of transferrin in transfected MDDCs under each condition compared to nontarget control (n = 150). Means and SEM from three independent donors are shown. ***, P < 0.0005. (f) Quantitative analysis of LDL-DIL containing vesicles (n = 120). Means and SEM from three independent donors shown. ***, P < 0.0005. (g) Intensity of LDL-DIL in transfected MDDCs compared to nontarget siRNA (n = 120). Means and SEM from three independent donors are shown. *, P < 0.05.
FIG 7
FIG 7
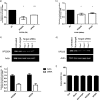
HIV-1 trans-infection requires retromer recycling to the plasma membrane. (a and b) The reduction in HIV-1 trans-infection between MDDCs and CD4+ T cells in MDDCs transfected with VPS26A and VPS35 via siRNA transfection. The reduction in trans-infection is normalized to nontarget siRNA for R9 (a) and R8-BAL (b). The means ± the SD are shown (n = 4). *, P < 0.05; ***, P < 0.0001. (c and d) Western blots showing the knockdown of VPS26A and VPS35 in MDDCs, performed in triplicate, compared to untreated cell lysate and nontarget siRNA-transfected MDDCs. Actin used as a loading control. (e) Quantification of protein knockdown of VPS26A and VPS35 in transfected MDDCs relative to the nontarget lane. All lanes are compared to corresponding actin loading control (black bars). The means ± the SD are shown (n = 3). (f) Percentage of viable MDDC 48 h after transfection with VPS siRNA compared to controls. The means and the SD are shown (n = 2).
FIG 8
FIG 8
Model for the roles of ARF1, BIN1, RAB7L1, and RAB8A in the endocytic pathway and vesicle formation in MDDCs. Molecules are internalized from the cell surface via endocytic vesicles that fuse with each other or existing endocytic vesicles to form early endosomes. The budding of vesicles containing cargo from early endosomes to the plasma membrane and trans-Golgi network (TGN) requires the activity of BIN1. TGN vesicles bud from the TGN surface and either fuse with each other or endocytic compartments. The TGN is responsible for sorting receptors from degradative compartments and delivers newly synthesized lysosomal enzymes in the form of lysosomal hydrolase via the mannose-6-phosphate receptor. Both transferrin and LDL are taken into the cell via clathrin-receptor-mediated endocytosis. Transferrin and its receptor are recycled from early endosomes back to the plasma membrane. LDL is trafficked directly to lysosomes prior to release into the cytoplasm. The dynamic retrograde transport of vesicles between the TGN and endocytic compartment and the plasma membrane via the retromer and other trafficking pathways depends on the activity of ARF1, RAB7L1, and RAB8A. HIV-1 trans-infection between MDDCs and CD4+ T cells requires a homeostatic balance of the endocytic pathway. By blocking trafficking of molecules between early endosomes and the TGN and onward polarized transport of cargo to the plasma membrane, HIV-1 trans-infection is inhibited. Depletion of targeted proteins results in the accumulation of HIV-1 in intracellular vesicles that are unable to traffic to the virological synapse.

Similar articles

Cited by

References

    1. Piguet V, Steinman RM. 2007. The interaction of HIV with dendritic cells: outcomes and pathways. Trends Immunol 28:503–510. doi:10.1016/j.it.2007.07.010. - DOI - PMC - PubMed
    1. Law KM, Satija N, Esposito AM, Chen BK. 2016. Cell-to-cell spread of HIV and viral pathogenesis. Adv Virus Res 95:43–85. doi:10.1016/bs.aivir.2016.03.001. - DOI - PubMed
    1. Turville SG, Santos JJ, Frank I, Cameron PU, Wilkinson J, Miranda-Saksena M, Dable J, Stossel H, Romani N, Piatak M Jr, Lifson JD, Pope M, Cunningham AL. 2004. Immunodeficiency virus uptake, turnover, and two-phase transfer in human dendritic cells. Blood 103:2170–2179. doi:10.1182/blood-2003-09-3129. - DOI - PubMed
    1. Garcia E, Pion M, Pelchen-Matthews A, Collinson L, Arrighi JF, Blot G, Leuba F, Escola JM, Demaurex N, Marsh M, Piguet V. 2005. HIV-1 trafficking to the dendritic cell-T-cell infectious synapse uses a pathway of tetraspanin sorting to the immunological synapse. Traffic 6:488–501. doi:10.1111/j.1600-0854.2005.00293.x. - DOI - PubMed
    1. Nobile C, Petit C, Moris A, Skrabal K, Abastado JP, Mammano F, Schwartz O. 2005. Covert human immunodeficiency virus replication in dendritic cells and in DC-SIGN-expressing cells promotes long-term transmission to lymphocytes. J Virol 79:5386–5399. doi:10.1128/JVI.79.9.5386-5399.2005. - DOI - PMC - PubMed

Publication types

MeSH terms

Substances