

Seasonal Variability and Shared Molecular Signatures of Inactivated Influenza Vaccination in Young and Older Adults
- PMID: 32060136
- PMCID: PMC7755271
- DOI: 10.4049/jimmunol.1900922
Seasonal Variability and Shared Molecular Signatures of Inactivated Influenza Vaccination in Young and Older Adults
Abstract
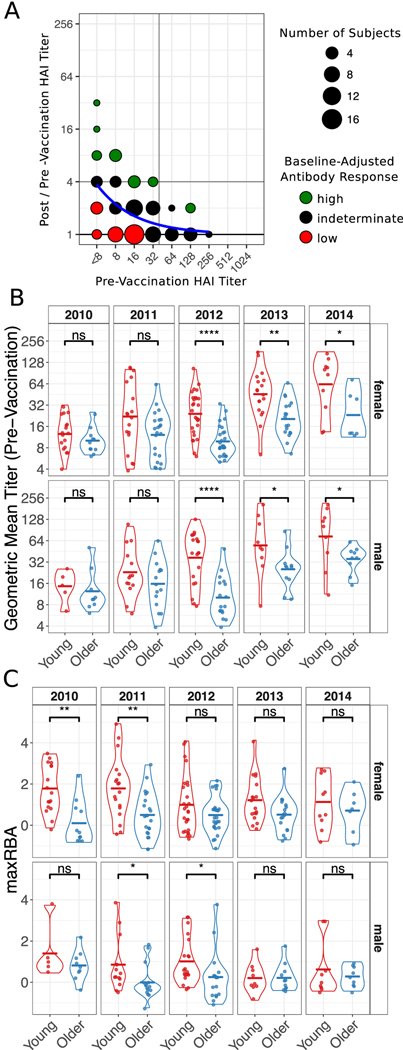
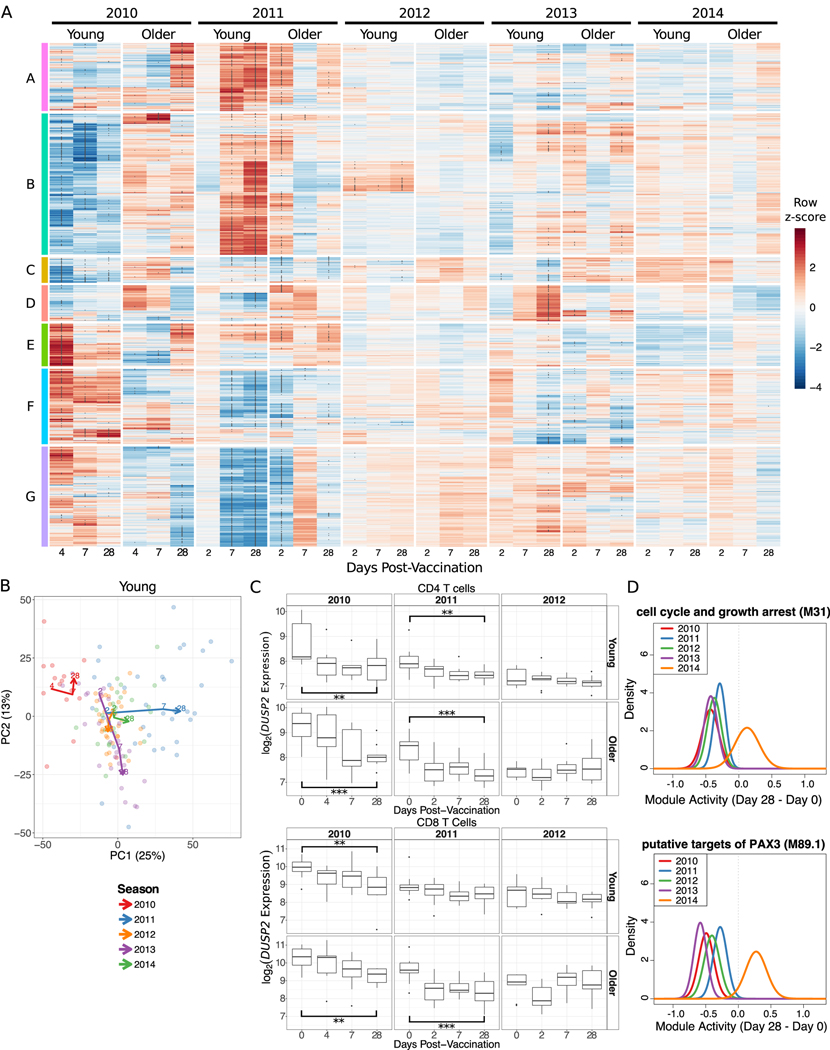
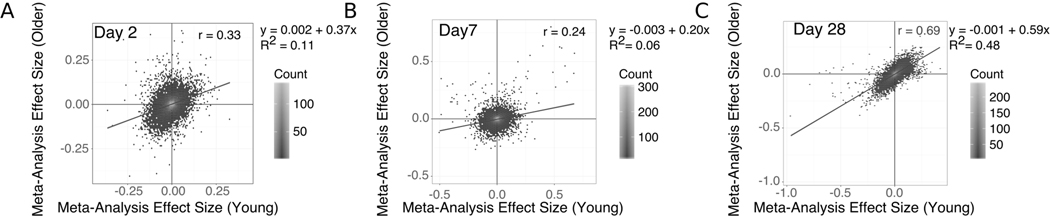
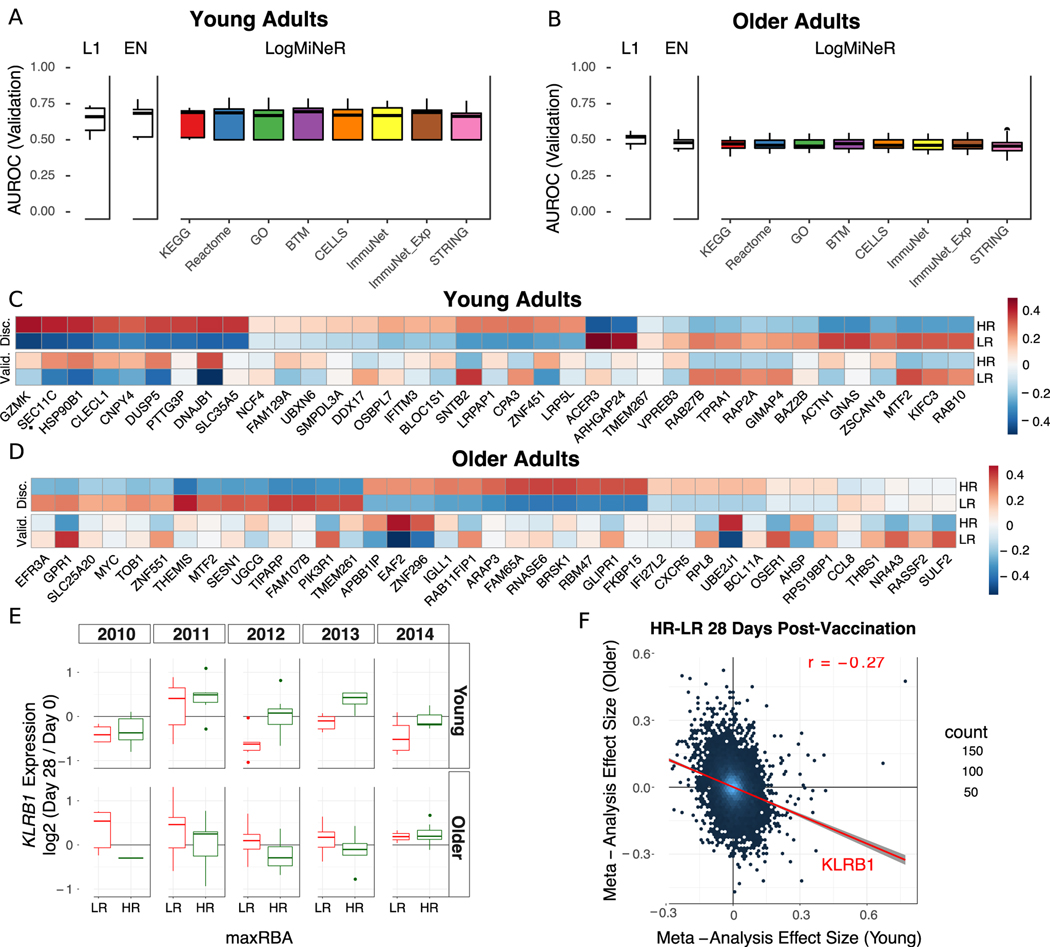
The seasonal influenza vaccine is an important public health tool but is only effective in a subset of individuals. The identification of molecular signatures provides a mechanism to understand the drivers of vaccine-induced immunity. Most previously reported molecular signatures of human influenza vaccination were derived from a single age group or season, ignoring the effects of immunosenescence or vaccine composition. Thus, it remains unclear how immune signatures of vaccine response change with age across multiple seasons. In this study we profile the transcriptional landscape of young and older adults over five consecutive vaccination seasons to identify shared signatures of vaccine response as well as marked seasonal differences. Along with substantial variability in vaccine-induced signatures across seasons, we uncovered a common transcriptional signature 28 days postvaccination in both young and older adults. However, gene expression patterns associated with vaccine-induced Ab responses were distinct in young and older adults; for example, increased expression of killer cell lectin-like receptor B1 (KLRB1; CD161) 28 days postvaccination positively and negatively predicted vaccine-induced Ab responses in young and older adults, respectively. These findings contribute new insights for developing more effective influenza vaccines, particularly in older adults.
Copyright © 2020 by The American Association of Immunologists, Inc.
Figures
Similar articles
-
Longitudinal assessment of human antibody binding to hemagglutinin elicited by split-inactivated influenza vaccination over six consecutive seasons.PLoS One. 2024 Jun 25;19(6):e0301157. doi: 10.1371/journal.pone.0301157. eCollection 2024. PLoS One. 2024. PMID: 38917104 Free PMC article.
-
Systems Analysis of Immunity to Influenza Vaccination across Multiple Years and in Diverse Populations Reveals Shared Molecular Signatures.Immunity. 2015 Dec 15;43(6):1186-98. doi: 10.1016/j.immuni.2015.11.012. Immunity. 2015. PMID: 26682988 Free PMC article.
-
Immunogenicity of Influenza Vaccines: Evidence for Differential Effect of Secondary Vaccination on Humoral and Cellular Immunity.Front Immunol. 2019 Jan 29;9:3103. doi: 10.3389/fimmu.2018.03103. eCollection 2018. Front Immunol. 2019. PMID: 30761157 Free PMC article. Clinical Trial.
-
The use of inactivated influenza vaccine in children.Semin Pediatr Infect Dis. 2006 Oct;17(4):200-5. doi: 10.1053/j.spid.2006.08.004. Semin Pediatr Infect Dis. 2006. PMID: 17055371 Review.
-
Downfall of the current antibody correlates of influenza vaccine response in yearly vaccinated subjects: Toward qualitative rather than quantitative assays.Pediatr Allergy Immunol. 2016 Feb;27(1):22-7. doi: 10.1111/pai.12483. Epub 2015 Oct 20. Pediatr Allergy Immunol. 2016. PMID: 26480951 Review.
Cited by
-
The Negative Effect of Preexisting Immunity on Influenza Vaccine Responses Transcends the Impact of Vaccine Formulation Type and Vaccination History.J Infect Dis. 2023 Feb 1;227(3):381-390. doi: 10.1093/infdis/jiac068. J Infect Dis. 2023. PMID: 35199825 Free PMC article.
-
A pilot metabolomic study of drug interaction with the immune response to seasonal influenza vaccination.NPJ Vaccines. 2023 Jun 12;8(1):92. doi: 10.1038/s41541-023-00682-2. NPJ Vaccines. 2023. PMID: 37308481 Free PMC article.
-
Antibody and transcription landscape in peripheral blood mononuclear cells of elderly adults over 70 years of age with third dose of COVID-19 BBIBP-CorV and ZF2001 booster vaccine.Immun Ageing. 2024 Jan 27;21(1):11. doi: 10.1186/s12979-023-00408-x. Immun Ageing. 2024. PMID: 38280989 Free PMC article.
-
Platelet response to influenza vaccination reflects effects of aging.Aging Cell. 2023 Feb;22(2):e13749. doi: 10.1111/acel.13749. Epub 2023 Jan 19. Aging Cell. 2023. PMID: 36656789 Free PMC article.
-
Distinct baseline immune characteristics associated with responses to conjugated and unconjugated pneumococcal polysaccharide vaccines in older adults.Nat Immunol. 2024 Feb;25(2):316-329. doi: 10.1038/s41590-023-01717-5. Epub 2024 Jan 5. Nat Immunol. 2024. PMID: 38182669 Free PMC article.
References
-
- Frey S, Vesikari T, Szymczakiewicz-Multanowska A, Lattanzi M, Izu A, Groth N, and Holmes S. 2010. Clinical Efficacy of Cell Culture-Derived and Egg-Derived Inactivated Subunit Influenza Vaccines in Healthy Adults. Clin. Infect. Dis. 51: 997–1004. - PubMed
-
- Monto AS, Ohmit SE, Petrie JG, Johnson E, Truscon R, Teich E, Rotthoff J, Boulton M, and Victor JC. 2009. Comparative efficacy of inactivated and live attenuated influenza vaccines. N. Engl. J. Med. 361: 1260–1267. - PubMed
-
- Beran J, Wertzova V, Honegr K, Kaliskova E, Havlickova M, Havlik J, Jirincova H, Van Belle P, Jain V, Innis B, and Devaster J-M. 2009. Challenge of conducting a placebo-controlled randomized efficacy study for influenza vaccine in a season with low attack rate and a mismatched vaccine B strain: a concrete example. BMC Infect. Dis. 9: 2. - PMC - PubMed
Publication types
MeSH terms
Substances
Grants and funding
LinkOut - more resources
Full Text Sources
Medical
Molecular Biology Databases