. 2020 Feb 13;15(2):e0228930.
doi: 10.1371/journal.pone.0228930. eCollection 2020.

The crowding dynamics of the motor protein kinesin-II

Affiliations

The crowding dynamics of the motor protein kinesin-II

Vandana S Kushwaha et al. PLoS One. .

Abstract

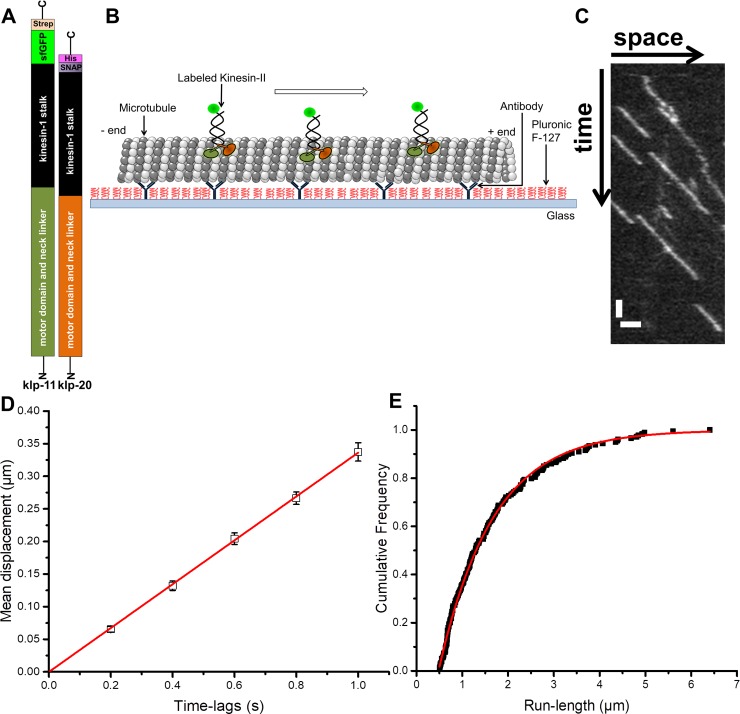
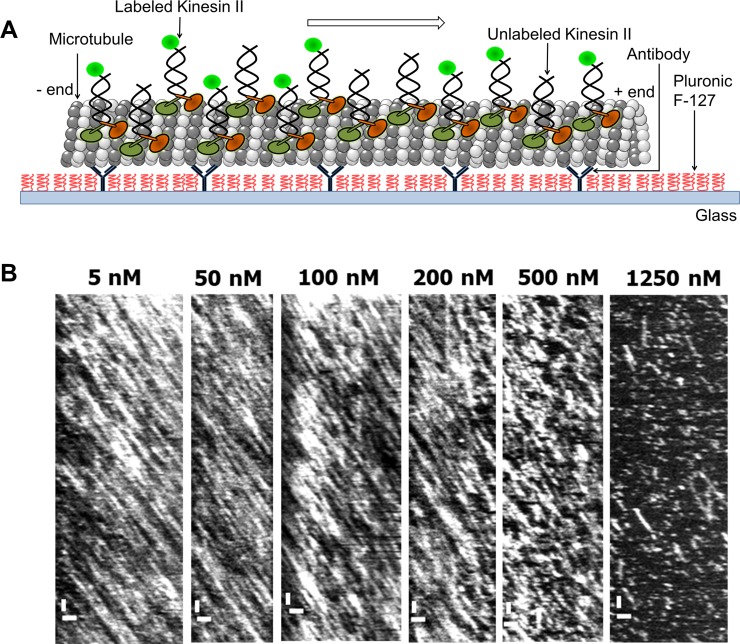
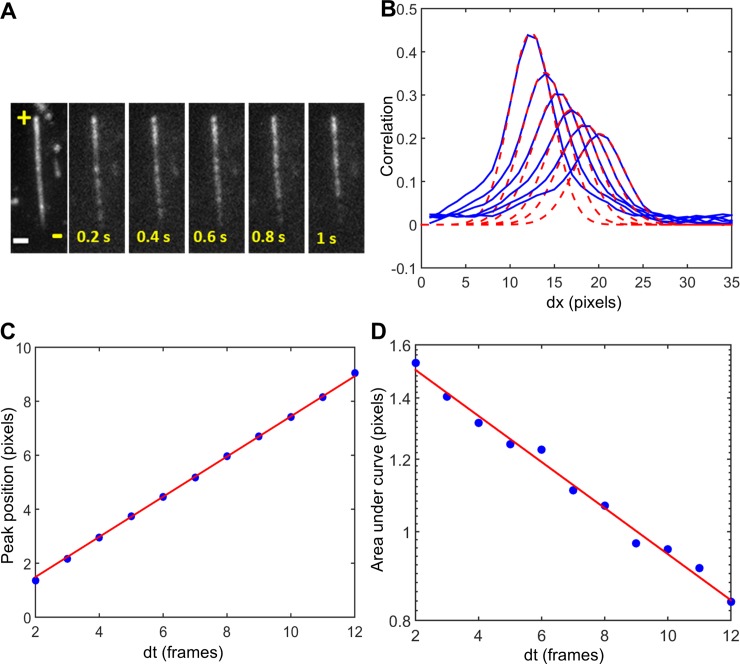
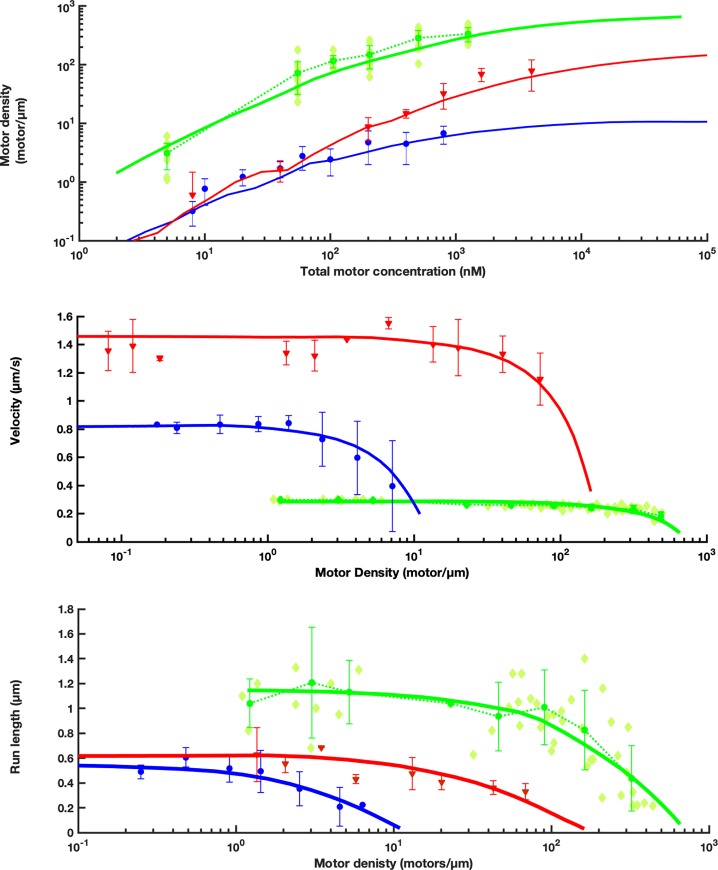
Intraflagellar transport (IFT) in C. elegans chemosensory cilia is an example of functional coordination and cooperation of two motor proteins with distinct motility properties operating together in large groups to transport cargoes: a fast and processive homodimeric kinesin-2, OSM-3, and a slow and less processive heterotrimeric kinesin-2, kinesin-II. To study the mechanism of the collective dynamics of kinesin-II of C. elegans cilia in an in vitro system, we used Total Internal Reflection Fluorescence microscopy to image the motility of truncated, heterodimeric kinesin-II constructs at high motor densities. Using an analysis technique based on correlation of the fluorescence intensities, we extracted quantitative motor parameters, such as motor density, velocity and average run length, from the image. Our experiments and analyses show that kinesin-II motility parameters are far less affected by (self) crowding than OSM-3. Our observations are supported by numerical calculations based on the TASEP-LK model (Totally Asymmetric Simple Exclusion Process-Langmuir Kinetics). From a comparison of data and modelling of OSM-3 and kinesin-II, a general picture emerges of the collective dynamics of the kinesin motors driving IFT in C. elegans chemosensory cilia and the way the motors deal with crowding.


Conflict of interest statement

The authors have declared that no competing interests exist.

Figures

Fig 1
Fig 1. Motility properties of kinesin-II at the single-molecule level.
A. Design of a labeled heterodimeric kinesin-II construct. B. Schematic of the in vitro motility assay. Single sfGFP-labeled kinesin-II molecules are observed moving along unlabeled, surface-immobilized microtubules. C. Typical kymograph (space-time plot) of individual sfGFP-kinesin-II motors obtained from single molecule TIRF motility assays. Time is progressing from top to bottom, length from left to right; scale bars: 1 μm (horizontal) and 2 s (vertical); the kinesin-II concentration was 200 pM. D. Mean displacement versus time-lag plot obtained from mean displacements extracted from 237 individual sfGFP-kinesin-II trajectories. Error bars indicate standard error of the mean (SEM). Red: linear fit with slope 0.33 ± 0.01 μm/s (R2 = 0.99). E. Cumulative probability distribution of lengths (μm) of individual trajectories. Red: exponential fit yielding an average run length of 1.18 ± 0.07 μm (R2 = 0.98).
Fig 2
Fig 2. Kinesin-II motility under crowded conditions.
A. Schematic of the in vitro motility assay. kinesin-II motors walk along the microtubules attached to the glass slide. The fluorescently labeled motor proteins are excited and imaged using TIRF microscopy. B. Kymographs (scale bars: 1 μm (horizontal) and 2 s (vertical)) of kinesin-II motility extracted from time series of TIRF images. The total concentration of labeled plus unlabeled motors is indicated. sfGFP-kinesin-II concentration is 5 nM in all kymographs. Measurements were performed in PEM12 buffer.
Fig 3
Fig 3. Correlation imaging measurements at high density of kinesin-II.
A. An example of one of the experiments; time series of TIRF images of fluorescently labeled kinesin-II motor proteins on a microtubule at a concentration of 5 nM in PEM12 buffer, exposure time 0.2 s, 1 pixel corresponds to 0.08 μm. The plus and minus ends of the microtubule are indicated. B. Cross sections of the correlation surface at different time lags. Gaussian fits (dashed red line) are used to obtain the peak position and area under these curves. C. Peak position as a function of time. The red linear fit yields the motor velocity of 0.30 ± 0.02 μm/s, R2 = 0.99 D. Area under the curve as a function of time in semi-logarithmic representation. An exponential fit (red) yields the detachment rate of motors, from which the average run length can be determined to be 1.2 ± 0.3 μm, R2 = 0.96.
Fig 4
Fig 4
Kinesin-II motility parameters as a function of total motor concentration (green), compared to previously published data and simulations from kinesin-1 (blue) and OSM-3 (red) [7]. A. Motor density (total density of labeled and unlabeled motor proteins) on microtubules as function of total motor concentration, calculated from fluorescence intensity fluctuations on ~70 microtubule segments. Light green diamonds: data points of individual microtubule segments (kinesin-II); symbols with error bars: averages and standard deviations calculated at each concentration; curves: predictions of the extended TASEP-LK model. B. Motor velocity as a function of motor density on microtubules. Light green diamonds: velocity determinations on individual microtubule segments (kinesin-II); symbols with error bars: averages and standard deviations of multiple velocity determinations within logarithmically scaled density intervals; curves: predictions of the extended TASEP-LK model. C. Run length as a function of motor density on microtubules. Light green diamonds: run length determinations on individual microtubule segments; symbols with error bars: averages and standard deviations of multiple run length determinations within logarithmically scaled density intervals; curves: predictions of the extended TASEP-LK model.

Similar articles

Cited by

References

    1. Prevo B, Mangeol P, Oswald F, Scholey JM and Peterman EJG. Functional differentiation of cooperating kinesin-2 motors orchestrates cargo import and transport in C. elegans cilia. Nature Cell Biology. 2015;17(12):1536–45. 10.1038/ncb3263 - DOI - PubMed
    1. Vale RD, Funatsu T, Pierce DW, Romberg L, Harada Y and Yanagida T. Direct observation of single kinesin molecules moving along microtubules. Nature.1996; 380(6573):451–3. 10.1038/380451a0 - DOI - PMC - PubMed
    1. Telley IA, Bieling P and Surrey T. Obstacles on the microtubule reduce the processivity of kinesin-1 in a minimal in vitro system and in cell extract. Biophys. J. 2009; 96(8):3341–53. 10.1016/j.bpj.2009.01.015 - DOI - PMC - PubMed
    1. Seitz A and Surrey T. Processive movement of single kinesins on crowded microtubules visualized using quantum dots. The EMBO Journal. 2006; 25(2): 267–277. 10.1038/sj.emboj.7600937 - DOI - PMC - PubMed
    1. Bieling P, Telley IA, Piehler J and Surrey T. Processive kinesins require loose mechanical coupling for efficient collective motility. EMBO Rep. 2008; 9(11):1121–7. 10.1038/embor.2008.169 - DOI - PMC - PubMed

Publication types

Grants and funding

A grant from the Complexity Initiative of the Netherlands Organization for Scientific Research (NWO). Recipient PS, Project number 645.000.014. www.nwo.nl. NWO VICI grant. Recipient PS. Number 680-47-615 www.nwo.nl NWO VICI grant. Recipient EJGP Number: 680-47-606 www.nwo.nl “Barriers in the Brain” from the Foundation for Fundamental Research on Matter (FOM). Recipient EJGP. Number: Program nr. 137 11BIB01 Website: www.nwo.nl. The funders had no role in study design, data collection and analysis, decision to publish, or preparation of the manuscript.