. 2020 Apr 16;94(9):e01567-19.
doi: 10.1128/JVI.01567-19. Print 2020 Apr 16.

Modified Sialic Acids on Mucus and Erythrocytes Inhibit Influenza A Virus Hemagglutinin and Neuraminidase Functions

Affiliations

Modified Sialic Acids on Mucus and Erythrocytes Inhibit Influenza A Virus Hemagglutinin and Neuraminidase Functions

Karen N Barnard et al. J Virol. .

Abstract

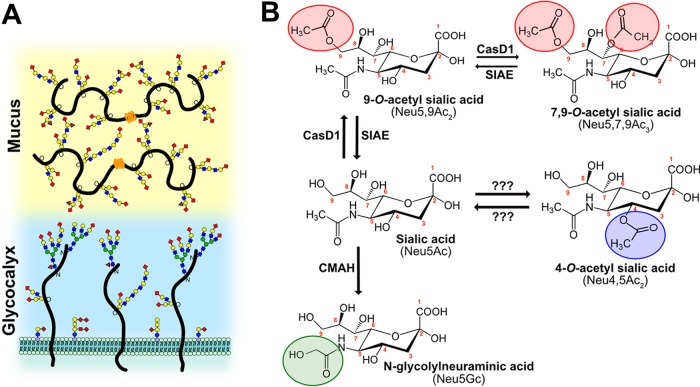
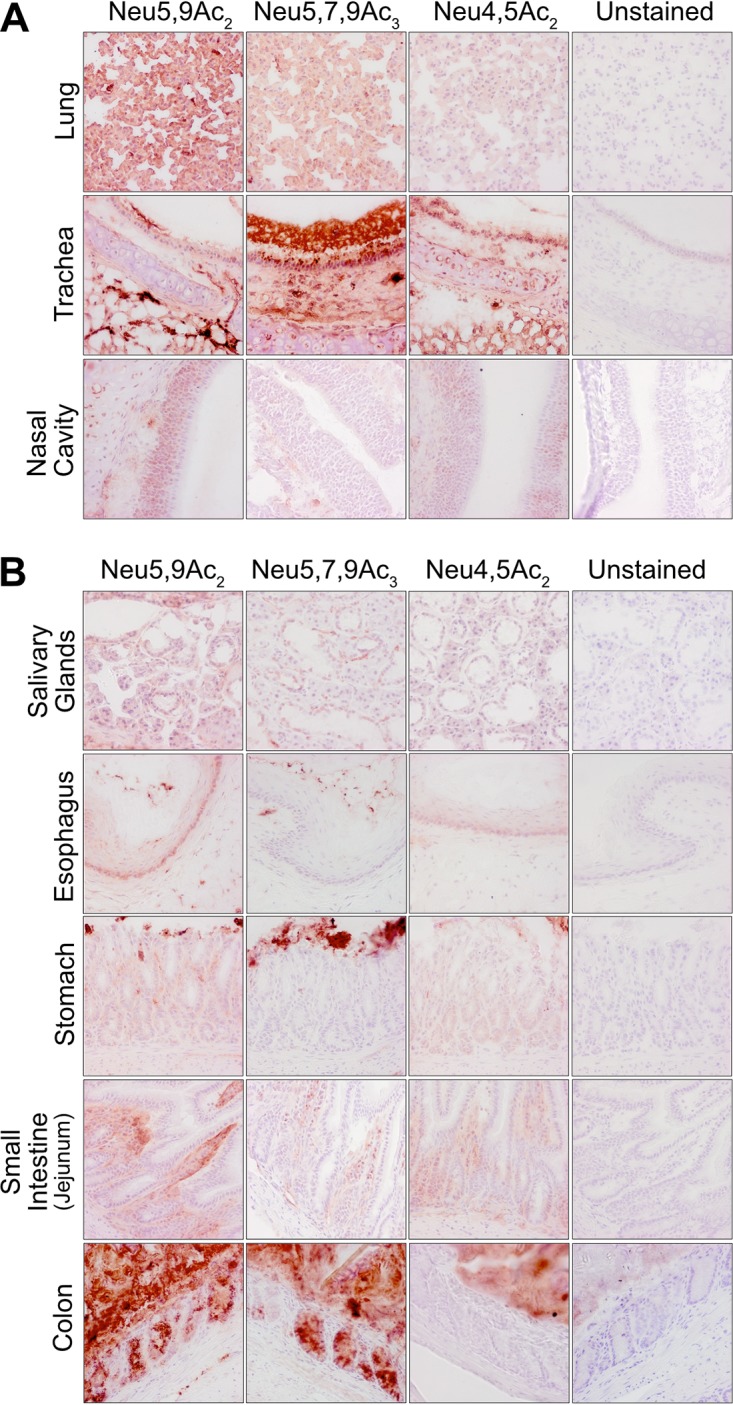
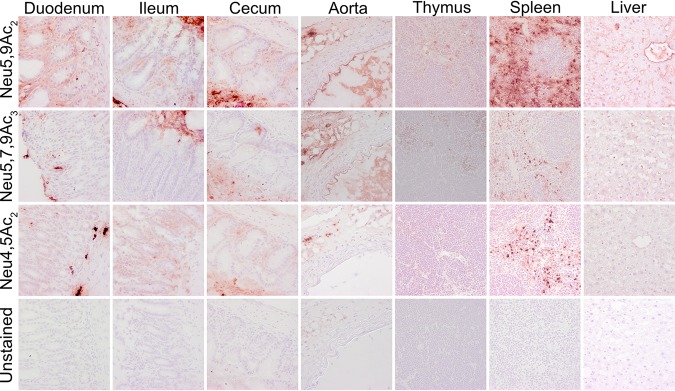
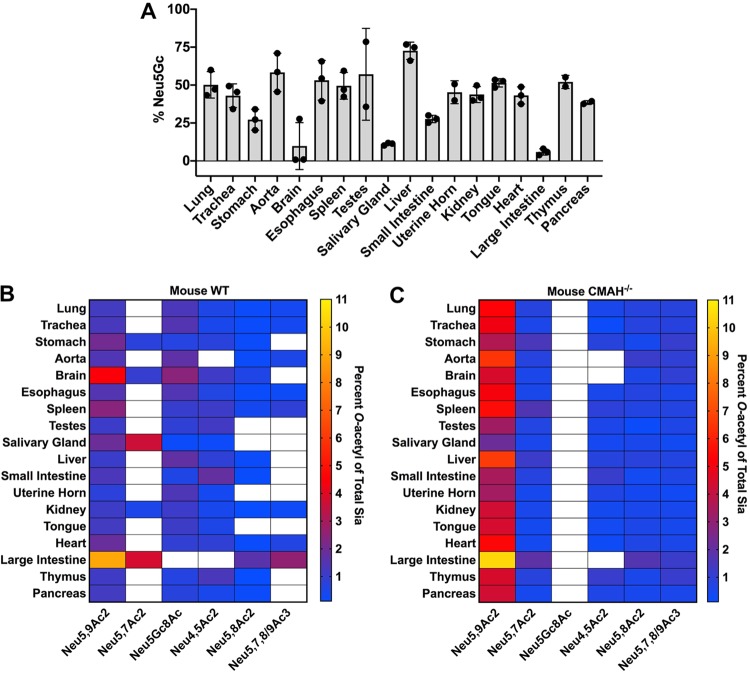
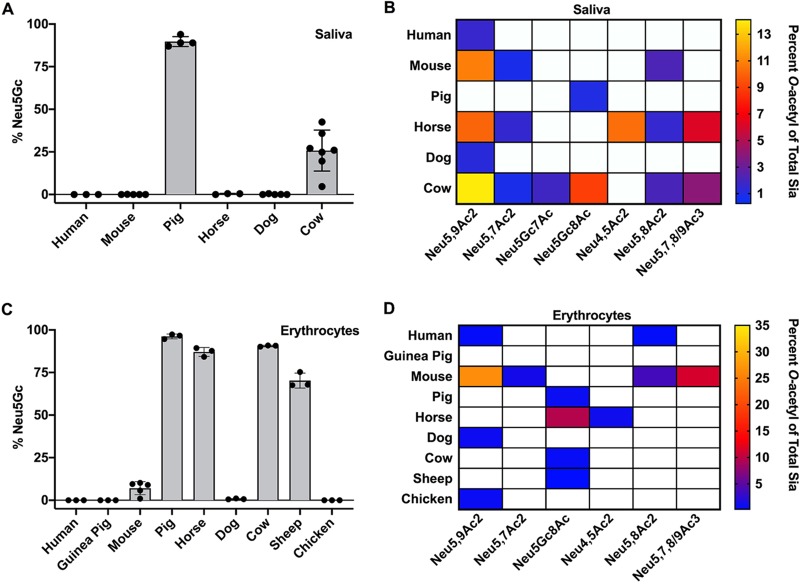
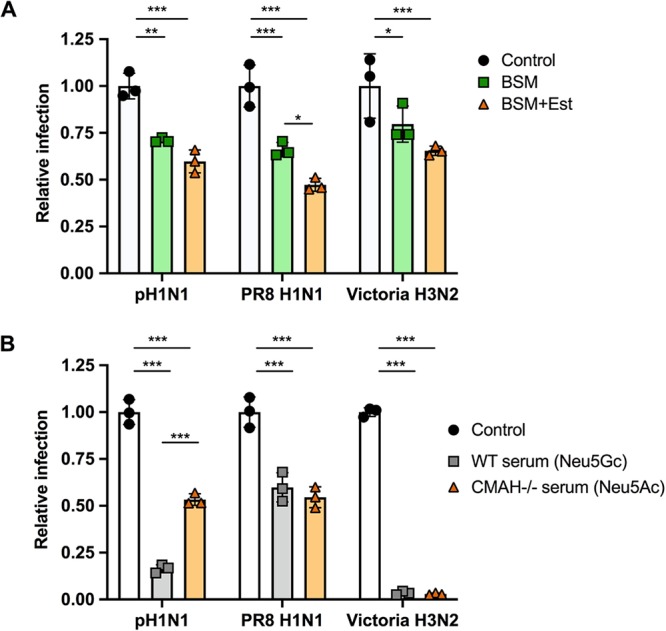
Sialic acids (Sia) are the primary receptors for influenza viruses and are widely displayed on cell surfaces and in secreted mucus. Sia may be present in variant forms that include O-acetyl modifications at C-4, C-7, C-8, and C-9 positions and N-acetyl or N-glycolyl at C-5. They can also vary in their linkages, including α2-3 or α2-6 linkages. Here, we analyze the distribution of modified Sia in cells and tissues of wild-type mice or in mice lacking CMP-N-acetylneuraminic acid hydroxylase (CMAH) enzyme, which synthesizes N-glycolyl (Neu5Gc) modifications. We also examined the variation of Sia forms on erythrocytes and in saliva from different animals. To determine the effect of Sia modifications on influenza A virus (IAV) infection, we tested for effects on hemagglutinin (HA) binding and neuraminidase (NA) cleavage. We confirmed that 9-O-acetyl, 7,9-O-acetyl, 4-O-acetyl, and Neu5Gc modifications are widely but variably expressed in mouse tissues, with the highest levels detected in the respiratory and gastrointestinal (GI) tracts. Secreted mucins in saliva and surface proteins of erythrocytes showed a high degree of variability in display of modified Sia between different species. IAV HAs from different virus strains showed consistently reduced binding to both Neu5Gc- and O-acetyl-modified Sia; however, while IAV NAs were inhibited by Neu5Gc and O-acetyl modifications, there was significant variability between NA types. The modifications of Sia in mucus may therefore have potent effects on the functions of IAV and may affect both pathogens and the normal flora of different mucosal sites.IMPORTANCE Sialic acids (Sia) are involved in numerous different cellular functions and are receptors for many pathogens. Sia come in chemically modified forms, but we lack a clear understanding of how they alter interactions with microbes. Here, we examine the expression of modified Sia in mouse tissues, on secreted mucus in saliva, and on erythrocytes, including those from IAV host species and animals used in IAV research. These Sia forms varied considerably among different animals, and their inhibitory effects on IAV NA and HA activities and on bacterial sialidases (neuraminidases) suggest a host-variable protective role in secreted mucus.

Keywords: influenza; mucus; sialic acids.


Figures

FIG 1
FIG 1
(A) Sialic acids (red diamonds) terminate glycan chains on glycolipids and glycoproteins as part of the glycocalyx on the surfaces of cells. They can also terminate glycans on secreted glycoproteins, like mucins, which are an important component of the protective mucosal barrier in gastrointestinal and respiratory tissue. (B) Sialic acid (Neu5Ac) can be modified by the addition of O-acetyl modifications at the C-4, -7, and -9 positions or by the hydroxylation of the N-acetyl group at C-5 to form Neu5Gc by the enzyme CMAH. The sialate O-acetyltransferase CasD1 adds acetyl groups at C-7, from which it migrates to the C-9 position (Neu5,9Ac2) under physiological conditions. This can allow an additional acetyl group to be added by CasD1 to C-7 (Neu5,7,9Ac3). The SIAE can remove these acetyl modifications, restoring the unmodified Neu5Ac form of sialic acid. O-Acetyl modifications can also be added at the C-4 position by a specific 4-O-acetyltransferase (Neu4,5Ac2) and removed by a 4-O-acetylesterase. However, the genes for these enzymes have not yet been identified.
FIG 2
FIG 2
Expression of O-acetylated Sia varies between tissues in wild-type C57BL/6 mice. Frozen tissue sections from respiratory tissues (A) and gastrointestinal tissues (B) were stained using virolectins derived from the hemagglutinin esterases (HE-Fcs) of various nidoviruses with high specificity for the different O-acetyl-modified Sia forms. Sections were counterstained with hematoxylin and imaged at ×40 magnification.
FIG 3
FIG 3
Expression of O-acetylated Sia varies between tissues in wild-type C57BL/6 mice. Frozen tissue sections were stained using virolectins derived from the hemagglutinin esterases (HE-Fcs) of various nidoviruses with high specificity for the different O-acetyl-modified Sia forms. Sections were counterstained with hematoxylin and imaged at ×40 magnification.
FIG 4
FIG 4
Neu5Gc and O-acetyl Sia modifications vary by tissue in wild-type C57BL/6 mice, and absence of Neu5Gc in CMAH−/− mice leads to an increase in O-acetylation across tissues. Total Sia was measured from tissue samples using HPLC analysis to determine relative Sia quantities. (A) Neu5Gc levels were measured in tissues from WT mice showing variable levels of expression between different tissues. CMAH−/− mice showed undetectable levels of Neu5Gc. Filled cirlces show the individual data points. The error bars indicate standard deviations. (B and C) Percentages of O-acetyl-modified Sia in different tissues from WT (B) and CMAH−/− (C) mice are given as a heat map showing variation across tissues. The white squares indicate that the Sia form was below the limit of detection. Values are given as the percentage of total Sia collected from tissue samples. The sample size for each tissue was three individual mice (n = 3) of each mouse strain, with average values for total sialic acid content given in Tables 1 and 2.
FIG 5
FIG 5
Total Sia of saliva (A and B) and erythrocytes (C and D) were collected via acid hydrolysis and analyzed using HPLC. O-Acetyl Sia percentages are given as heat maps, with white squares indicating that a Sia form was below the limit of detection. Values are given as the percentage of total Sia collected from tissue samples. Saliva samples were as follows (n represents the number of individuals of each species): human (n = 3), mouse (n = 5), pig (n = 4), horse (n = 3), dog (n = 5), and cow (n = 7). Erythrocyte samples were as follows (n represents the number of individuals of each species): human (n = 3), guinea pig (n = 3), mouse (n = 5), pig (n = 3), horse (n = 3), cow (n = 3), sheep (n = 3), chicken (n = 3), and dog (n = 3). Filled circles show individual data points.
FIG 6
FIG 6
NA VLPs produced in HEK-293 cells are enzymatically functional. (A) NA protein levels by Coomassie blue staining of NA protein present in VLPs after control background subtraction. The data represent three replicates. (B) TEM micrograph of a VLP expressing N2. (C) Comparison of NA enzymatic activities, using a MuNANA assay, between different NA serotypes. The data represent three experimental replicates. The error bars indicate standard deviations.
FIG 7
FIG 7
NA VLPs preferentially cleave unmodified Neu5Ac Sia, and NA activity is inhibited by O-acetyl and Neu5Gc modifications. (A) Bovine submaxillary mucin was treated with 1:100 NA VLPs or A. ureafaciens NA (NeuA) for 4 h at 37°C, and freed Sia was collected and analyzed using HPLC. The profiles of freed Sia were then compared to the profile of Sia removed chemically, a more unbiased approach. The profiles shown are the averages of the results of two independent experiments. (B and C) Chicken erythrocytes (Neu5Ac) or horse erythrocytes (Neu5Gc) were treated with 1:100 NA VLPs for 4 h at 37°C, freed Sia was collected, and the total Sia removed was determined using HPLC. (B) Average area counts per minute (area under the curve of the HLC chromatogram) were used as a measure of the absolute amount of Sia removal to compare the amounts of Sia released between chicken and horse erythrocytes. (C) Relative area counts compared between chicken and horse erythrocytes. The data shown are averages of the results of two independent experiments. The data were analyzed by t test using PRISM software. ***, P ≤ 0.001. The error bars indicate standard deviations.
FIG 8
FIG 8
Soluble HA-Fc binding to synthetic sialosides showed decreased binding to modified Sia in an ELLA. (A and B) Soluble HA constructs were developed by expressing HA proteins from different IAV strains fused to a human IgG1 Fc (HA-Fc). HA-Fc binding to synthetic α2-6-linked sialosides was assessed using an ELLA. Titration curves of sialoside binding by HA-Fc for A/California/04/2009 H1N1 (A) and A/Aichi/2/1968 H3N2 (B) were measured via colorimetric measurement. The error bars indicate standard deviations. (C) Sialoside binding for different H1 and H3 HA-Fcs were determined using 2 μg of sialic acid. Lectin from Sambucus nigra (SNA), which specifically binds α2-6-linked Sia, was also included as a control. The data are shown relative to HA-Fc binding to unmodified Neu5Ac. The data were analyzed by 2-way analysis of variance (ANOVA) using PRISM software and are averages of the results of three independent experiments. **, P ≤ 0.01; ***, P ≤ 0.001.
FIG 9
FIG 9
Virus infection is inhibited by mucin, with greater inhibition when O-acetyl groups are removed. Virus infection is also inhibited by serum, with no clear difference between Neu5Ac and Neu5Gc presence. (A) A/California/04/2009 (pH1N1), A/Puerto Rico/8/1934 (PR8, H1N1), and A/Victoria/361/2011 (Victoria H3N2) were mixed with 20 μg of BSM or BSM pretreated with esterase-active bovine coronavirus (BCoV HE-Fc) to remove O-acetyl modifications (BSM+Est). The mixture was then used to infect cells at an MOI of 0.5 for 10 h. Infectivity was determined by flow cytometry analysis for NP-positive cells. (B) A/California/04/2009 (pH1N1), A/Puerto Rico/8/1934 (PR8 H1N1), and A/Victoria/361/2011 (Victoria H3N2) were mixed with sera from either WT mice (Neu5Gc) or CMAH−/− mice (Neu5Ac). The mixture was then used to infect cells at an MOI of 0.5 for 10 h. Infectivity was determined by flow cytometry analysis for NP-positive cells. The data were analyzed by 2-way ANOVA using PRISM software. *, P ≤ 0.05; **, P ≤ 0.01; ***, P ≤ 0.001.

Similar articles

Cited by

References

    1. Varki A, Schauer R. 2009. Sialic acids, Chapter 14. In Essentials of glycobiology, 2nd ed Cold Spring Harbor Laboratory Press, Cold Spring Harbor, NY.
    1. Varki NM, Varki A. 2007. Diversity in cell surface sialic acid presentations: implications for biology and disease. Lab Invest 87:851–857. doi:10.1038/labinvest.3700656. - DOI - PMC - PubMed
    1. Lehmann F, Tiralongo E, Tiralongo J. 2006. Sialic acid-specific lectins: occurrence, specificity and function. Cell Mol Life Sci 63:1331–1354. doi:10.1007/s00018-005-5589-y. - DOI - PMC - PubMed
    1. Varki A. 2007. Glycan-based interactions involving vertebrate sialic-acid-recognizing proteins. Nature 446:1023–1029. doi:10.1038/nature05816. - DOI - PubMed
    1. Wasik BR, Barnard KN, Parrish CR. 2016. Effects of sialic acid modifications on virus binding and infection. Trends Microbiol 20:1–11. doi:10.1016/j.tim.2016.07.005. - DOI - PMC - PubMed

Publication types

MeSH terms