

Microbiome Dynamics Associated With the Atacama Flowering Desert
- PMID: 32038589
- PMCID: PMC6990129
- DOI: 10.3389/fmicb.2019.03160
Microbiome Dynamics Associated With the Atacama Flowering Desert
Abstract
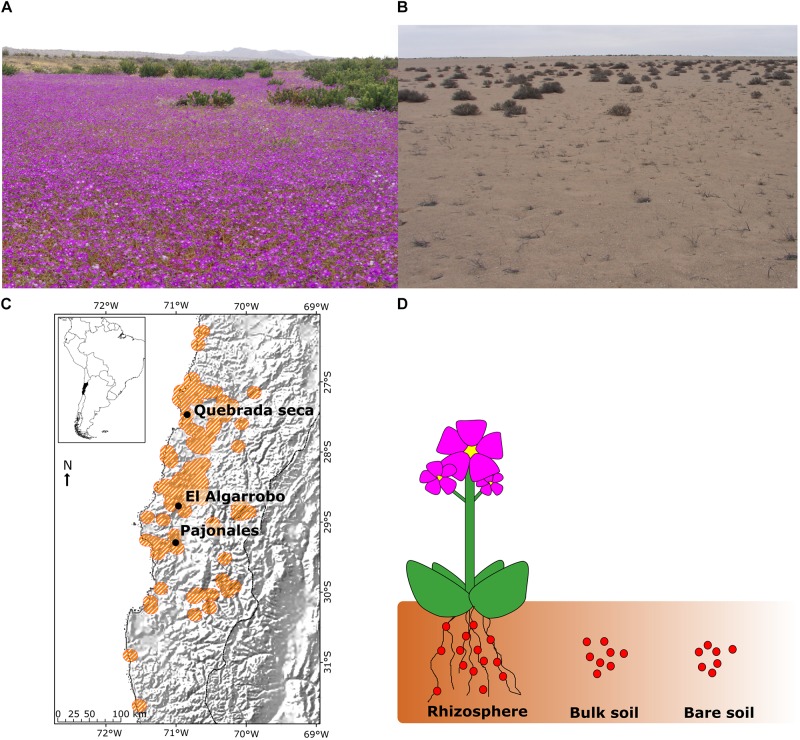
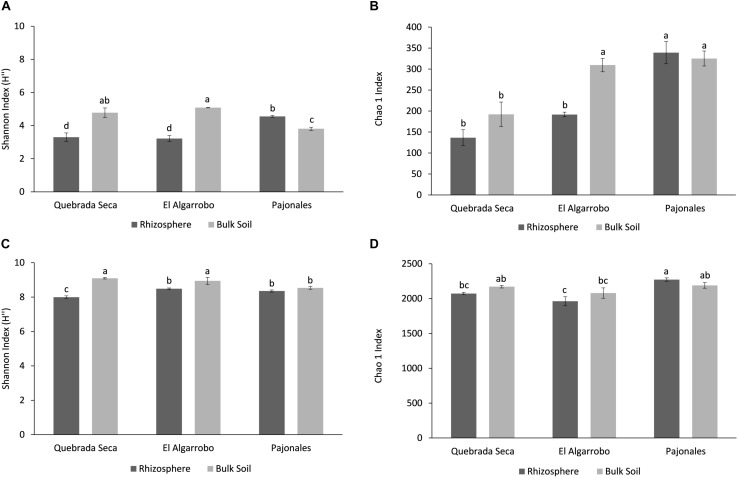
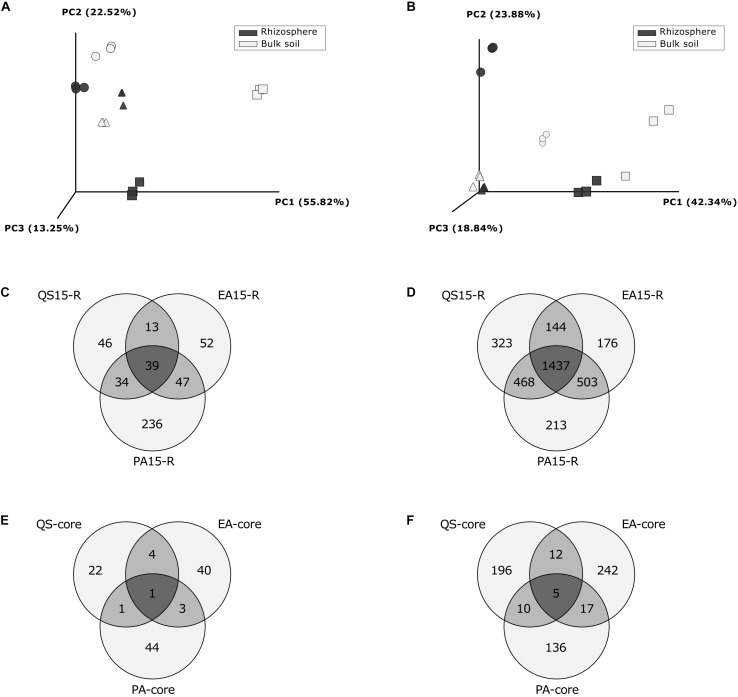
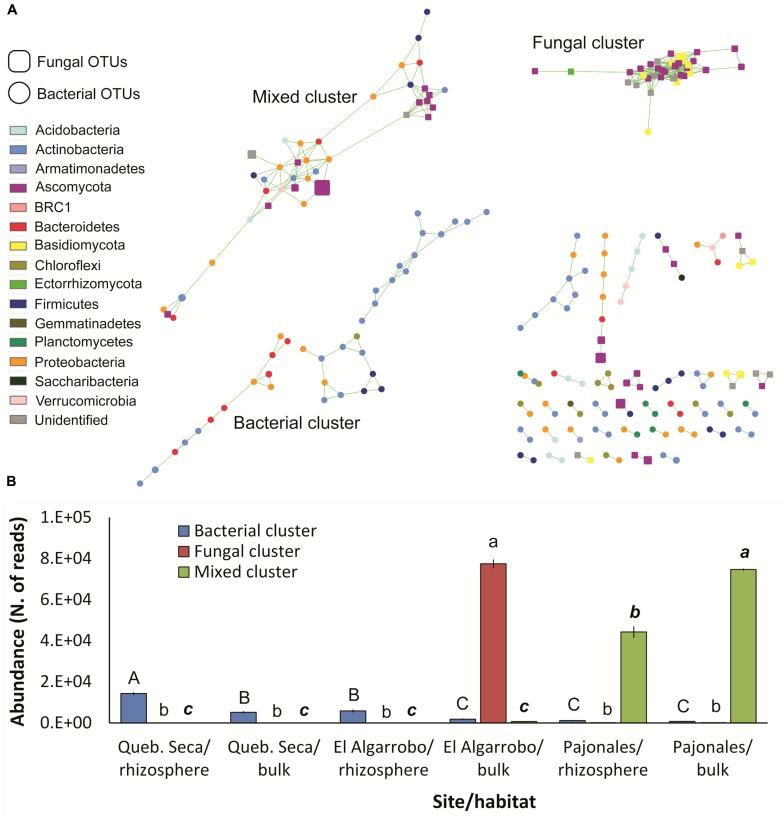
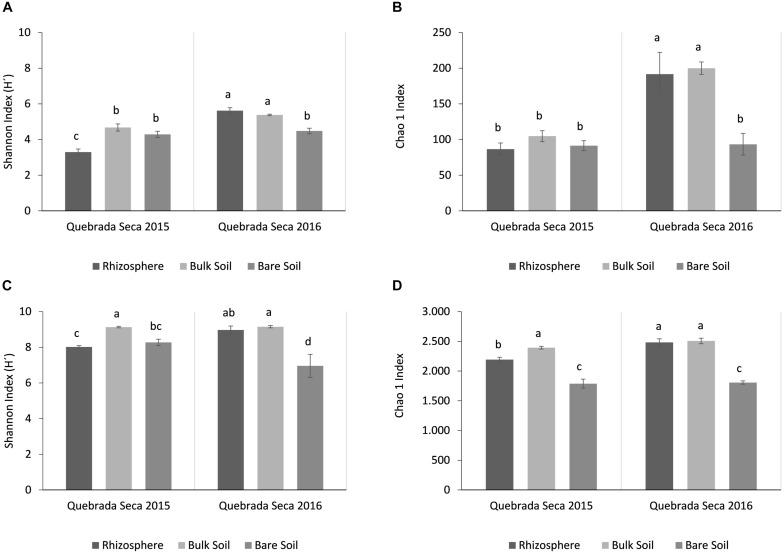
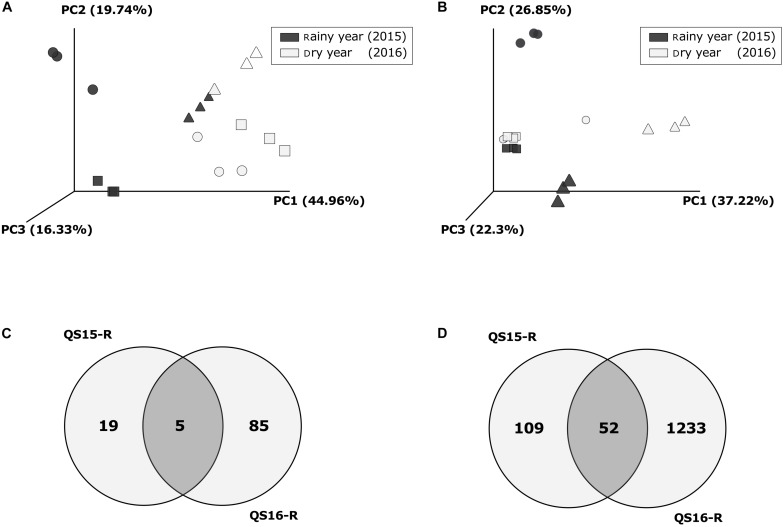
In a desert, plants as holobionts quickly respond to resource pulses like precipitation. However, little is known on how environment and plants modulate the rhizosphere-associated microbiome. As a model species to represent the Atacama Desert bloom, Cistanthe longiscapa (Montiaceae family) was selected to study the influence of abiotic and biotic environment on the diversity and structure of the microbiota associated to its rhizosphere. We analyzed the rhizosphere and soil microbiome along a North-South precipitation gradient and between a dry and rainy year by using Illumina high-throughput sequencing of 16S rRNA gene fragments and ITS2 regions for prokaryotes and fungi, respectively. In the rhizosphere of C. longiscapa the microbiota clearly differs in composition and structure from the surrounding bulk soil. The fungal and bacterial communities respond differently to environmental conditions. The diversity and richness of fungal OTUs were negatively correlated with aridity, as predicted. The community structure was predominantly influenced by other soil characteristics (pH, organic matter content) but not by aridity. In contrast, diversity, composition, and structure of the bacterial community were not influenced by aridity or any other evaluated soil parameter. These findings coincide with the identification of mainly site-specific microbial communities, not shared along the sites. These local communities contain a group of OTUs, which are exclusive to the rhizosphere of each site and presumably vertically inherited as seed endophytes. Their ecological functions and dispersal mechanisms remain unclear. The analysis of co-occurrence patterns highlights the strong effect of the desert habitat over the soil- and rhizosphere-microbiome. The site-independent enrichment of only a small bacterial cluster consistently associated with the rhizosphere of C. longiscapa further supports this conclusion. In a rainy year, the rhizosphere microbiota significantly differed from bulk and bare soil, whereas in a dry year, the community structure of the former rhizosphere approximates to the one found in the bulk. In the context of plant-microbe interactions in desert environments, our study contributes new insights into the importance of aridity in microbial community structure and composition, discovering the influence of other soil parameters in this complex dynamic network, which needs further to be investigated.
Keywords: Atacama Desert; Cistanthe longiscapa; co-occurrence patterns; core microbiome; desert bloom; precipitation gradient; rhizosphere community.
Copyright © 2020 Araya, González, Cardinale, Schnell and Stoll.
Figures
Similar articles
-
Composition, Predicted Functions and Co-occurrence Networks of Rhizobacterial Communities Impacting Flowering Desert Events in the Atacama Desert, Chile.Front Microbiol. 2020 Apr 8;11:571. doi: 10.3389/fmicb.2020.00571. eCollection 2020. Front Microbiol. 2020. PMID: 32322245 Free PMC article.
-
Fungal and Bacterial Microbiome Associated with the Rhizosphere of Native Plants from the Atacama Desert.Microorganisms. 2020 Feb 4;8(2):209. doi: 10.3390/microorganisms8020209. Microorganisms. 2020. PMID: 32033093 Free PMC article.
-
Changes in Diversity and Community Composition of Root Endophytic Fungi Associated with Aristolochia chilensis along an Aridity Gradient in the Atacama Desert.Plants (Basel). 2022 Jun 5;11(11):1511. doi: 10.3390/plants11111511. Plants (Basel). 2022. PMID: 35684284 Free PMC article.
-
Inside the root microbiome: bacterial root endophytes and plant growth promotion.Am J Bot. 2013 Sep;100(9):1738-50. doi: 10.3732/ajb.1200572. Epub 2013 Aug 8. Am J Bot. 2013. PMID: 23935113 Review.
-
Deciphering key factors in pathogen-suppressive microbiome assembly in the rhizosphere.Front Plant Sci. 2023 Dec 5;14:1301698. doi: 10.3389/fpls.2023.1301698. eCollection 2023. Front Plant Sci. 2023. PMID: 38116158 Free PMC article. Review.
Cited by
-
Rhizosheath-root system changes exopolysaccharide content but stabilizes bacterial community across contrasting seasons in a desert environment.Environ Microbiome. 2022 Apr 1;17(1):14. doi: 10.1186/s40793-022-00407-3. Environ Microbiome. 2022. PMID: 35365219 Free PMC article.
-
Causes and consequences of differences in soil and seed microbiomes for two alpine plants.Oecologia. 2022 Dec;200(3-4):385-396. doi: 10.1007/s00442-022-05271-z. Epub 2022 Oct 12. Oecologia. 2022. PMID: 36224498
-
Current Insight into Traditional and Modern Methods in Fungal Diversity Estimates.J Fungi (Basel). 2022 Feb 24;8(3):226. doi: 10.3390/jof8030226. J Fungi (Basel). 2022. PMID: 35330228 Free PMC article. Review.
-
Investigation of bacterial diversity using 16S rRNA sequencing and prediction of its functionalities in Moroccan phosphate mine ecosystem.Sci Rep. 2022 Mar 8;12(1):3741. doi: 10.1038/s41598-022-07765-5. Sci Rep. 2022. PMID: 35260670 Free PMC article.
-
Microbiome Variation Across Populations of Desert Halophyte Zygophyllum qatarensis.Front Plant Sci. 2022 Mar 31;13:841217. doi: 10.3389/fpls.2022.841217. eCollection 2022. Front Plant Sci. 2022. PMID: 35432394 Free PMC article.
References
-
- Armesto J., Vidiella P., Gutierrez J. (1993). Plant communities of the fog-free coastal desert of chile: plant strategies in a fluctuating environment. Rev. Chil. Hist. Nat. 66 271–282.
-
- Bengtsson-Palme J., Veldre V., Ryberg M., Hartmann M., Branco S., Wang Z., et al. (2013). Improved software detection and extraction of ITS1 and ITS2 from ribosomal ITS sequences of fungi and other eukaryotes for use in environmental sequencing. Methods Ecol. Evol. 4 914–919. 10.1111/2041-210X.12073 - DOI
LinkOut - more resources
Full Text Sources
Research Materials