

A Role of Microtubules in Oligodendrocyte Differentiation
- PMID: 32033476
- PMCID: PMC7037135
- DOI: 10.3390/ijms21031062
A Role of Microtubules in Oligodendrocyte Differentiation
Abstract
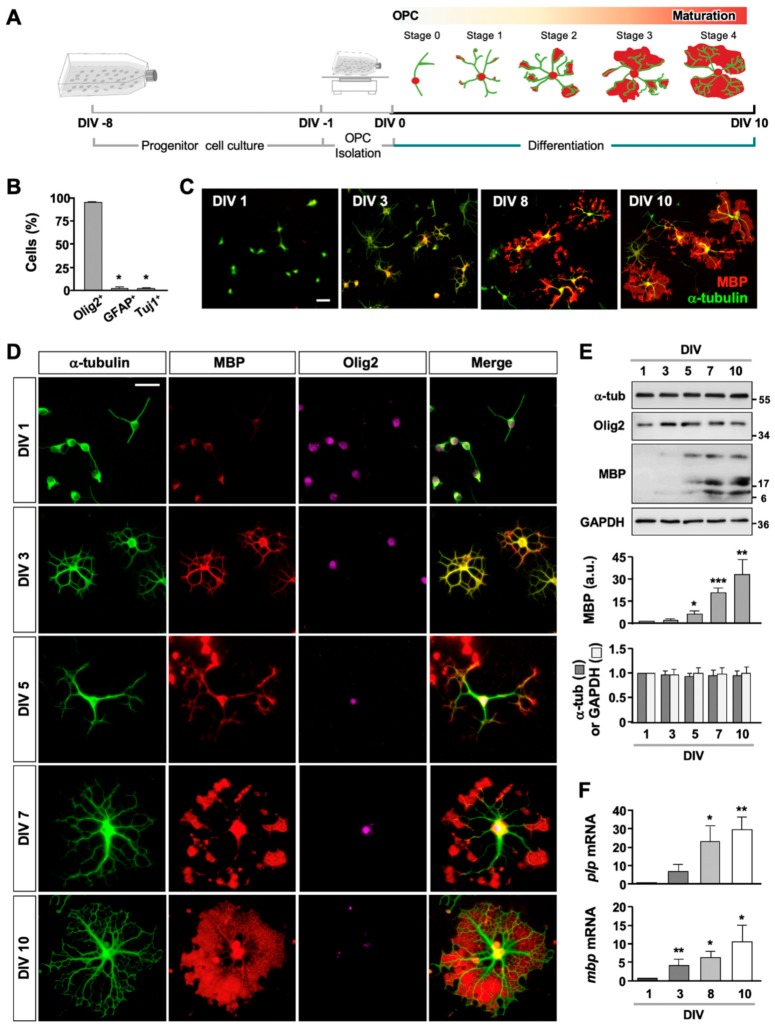
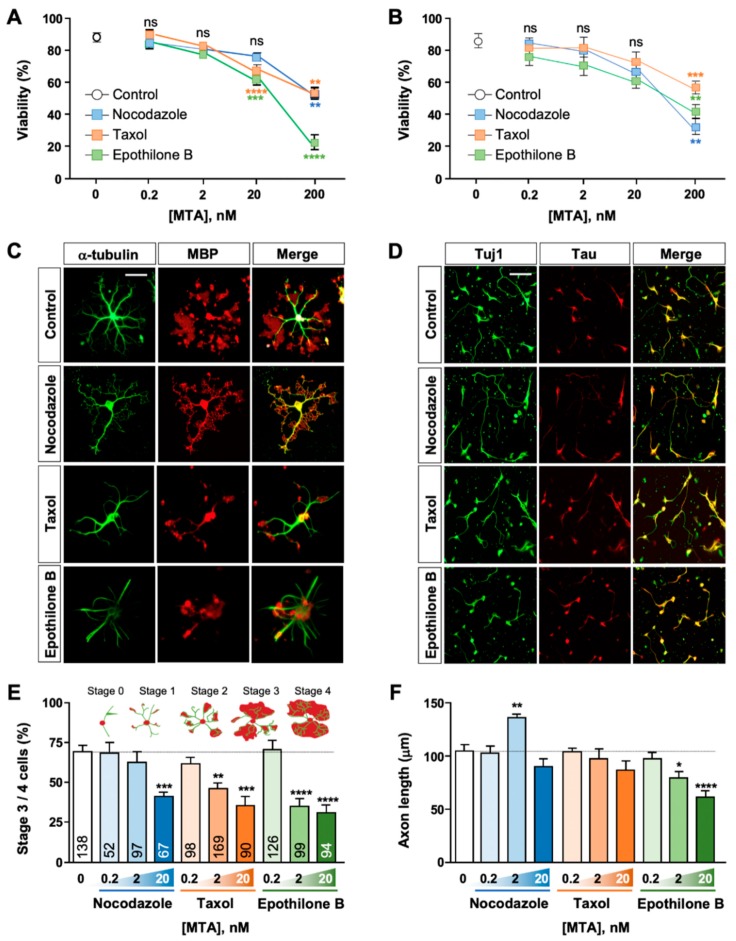
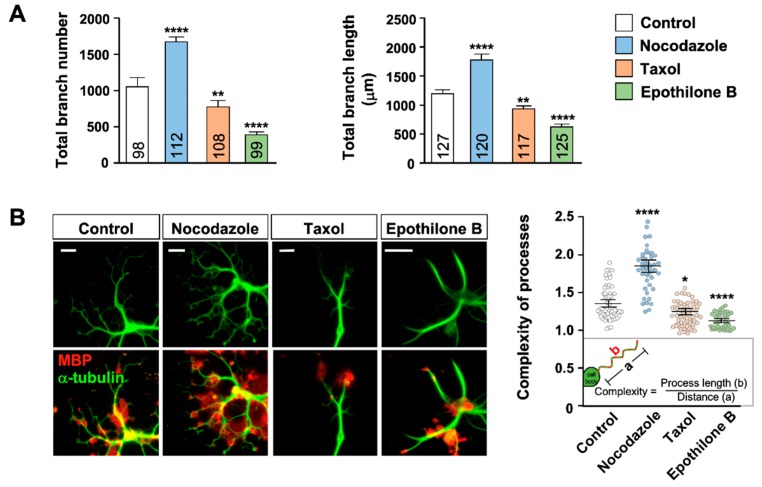
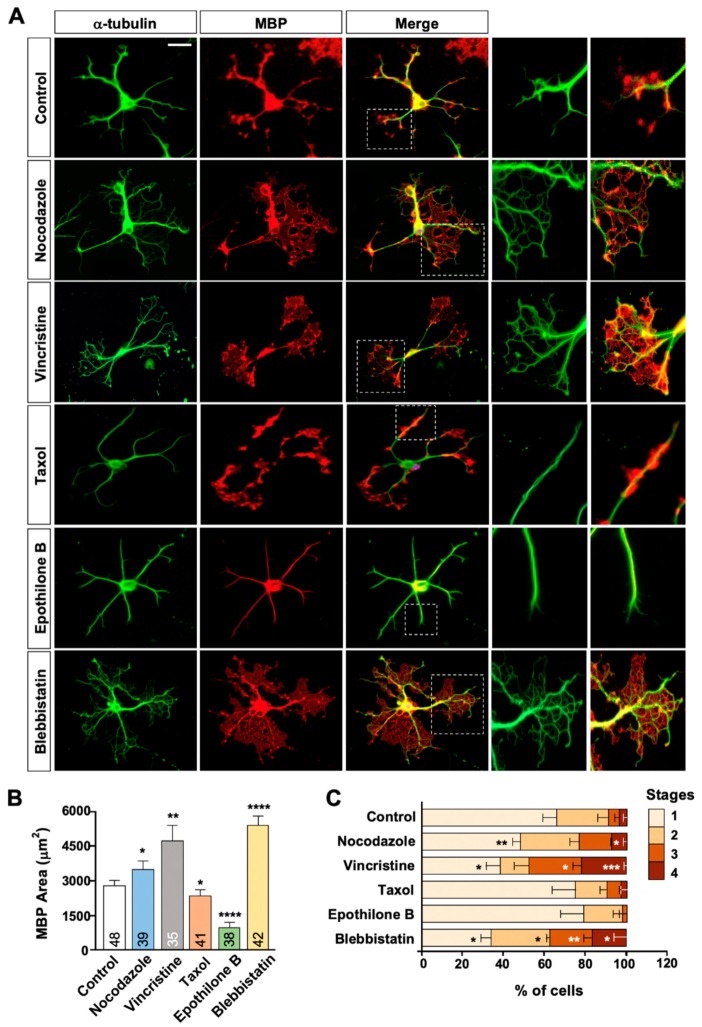
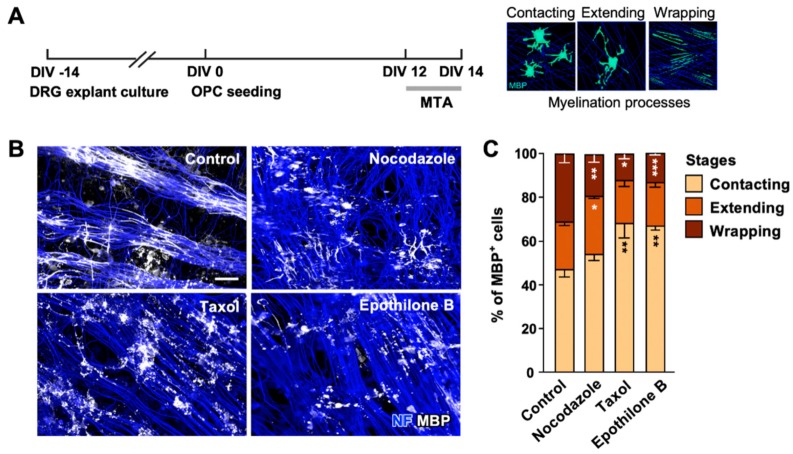
Oligodendrocytes are specialized cells that myelinate axons in the central nervous system. Defects in oligodendrocyte function and failure to form or maintain myelin sheaths can cause a number of neurological disorders. Oligodendrocytes are differentiated from oligodendrocyte progenitor cells (OPCs), which extend several processes that contact, elaborate, and eventually wrap axonal segments to form multilayered myelin sheaths. These processes require extensive changes in the cytoarchitecture and must be regulated by reorganization of the cytoskeleton. Here, we established a simple protocol to isolate and differentiate mouse OPCs, and by using this method, we investigated a role of microtubules (MTs) in oligodendrocyte differentiation. Oligodendrocytes developed a complex network of MTs during differentiation, and treatment of differentiating oligodendrocytes with nanomolar concentrations of MT-targeting agents (MTAs) markedly affected oligodendrocyte survival and differentiation. We found that acute exposure to vincristine and nocodazole at early stages of oligodendrocyte differentiation markedly increased MT arborization and enhanced differentiation, whereas taxol and epothilone B treatment produced opposing outcomes. Furthermore, treatment of myelinating co-cultures of oligodendrocytes and neurons with nanomolar concentrations of MTAs at late stages of oligodendrocyte differentiation induced dysmyelination. Together, these results suggest that MTs play an important role in the survival, differentiation, and myelination of oligodendrocytes.
Keywords: differentiation; microtubule; mouse oligodendrocyte; survival.
Conflict of interest statement
The authors declare no conflict of interest.
Figures
Similar articles
-
Oligodendrocyte Development in the Absence of Their Target Axons In Vivo.PLoS One. 2016 Oct 7;11(10):e0164432. doi: 10.1371/journal.pone.0164432. eCollection 2016. PLoS One. 2016. PMID: 27716830 Free PMC article.
-
Downregulation of the microtubule associated protein tau impairs process outgrowth and myelin basic protein mRNA transport in oligodendrocytes.Glia. 2015 Sep;63(9):1621-35. doi: 10.1002/glia.22832. Epub 2015 Apr 4. Glia. 2015. PMID: 25847153
-
Differentiation of oligodendrocyte progenitor cells from dissociated monolayer and feeder-free cultured pluripotent stem cells.PLoS One. 2017 Feb 13;12(2):e0171947. doi: 10.1371/journal.pone.0171947. eCollection 2017. PLoS One. 2017. PMID: 28192470 Free PMC article.
-
Mechanical plasticity during oligodendrocyte differentiation and myelination.Glia. 2018 Jan;66(1):5-14. doi: 10.1002/glia.23206. Epub 2017 Sep 21. Glia. 2018. PMID: 28940651 Free PMC article. Review.
-
Heterogeneity of Oligodendrocytes and Their Precursor Cells.Adv Exp Med Biol. 2019;1190:53-62. doi: 10.1007/978-981-32-9636-7_5. Adv Exp Med Biol. 2019. PMID: 31760638 Review.
Cited by
-
Group I PAKs in myelin formation and repair of the central nervous system: what, when, and how.Biol Rev Camb Philos Soc. 2022 Apr;97(2):615-639. doi: 10.1111/brv.12815. Epub 2021 Nov 22. Biol Rev Camb Philos Soc. 2022. PMID: 34811887 Free PMC article. Review.
-
A Novel Vitronectin Peptide Facilitates Differentiation of Oligodendrocytes from Human Pluripotent Stem Cells (Synthetic ECM for Oligodendrocyte Differentiation).Biology (Basel). 2021 Dec 1;10(12):1254. doi: 10.3390/biology10121254. Biology (Basel). 2021. PMID: 34943169 Free PMC article.
-
The Role of Intravesicular Proteins and the Protein Corona of Extracellular Vesicles in the Development of Drug-Induced Polyneuropathy.Curr Issues Mol Biol. 2023 Apr 7;45(4):3302-3314. doi: 10.3390/cimb45040216. Curr Issues Mol Biol. 2023. PMID: 37185740 Free PMC article. Review.
-
Identification of novel myelin repair drugs by modulation of oligodendroglial differentiation competence.EBioMedicine. 2021 Mar;65:103276. doi: 10.1016/j.ebiom.2021.103276. Epub 2021 Mar 10. EBioMedicine. 2021. PMID: 33714029 Free PMC article.
-
H-ABC- and dystonia-causing TUBB4A mutations show distinct pathogenic effects.Sci Adv. 2022 Mar 11;8(10):eabj9229. doi: 10.1126/sciadv.abj9229. Epub 2022 Mar 11. Sci Adv. 2022. PMID: 35275727 Free PMC article.
References
MeSH terms
Substances
Grants and funding
LinkOut - more resources
Full Text Sources
