. 2020 Feb 6;3(3):e201900526.
doi: 10.26508/lsa.201900526. Print 2020 Mar.

Gammaherpesvirus-infected germinal center cells express a distinct immunoglobulin repertoire

Affiliations

Gammaherpesvirus-infected germinal center cells express a distinct immunoglobulin repertoire

Monika A Zelazowska et al. Life Sci Alliance. .

Abstract

The gammaherpesviruses (γHVs), human Kaposi sarcoma-associated herpesvirus (KSHV), EBV, and murine γHV68 are prevalent infections associated with lymphocyte pathologies. After primary infection, EBV and γHV68 undergo latent expansion in germinal center (GC) B cells and persists in memory cells. The GC reaction evolves and selects antigen-specific B cells for memory development but whether γHV passively transients or manipulates this process in vivo is unknown. Using the γHV68 infection model, we analyzed the Ig repertoire of infected and uninfected GC cells from individual mice. We found that infected cells displayed the hallmarks of affinity maturation, hypermutation, and isotype switching but underwent clonal expansion. Strikingly, infected cells displayed distinct repertoire, not found in uninfected cells, with recurrent utilization of certain Ig heavy V segments including Ighv10-1 In a manner observed with KSHV, γHV68 infected cells also displayed lambda light chain bias. Thus, γHV68 subverts GC selection to expand in a specific B cell subset during the process that develops long-lived immunologic memory.


Conflict of interest statement

The authors declare that they have no conflict of interest.

Figures

Figure S1.
Figure S1.. Representative flow plots demonstrating gating strategies.
(A) Germinal center B cells were gated on B cells (CD19+CD4CD8) and then germinal center cells (CD95+GL7+); zoomed in graph displays the YFP+ cells of the germinal center B cells. (B) Infected B cells were gated on B cells (CD19+CD4CD8) and then infected cells (YFP+); zoomed in graph displays the germinal center (CD95+GL7+) B cells of the infected B cells. (C) Total class-switched B cells were gated on B cells (CD19+CD4CD8), germinal center cells (CD95+GL7+), and then IgD cells for IgG1, IgG2b, IgG2c, IgG3, and IgM. (D) Infected class-switched B cells were gated on infected B cells (CD19+CD4CD8YFP+), germinal center cells (CD95+GL7+), and then IgD cells for IgG1, IgG2b, IgG2c, IgG3, and IgM.
Figure 1.
Figure 1.. Dynamics of B cells in MHV68-H2BYFP–infected mice.
(A) Flow cytometry analysis of germinal center (GC) cells (CD19+, GL7+, and CD95+) as a percentage of total spleen B cells. Each circle is the analysis of an individual mouse 14, 16, or 18 days postinfection (dpi) via intranasal (IN) or intraperitoneal (IP) MHV68-H2BYFP inoculation. Naïve, uninfected mice were used as control. (B) Summary of YFP+ (MHV68-YFP+) cells as a percentage of total splenic B cells. (C, D) Isotype expression profile of total GC B cells or (D) YFP+ GC B cells from the spleen of control naïve, IN, or IP inoculated mice at the indicated dpi.
Figure 2.
Figure 2.. MHV68-infected germinal center cells express lambda light chain more frequently.
Graph shows the percentage of cells expressing Kappa (Vκ), Lambda (Vλ), or both light chains from cells where the matching heavy chain was also identified. Single MHV+ and MHV− germinal center cells were isolated from the spleens of intranasal MHV68-inoculated mice 17 days postinfection on the basis of YFP+ or YFP expression. Analysis of expression was by RT-PCR and sequencing of individual cells. Five independent biological replicates were analyzed with replicate sample 1 consisting of two pooled mice and samples 2 through 5 from individual mice. The mean and SEM are displayed. t test, ***P < 0.001.
Figure S2.
Figure S2.. MHV68+ germinal center cells express lambda light chain more frequently.
Graph shows the percentage of all cells where mRNA expression of Kappa (Vκ), Lambda (Vλ), or both light chains was detected. Data as in Fig 2, but graph includes all cells where light chain sequence was obtained regardless if matching heavy chain was recovered. t test, **P < 0.01.
Figure 3.
Figure 3.. Differential usage of Ighv and Ighj exons in MHV68+ and MHV68− germinal center cells.
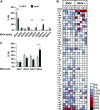
(A) Percentage of MHV+ and MHV− germinal center B cells that express an Ighv gene belonging to the indicated family. The mean of five independent biological sample is displayed. (B) Heat map of relative Ighv gene usage of MHV+ and MHV− populations from each of biological samples. Only Ighv segments present in more than one sample are displayed. Rows are ordered from the greatest positive (top) to negative (bottom) mean differential between the MHV+ and MHV− populations. (C) Summary of relative Ighj exon usage. Graphs show mean values from the five biological replicate samples with SEM. t test, *P ≤ 0.05, **P ≤ 0.01, ***P ≤ 0.001.
Figure 4.
Figure 4.. Clonal expansion of distinct repertoire in MHV68+ germinal center cells.
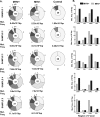
(A) Pie charts show proportion of individual cells belonging to distinct clonal groups within each population from five samples. Size of slice is proportional to number of sequences in each clonal group defined as sharing common Ighv, Ighj, and V(D)J junction. Number of total cells included in the pie chart is indicated in the center of each chart and the top clonal group(s) is(are) listed by Ighv, Ighj, and light chain type (κ or λ). Clonal groups that use Ighv10-1 are colored (Red). (B) Clonal groups with cells in both populations. Venn diagram circles are proportional to the number of clonal groups (listed inside circle) within MHV+ and MHV− populations of each sample. Brackets indicate the number of and relative percentage of clonal groups that were found in both populations. (C) Graph shows the number of cells that belong to the 14 clonal groups that were present in both the MHV+ and MHV− germinal center populations.
Figure 5.
Figure 5.. Comparison of hypermutation and CDR3 characteristics between MHV68+ and MHV68− germinal center (GC) cells.
(A) Pie charts show number of mutations in the expressed Ighv exon (from CDR1 to FR3) from MHV+ and MHV− GC cells as well as non-GC IgM+ control group from all samples. Pie chart wedges are proportional to the number of sequences with the indicated number of mutations. Total number of sequences analyzed from five samples is displayed in the center and average mutation frequency is indicated as mutations per base pair (bp) **P ≤ 0.01. (B) Mutation frequencies per bp calculated separately for indicated CDR and framework (FR) regions of the Ighv exon. (C) Representative MHV+ clone Ig phylogenic tree. Circle indicate a node (clonally related sequence) with isotype shown by the color. Dashed circle represents hypothetical split node intermediate. Each number denotes the number of mutations between nodes. (D, E) Analysis of relative length and (E) net charge distribution of the CDR3 region from the MHV+ and MHV− populations. The CDR3 characteristics from individual cells of all five samples is displayed as mean and SEM.
Figure S3.
Figure S3.. Comparison of mutation frequency and location between MHV68+ and MHV68− germinal center (GC) cell and non-GC cells.
Sequences of Ighv exons obtained from Sanger sequencing of B cells sorted individually onto 96-well plate. Figure shows five independent experiments: Samples 1–5. (A) Pie charts show number of mutations in Ighv exon (from CDR1 to FR3) identified by IMGT/HIghv-QUEST. Sizes of wedges are proportional to the number of Ighv segments with the number of mutations indicated outside the wedge. Total number of sequences analyzed is shown in the middle of pie chart. (B) Mutation frequencies per bp in MHV+ and MHV− GC cells calculated separately for the indicated regions of Ighv segments.
Figure 6.
Figure 6.. High-throughput sequencing repertoire and clonal analysis.
(A) Heat map showing the percentage of clonal groups using specific Ighv segments. Each sample consists of 20,000 MHV+ or MHV− germinal cells from individual mouse spleens 16 d after IP MHV68 inoculation. Rows are arranged from the greatest positive to negative mean differential between MHV+ and MHV− populations. Ighv segments are displayed that were present in more than one sample with a frequency above 0.1%. (B) Percentage of clonal groups using specific Ighj segments. (C) Percentage of clonal groups with designated Igh CDR3 length. Graphs show mean and SEM from three samples. (D) Clonal groups with the presence in both populations. Venn diagram circles are proportional to the number of clonal groups (listed inside circle) within MHV+ and MHV− populations of each sample. Control samples are replicate germinal center samples from a control mouse spleen. (E) Graphs display clonal groups with sequences MHV+ and MHV− populations. Number of reads from the MHV+ and MHV− populations are displayed for each clonal group.
Figure 7.
Figure 7.. Reactivity of immunoglobulins to self and viral antigens.
(A) ELISA test for reactivity against nuclear antigens. Graphs show OD405 values at 0.01, 0.1, and 0.01 μg/ml antibody concentrations of recombinant antibodies from MHV+ and MHV− populations. Anti-DNA antibody-positive control BV17-45 (dashed line) and negative control anti-myc antibody are displayed. The mean and SEM are displayed for each antibody tested in duplicates. (B) Antiviral specificity of antibodies. Flow cytometry analysis of cells infected with MHV68 and stained with recombinant antibodies. Plot shows percent of MHV infected (YFP+) cells reactive with individual recombinant antibodies from indicated populations. Positive control antibody that recognizes ORF46 (MHV68UNG) and negative control anti-myc are indicated. Mann–Whitney test, **P < 0.01.
Figure S4.
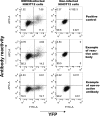
Figure S4.. Representative flow cytometry plots showing reactivity of representative antibodies against MHV68-infected NIH3T12 cells.
Flow plots were gated on live cells and display MHV68 positive (YFP+) and antibody staining (APC) of mock or infected NIH3T12 cultures. Positive control antibody that recognizes ORF46 (MHV68UNG) and example antibodies displaying positive and negative reactivity are shown.

Similar articles

Cited by

References

    1. Almohmeed YH, Avenell A, Aucott L, Vickers MA (2013) Systematic review and meta-analysis of the sero-epidemiological association between Epstein Barr virus and multiple sclerosis. PloS One 8: e61110 10.1371/journal.pone.0061110 - DOI - PMC - PubMed
    1. Alt FW, Zhang Y, Meng FL, Guo C, Schwer B (2013) Mechanisms of programmed DNA lesions and genomic instability in the immune system. Cell 152: 417–429. 10.1016/j.cell.2013.01.007 - DOI - PMC - PubMed
    1. Ascherio A, Munger KL (2015) EBV and autoimmunity. Curr Top Microbiol Immunol 390: 365–385. 10.1007/978-3-319-22822-8_15 - DOI - PubMed
    1. Barton E, Mandal P, Speck SH (2011) Pathogenesis and host control of gammaherpesviruses: Lessons from the mouse. Annu Rev Immunol 29: 351–397. 10.1146/annurev-immunol-072710-081639 - DOI - PubMed
    1. Bekerman E, Jeon D, Ardolino M, Coscoy L (2013) A role for host activation-induced cytidine deaminase in innate immune defense against KSHV. PLoS Pathog 9: e1003748 10.1371/journal.ppat.1003748 - DOI - PMC - PubMed

Publication types

LinkOut - more resources