. 2020 Feb;578(7793):102-111.
doi: 10.1038/s41586-020-1965-x. Epub 2020 Feb 5.

Analyses of non-coding somatic drivers in 2,658 cancer whole genomes

Esther Rheinbay #  1   2   3 Morten Muhlig Nielsen #  4 Federico Abascal #  5 Jeremiah A Wala #  1   6 Ofer Shapira #  1   7 Grace Tiao  1 Henrik Hornshøj  4 Julian M Hess  1 Randi Istrup Juul  4 Ziao Lin  1   8 Lars Feuerbach  9 Radhakrishnan Sabarinathan  10   11 Tobias Madsen  4 Jaegil Kim  1 Loris Mularoni  10   11 Shimin Shuai  12   13 Andrés Lanzós  14   15   16 Carl Herrmann  17   18 Yosef E Maruvka  1   2 Ciyue Shen  19   20 Samirkumar B Amin  21   22 Pratiti Bandopadhayay  1   7 Johanna Bertl  4 Keith A Boroevich  23 John Busanovich  1   7 Joana Carlevaro-Fita  14   15   16 Dimple Chakravarty  24   25 Calvin Wing Yiu Chan  17   26 David Craft  27 Priyanka Dhingra  28   29 Klev Diamanti  30 Nuno A Fonseca  31 Abel Gonzalez-Perez  10   11 Qianyun Guo  32 Mark P Hamilton  33 Nicholas J Haradhvala  1   2 Chen Hong  9   26 Keren Isaev  12   34 Todd A Johnson  23 Malene Juul  4 Andre Kahles  35 Abdullah Kahraman  36 Youngwook Kim  37 Jan Komorowski  30   38 Kiran Kumar  1   7 Sushant Kumar  39 Donghoon Lee  39 Kjong-Van Lehmann  35 Yilong Li  40   41 Eric Minwei Liu  28   29 Lucas Lochovsky  42 Keunchil Park  37 Oriol Pich  10   11 Nicola D Roberts  41 Gordon Saksena  1 Steven E Schumacher  1   7 Nikos Sidiropoulos  43 Lina Sieverling  9   26 Nasa Sinnott-Armstrong  44 Chip Stewart  1 David Tamborero  10   11 Jose M C Tubio  45   46   47 Husen M Umer  30   48 Liis Uusküla-Reimand  49   50 Claes Wadelius  51 Lina Wadi  12 Xiaotong Yao  52 Cheng-Zhong Zhang  53   54 Jing Zhang  39 James E Haber  55 Asger Hobolth  32 Marcin Imielinski  52   56 Manolis Kellis  1   57 Michael S Lawrence  1   2 Christian von Mering  36 Hidewaki Nakagawa  58 Benjamin J Raphael  59 Mark A Rubin  60   61   62 Chris Sander  19   20 Lincoln D Stein  12   13 Joshua M Stuart  63 Tatsuhiko Tsunoda  23   64   65 David A Wheeler  66 Rory Johnson  14   16 Jüri Reimand  12   34 Mark Gerstein  39   42   67 Ekta Khurana  28   29   61   62 Peter J Campbell  5   41 Núria López-Bigas  10   11   68 PCAWG Drivers and Functional Interpretation Working GroupPCAWG Structural Variation Working GroupJoachim Weischenfeldt  69   70 Rameen Beroukhim  71   72   73 Iñigo Martincorena  74 Jakob Skou Pedersen  75   76 Gad Getz  77   78   79   80 PCAWG Consortium
Collaborators, Affiliations

Analyses of non-coding somatic drivers in 2,658 cancer whole genomes

Esther Rheinbay et al. Nature. 2020 Feb.

Erratum in

  • Author Correction: Analyses of non-coding somatic drivers in 2,658 cancer whole genomes.
    Rheinbay E, Nielsen MM, Abascal F, Wala JA, Shapira O, Tiao G, Hornshøj H, Hess JM, Juul RI, Lin Z, Feuerbach L, Sabarinathan R, Madsen T, Kim J, Mularoni L, Shuai S, Lanzós A, Herrmann C, Maruvka YE, Shen C, Amin SB, Bandopadhayay P, Bertl J, Boroevich KA, Busanovich J, Carlevaro-Fita J, Chakravarty D, Chan CWY, Craft D, Dhingra P, Diamanti K, Fonseca NA, Gonzalez-Perez A, Guo Q, Hamilton MP, Haradhvala NJ, Hong C, Isaev K, Johnson TA, Juul M, Kahles A, Kahraman A, Kim Y, Komorowski J, Kumar K, Kumar S, Lee D, Lehmann KV, Li Y, Liu EM, Lochovsky L, Park K, Pich O, Roberts ND, Saksena G, Schumacher SE, Sidiropoulos N, Sieverling L, Sinnott-Armstrong N, Stewart C, Tamborero D, Tubio JMC, Umer HM, Uusküla-Reimand L, Wadelius C, Wadi L, Yao X, Zhang CZ, Zhang J, Haber JE, Hobolth A, Imielinski M, Kellis M, Lawrence MS, von Mering C, Nakagawa H, Raphael BJ, Rubin MA, Sander C, Stein LD, Stuart JM, Tsunoda T, Wheeler DA, Johnson R, Reimand J, Gerstein M, Khurana E, Campbell PJ, López-Bigas N; PCAWG Drivers and Functional Interpretation Working Group; PCAWG Structural Variation Working Group; Weischenfeldt J, Beroukhim R, Martincorena I, Pedersen JS, Getz G; PCAWG Consortium. Rheinbay E, et al. Nature. 2023 Feb;614(7948):E40. doi: 10.1038/s41586-022-05599-9. Nature. 2023. PMID: 36697832 Free PMC article. No abstract available.

Abstract

The discovery of drivers of cancer has traditionally focused on protein-coding genes1-4. Here we present analyses of driver point mutations and structural variants in non-coding regions across 2,658 genomes from the Pan-Cancer Analysis of Whole Genomes (PCAWG) Consortium5 of the International Cancer Genome Consortium (ICGC) and The Cancer Genome Atlas (TCGA). For point mutations, we developed a statistically rigorous strategy for combining significance levels from multiple methods of driver discovery that overcomes the limitations of individual methods. For structural variants, we present two methods of driver discovery, and identify regions that are significantly affected by recurrent breakpoints and recurrent somatic juxtapositions. Our analyses confirm previously reported drivers6,7, raise doubts about others and identify novel candidates, including point mutations in the 5' region of TP53, in the 3' untranslated regions of NFKBIZ and TOB1, focal deletions in BRD4 and rearrangements in the loci of AKR1C genes. We show that although point mutations and structural variants that drive cancer are less frequent in non-coding genes and regulatory sequences than in protein-coding genes, additional examples of these drivers will be found as more cancer genomes become available.


Conflict of interest statement

The following authors declare that they have competing interests. P.B. receives grant funding from Novartis from an unrelated project; R.B. owns equity in Ampressa Therapeutics and receives grant funding from Novartis; G.G. receives research funds from IBM and Pharmacyclics and is an inventor on patent applications related to MuTect, ABSOLUTE, MutSig, MSMuTect, MSMutSig and POLYSOLVER; B.J.R. is a consultant at and has ownership interest (including stock, patents and so on) in Medley Genomics; O.S. is currently an employee of Cedilla Therapeutics); and Y.L. is currently an employee of Seven Bridges Genomics.

Figures
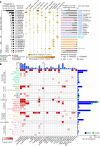
Fig. 1
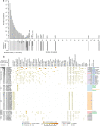
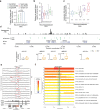
Fig. 1. Non-coding point mutations in PCAWG.
a, The bar chart (left) shows the total number of patients across PCAWG with mutations at a particular genomic hotspot (chromosome:position). The top 25 hotspots are grouped as known drivers or induced by mutational processes. The table (middle) shows the frequency of mutations across a subset of PCAWG cohorts. Lymphoid malignancies comprise Lymph–BNHL and Lymph–CLL. The stacked bar chart (right) shows the contribution of mutational processes to the hotspot mutations (Methods). Gene names are given when hotspots overlap functional elements (colour-coded), with amino acid (AA) alterations for protein-coding genes (solidus denotes substitution with any one of the indicated amino acids). Extended Data Fig. 1b shows the top 50 hotspots, and all cohorts. b, Significant non-coding elements (Q < 0.1 of Brown’s combined P values of up to 13 driver discovery methods; Methods) identified before manual review in cohorts with at least one hit. Colour represents significance levels. Details are provided in Supplementary Table 5. *Potential technical artefact; #targets affected by mutational processes. AdenoCA, adenocarcinoma; CNS, central nervous system; Eso, oesophageal; GBM, glioblastoma; HCC, hepatocellular carcinoma; Medullo, medulloblastoma; Panc, pancreatic; Prost, prostate; RCC, renal cell carcinoma; Repr., reproductive organs; SCC, squamous cell carcinoma; TCC, transitional cell carcinoma; Thy, thyroid. HIST1H2AM is also known as H2AC17; Ala.TGC as TRA-TGC3-1Met.CAT as TRM-CAT1-1; and Gly.GCC as TRG-GCC2-3. PTDSS1/MTERF3 denotes that 5′ UTR mutations in PTDSS1 also overlap the MTERF3 promoter.
Fig. 2
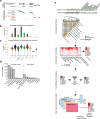
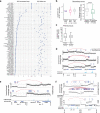
Fig. 2. Newly identified non-coding driver candidates and localized transcription-associated mutational process.
a, Recurrent mutations and associated gene expression in the highly conserved TOB1 3′ UTR. Tracks showing conservation score (PhyloP, grey), miRNA-binding sites (TargetScan (top track) and Ago-Clip (bottom track)), and observed SNVs (blue) and indels (green). Expression of TOB1 in mutated (n = 13) and wild-type (n = 886) cases (right). P value based on two-sided Wilcoxon rank-sum test. Bars represent means. CNA, copy-number alteration. b, Indels and SNVs overlapping the TP53 5′ region and their effect on gene expression. H3K4me3 from the GM12878 cell line (ENCODE). Event numbers match with gene expression in the right panel (red dot, mutated sample; black bar, median). P value represents Fisher’s combination of permutation tests within each tumour type. ChRCC, chromophobe renal cell carcinoma; FPKM, fragments per kilobase of transcript per million mapped reads. c, Overall pan-cancer distribution of indels and SNVs in ALB, NEAT1 and MALAT1 genomic loci (lymphoid tumour samples were excluded owing to AID). d, Quantification of average indel rates for genes with significantly mutated 3′ UTRs. Error bars represent 95% binomial confidence intervals. e, Contribution of indels of different sizes in: all protein-coding and long non-coding RNA genes; ALB; NEAT1; MALAT1; MIR122; and the remaining genes enriched in 2–5-bp indels. f, SNV and indel rates (total events per Mb per patient) in different functional regions of 18 protein-coding genes enriched in 2–5-bp indels (without ALB, which contributed 47% of indels). Red lines indicate background indel and SNV rates estimated from all protein-coding genes. Error bars as in d; raw counts provided in Supplementary Table 18. cf, Mutations analysed in all unique cases (n = 2,583).
Fig. 3
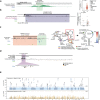
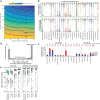
Fig. 3. Significantly recurrent breakpoints and juxtapositions.
a, Relative enrichment (Fisher’s exact test) for events per tumour type for the 20 most-significant SRBs (circle size). Loci are labelled by the likely driver gene from the CGC. For gene symbols separated by a solidus, both or either of the genes are intended. b, Rearrangement dispersion score versus mean replication timing of the 53 SRBs. Colours indicate fusion (purple), fragile-like (green), deletion (blue), amplification (red) or copy-neutral (black) events. c, Tumour-to-normal read coverage ratio in an ovarian tumour with a BRD4 microdeletion; red arrow indicates the rearrangement (top). Breakpoint density across PCAWG breast and ovarian cancers (middle). Enhancer locations from breast (BRCA) and ovarian (OV) tissue (bottom). d, Somatic copy number at the BRD4 and NOTCH3 locus in breast and ovarian cancers with (SV+) and without (SV−) rearrangements. e, Gene expression per absolute copy number for BRD4 and NOTCH3. f, The 30 most-significant SRJs, with their relative enrichment (circle size) per tumour type, annotated with oncogenic fusions from the Catalogue of Somatic Mutations in Cancer (COSMIC) (left), CGC gene (centre) and protein disruption (right) (Methods). ATP5E is also known as ATP5F1E. g, Expression correlates of rearrangements in SRJs from COSMIC (purple), other SRJs (pink) or not in any SRJ (grey). For each rearrangement (R), the primary locus (left) is defined as the breakpoint within 100 kb of the gene that is most overexpressed in rearranged samples; the secondary locus (right) is the other breakpoint. Expression at the primary locus in samples with the rearrangement relative to samples without the rearrangement is greater for SRJs than for other rearrangements (left). The tissue-specific expression at the secondary locus in wild-type (WT) samples, relative to samples of different tissue types, is greater for SRJs than other rearrangements (right). P values represent comparisons to ‘not in SRJ’. d, e, g, Box plots show the interquartile range, median and 95% confidence interval; two-sided t-test. h, TERT promoter mutations and rearrangements across PCAWG melanomas. i, Rearrangements between TERT promoter and BASP1 and MYO10 locus result in focal amplification and relocation of distal enhancers to TERT. AML, acute myeloid leukaemia; Colorect, colorectal; Leiomyo, leiomyosarcoma; MPN, myeloproliferative neoplasm; Osteosarc, osteosarcoma; PiloAstro, pilocytic astrocytoma.
Fig. 4
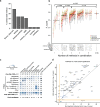
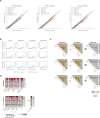
Fig. 4. Power considerations and paucity of non-coding drivers.
a, Heat map shows the minimal frequency of a driver element with ≥90% discovery power. Power is dependent on the background mutation frequency (above the heat map), the element length (median length depicted in Extended Data Fig. 2c) and the number of patients with mutations (cell numbers). For example, the pan-cancer cohort is powered to discover a protein-coding driver gene (coding sequence (CDS)) present in <1% (18 patients), whereas the Bladder–TCC cohort is only powered to discover drivers present in at least 27% (6 patients). b, Number of samples required to detect 90% of recurrent juxtapositions across 90% of pairs of loci, as a function of the median number of rearrangements per sample and the rate above background at which the fusion recurs (solid lines). The vertical dashed lines represent the median rearrangement rates of each cancer type, and the stars on these lines indicate the numbers of whole genomes analysed for that cancer type. c, Number of SRJs detected after downsampling the data to various sample sizes, separately indicating rearrangements that recur at high (≥12%; red) and low (<12%; black) rates above background; their sum (blue). d, Number of observed mutations (SNVs and indels) in cis-regulatory and coding regions of 603 protein-coding cancer genes with the expected numbers shown in lighter colours (left). Right, the number of excess mutations (that is, the estimated number of driver mutations) (right). The grey fraction of promoter mutations indicates TERT events. Error bars show 95% binomial confidence intervals. Only samples with high detection sensitivity were included (n = 936).
Extended Data Fig. 1
Extended Data Fig. 1. Mutational hotspots in additional tumour types.
a, Bar plot of number of positions (y axis) mutated in n  patients (x axis). The stacked bar charts under the bar plot show the proportion of protein-coding (dark grey) and non-coding (light grey) positions. b, Distribution of SNVs in top 50 single-site hotspots across all analysed individual cohorts and meta-cohorts. Hotspots are grouped as known drivers or induced by mutational processes. The table (middle) shows the frequency of mutations across the PCAWG cohorts. Stacked bar chart (right) shows the contribution of mutational processes to the hotspot mutations (Methods). Gene names are given when hotspots overlap with functional elements (colour-coded), with amino acid alterations for protein-coding genes.
Extended Data Fig. 2
Extended Data Fig. 2. Element-based driver discovery and combination of P values.
a, Schematic describing definition of types of functional element (Methods). Functional elements (black) are defined on the basis of transcript annotations from various databases. Elements arising from multiple transcripts with the same gene identity are collapsed, as seen here for the protein-coding isoforms. Promoter elements are defined as 200 bases upstream and downstream of the transcription start sites of the transcripts of a gene (green). Splice site elements extend 6 and 20 bases from the 3′ and 5′ exonic ends into intronic regions, respectively (light blue). Regions overlapping protein-coding bases and protein-coding splice sites are subtracted from other regions. b, Percentage of genomic coverage for each element type. c, Distribution of element lengths for each element type. Thick lines indicate interquartile ranges and short horizontal bars indicate the medians. d, Organization of meta-cohorts defined by tissue of origin and organ system. Pan-cancer contains all cancers, excluding Skin–Melanoma and lymphoid malignancies. e, Combination workflow: overview of methods of driver discovery and their lines of evidence to evaluate candidate gene drivers. Methods using each feature are marked with a box in the appropriate track. Heat map displaying Spearman’s correlation of P values across the different driver-discovery algorithms based on simulated (null model) mutational data. Dendrogram illustrates the relatedness of method P values, and algorithm approaches are marked by coloured boxes on dendrogram leaves. Next, P values are combined with Brown’s method on the basis of the calculated correlation structure. Individual method (left) and integrated (right) log-transformed P values are shown in a heat map (grey, missing data). Post-filtering used several criteria to identify likely suspicious candidates. Significant driver candidates were identified after controlling for multiple hypothesis testing based on an FDR Q value threshold of 0.1 (blue asterisk). Candidates with Q values below 0.25 (blue dash) were also considered of interest.
Extended Data Fig. 3
Extended Data Fig. 3. Sensitivity of driver-discovery methods and filter statistics.
a, Percentage of coding-driver discovery runs (with stable F1 score, n = 33), across all cohorts, in which the method had the highest F1 score (Methods). b, F1 score of different methods of driver discovery, and different combinations evaluated in the four largest cohorts (pan-cancer (n = 2,278), carcinoma (n = 1,856), adenocarcinoma (n = 1,631) and digestive tract (n = 797)). Only methods that used the same algorithm to call coding and non-coding drivers were evaluated. Vertical lines indicate 95% confidence intervals. Horizontal black lines mark the median in each group. P values were calculated with the two-sided non-parametric Mann–Whitney U test. c, On top, the initial number of hits identified as recurrently mutated for each element type. The element types mature miRNA (n = 2 before filtering) and miRNA promoters (n = 16 before filtering) were omitted from the table. The heat map shows the number of hits filtered at each step in the sequential application of filters and post-filtering re-application of the FDR correction. Background colours indicate the corresponding percentage of input element removed. The final numbers of hits (including those that were later filtered by the comprehensive vetting procedures) are indicated below the heat map. d, Sensitivity versus specificity in individual cohorts versus meta-cohorts for candidate drivers: Q values for the most significant individual cohort (x axis) versus meta cohort (y axis) are shown. Driver elements are coloured by their element type. Q values derived from combination of P values from individual driver-discovery methods (Methods).
Extended Data Fig. 4
Extended Data Fig. 4. Mutation-to-expression correlation and focal copy-number alterations.
a, Expression is compared between mutated and non-mutated samples. For each element, the z score of the expression values for mutated and wild type in the significant cohort is plotted. For copy number, CNA amplification indicates CNA > 10; CNA gain indicates CNA ≥ 3; CNA loss indicates CNA ≤ 1; and no events indicates CNA < 3 and CNA > 1. If a patient is mutated with multiple types of point mutation, indels are indicated over SNVs. For TERT, only samples powered to call mutation status were used. P values are based on a two-sided Wilcoxon rank-sum test. Bars indicate means. b, Copy-number profiles of 55 of 441 stomach adenocarcinomas from TCGA show copy-number gains around HES1. TOB1 and its gene neighbour WFIKKN2 are focally amplified in cancer (172 of 10,844 total samples from 33 cancer types are shown). RMRP focal amplifications in TCGA cancers (160 of 10,844 total tumours shown).
Extended Data Fig. 5
Extended Data Fig. 5. Non-coding driver candidates.
a, MTG2 promoter locus (left) and associated gene-expression changes in carcinoma tumours (right). Expression of MTG2 in mutated (n = 3) versus the carcinoma meta-cohort wild-type cases (n = 896). Two-sided Wilcoxon rank-sum test. Bars represent means. b, Genomic locus of NFKBIZ 3′ UTR (left) and associated gene-expression changes in Lymph–BNHL (right). Expression of NFKBIZ in mutated (n = 6) versus wild-type cases (n = 98). Test and bars as in b. c, Genomic locus of the RMRP transcript and promoter region (left). RMRP is an RNA component of the endoribonuclease RNase MRP, the function of which depends on its RNA secondary and tertiary structure. The RNA secondary structure, tertiary structure interactions, protein and substrate interactions, and mutations with their predicted structural effect (right) of RMRP; lymphoma and melanoma mutations are excluded. d, MIR142 locus and mutations in patients with lymphoma with the AID signature annotation. e, Manhattan-style plot showing significance of mutation recurrence enrichment for genomic bins (top) and ultraconserved elements (bottom) across cohorts (Methods; Supplementary Table 9).
Extended Data Fig. 6
Extended Data Fig. 6. A transcriptional process creates passenger mutations in highly expressed, tissue-specific genes.
a, Relative rate of loss-of-heterozygosity (LOH) compared between mutated and wild-type samples for all significant elements, coloured by element type and highlighting significant LOH enrichments with an outside black circle (Fisher’s exact test, one-sided; Q < 0.1). b, Average cancer allelic fraction (CAF) compared between each significant genomic element and the corresponding flanking regions (±2 kb and introns; overlapping coding exons were excluded). The size of the points represents the number of mutated samples for each particular element. Genes with significantly higher CAFs (t-test, one-sided; Q < 0.1) are highlighted with an outside black circle. c, mRNA expression of genes enriched in 2–5-bp indels in their respective tissues. Boxes show the interquartile range and median. The first box contains background gene-expression levels. Red and grey dots correspond to samples with (m) and without (n − m) indels in the corresponding gene. d, Heat map showing the levels of expression across types of cancer for the genes enriched in 2–5-bp indels.
Extended Data Fig. 7
Extended Data Fig. 7. Overview of structural-variant analysis.
Schematic indicating analysis approach. Left, rearrangements and rearrangement junctions in three hypothetical genomes (top) and the two analysis approaches (bottom): the 1D analysis for recurrent breakpoints and the 2D analysis for recurrent juxtapositions between pairs of loci. Right, the 1D density of breakpoints genome-wide (top) and 2D density of juxtapositions (bottom) across 2,693 cancer genomes (Methods).
Extended Data Fig. 8
Extended Data Fig. 8. Gene-expression effects of SRBs.
a, Fraction of recurrent breakpoint loci associated with biallelic inactivation of a known tumour suppressor gene (frag-SCNA, 0/12; neutral-SCNA, 0/14; del-SCNA, 5/8; Fisher’s exact test). b, Distance in bp to the nearest tissue-specific enhancer for each breakpoint class. Dashed grey line represents 1,000 randomly selected breakpoints from the same tumour samples. All box plots show the interquartile range, median and 95% confidence interval. c, Expression fold change for the gene with the most-altered expression within 1 Mb of the cluster centroid in samples with, compared to samples without, a breakpoint at the cluster locus. Random controls (in dashed boxes) represent 1,000 randomly selected breakpoints. P values are from two-sided t-tests (Methods). d, Breakpoint density near AKR1C genes (top), locations of enhancers (middle) and expression of local genes (bottom; n = 7 SV+ tumours, n = 41 SV− lung squamous cell tumours; two-sided t-test) in samples with and without local rearrangements. e, Ratio of tumour-to-normal read coverage across six breast tumours and eight ovarian tumours with focal BRD4 exon 1 and intron 1 deletions. Red lines indicate rearrangements. f, Amplification structure (absolute copy number, y axis) of the BRD4 and NOTCH3 locus in breast and ovarian tumours with a BRD4 focal deletion. In most cases, the copy-number caller identified the focal deletion. However, in some cases, the deletions were too small to be identified only using read depth. When combining read depth and rearrangement signals in a, there is clear evidence for focal deletions. Deletion locations are marked by an asterisk.
Extended Data Fig. 9
Extended Data Fig. 9. Gene-expression effects of SRJs.
a, Assessment of SRJ robustness against unaccounted for mechanistic and technical confounders. Left, a robustness factor, defined as the ratio between the background probability value that would lower the P value of an SRJ below the genome-wide P-value threshold and the estimator for the background probability from our 2D model. Higher robustness values represent lower susceptibility to unaccounted variations in the background model. The top 48 SRJs have a robustness factor greater than 2, which suggests that these SRJs would remain significant even if the true background rate was twice as high as our model estimates. Right, the effect size is calculated as the difference in observed and estimated number of SRJs in units of standard deviation (assuming binomial distribution of structural variant count per 2D genomic region). Most SRJs are well above ten standard deviations of the predicted value. b, Characteristics of SRJ secondary loci. Left, fold expression enrichment of the most highly overexpressed gene in the secondary locus in cancer samples with these fusions relative to cancers of the same histology without the fusion. Right, the distance from the SRJ secondary locus (green) to the nearest enhancer is significantly smaller (P < 0.05; two-sided t-test) compared to randomly selected breakpoints (grey). c, Fold expression enrichment of the most highly overexpressed gene in the primary locus, for fusions that disrupt protein-coding sequences and fusions that do not. All box plots show the interquartile range, median and 95% confidence interval. d, Rearrangements between the TERT promoter and the BASP1 and MYO10 locus result in focal amplification of TERT and relocation of distal enhancers to TERT. e, TERT-NDUFC2 fusion in two melanoma samples connecting TERT with an enhancer-rich region next to NDUFC2. Both samples also have focal amplifications of TERT. f, Recurrent translocation between EGFR in chromosome 7 and the KL and STARD13 locus on chromosome 13. In all three samples, the rearrangement contributed to the amplification of EGFR.
Extended Data Fig. 10
Extended Data Fig. 10. A lack of detection power in specific elements.
a, Number of tumour–normal pairs needed to detect fusions with 90% power as a function of the span of the fusion and the rate above background at which it recurs. The red asterisks indicate the numbers of samples required to detect 100-kb and 100-Mb fusions that recur at 0.5% above their background rates. b, Distribution of TERT promoter hotspot (top, chromosome 5: 1,295,228; bottom, chromosome 5: 1,295,250; hg19) detection sensitivity for each patient, by cohort. Grey dots indicate values for individual patients inside estimated distribution (areas coloured by cohort). Horizontal black bars mark the medians. Numbers above distributions indicate the percentage of patients powered (detection sensitivity ≥ 90%) in each cohort. Cohort sizes as in Fig. 4a. c, Percentage of patients with observed (blue) and inferred missed (red) mutations at the chromosome 5: 1,295,228 and chromosome 5: 1,295,250 TERT promoter hotspot sites. Error bars indicate 95% Poisson confidence interval. Numbers above bars show the total inferred number of TERT promoter mutations for each site in this cohort. Red numbers indicate the absolute number of inferred missed mutations (owing to a lack of read coverage). Cohort sizes as in Fig. 4a. d, Detection sensitivity for the two TERT promoter hotspots across all samples showing the variation in powered samples. Red vertical line (x = 0.9) indicates cutoff for ‘sufficiently powered samples’. e, Mean detection sensitivity in 1,000 randomly selected putative passengers (pass) and 603 cancer genes (driv) across element types: promoters, 5′ UTRs, CDS and 3′ UTRs. The left panel shows the results for all samples and the right panel corresponds to the set of samples with high sensitivity at TERT hotspots. Boxes show the interquartile range and median; outliers are shown as circles. Weighted sensitivity means are shown at the top of the box plot.
Extended Data Fig. 11
Extended Data Fig. 11. P value combination details.
a, Quantile–quantile plots of P values reported by various driver-detection algorithms on the three simulated datasets (Broad, DKFZ and Sanger; shown for coding regions (n = 20,172) in the meta-carcinoma cohort; see Methods for details for the statistical background model or test of each algorithm) showed no major enrichment of mutations above the background rate. Results generally followed the expected null (uniform) distribution, and the P values reported on simulated data were subsequently used to assess the covariance of method results. b, Quantile–quantile plots of integrated P values using the Brown and Fisher methods for combining P values across the results from different driver-detection algorithms were generated for a few representative tumour cohorts (shown here for coding regions). Brown combined P values (light blue) generally followed the null distribution as expected, whereas Fisher combined P values were significantly inflated (dark blue), confirming that dependencies existed between the results reported by the various driver-detection algorithms. To simplify the integration procedure, we calculated covariances using P values from the observed data instead of simulated data and found that the integrated results based on the observed covariances (first column of plots) were essentially the same as the results obtained using the simulated covariances (second, third, and fourth columns of plots). c, Triangular heat maps showing the Spearman correlations of P values among the various driver-detection methods in observed versus simulated data (coding regions (n = 20,172), colorectal adenocarcinoma cohort) are highly similar. Differences in the observed and simulated correlation values (shown in the heat maps on the far right) were minimal, and thus the final integration of P values across methods was performed using covariances estimated on observed data. d, Brown combined P values based on observed and simulated covariance estimations (shown on the right, top heat map, for coding regions in glioblastoma) did not differ noticeably. In cases in which individual methods reported results that yielded substantially fewer hits than the median across all methods (bottom heat map, methods in light grey with results in dashed box), removing the methods from the integration did not affect the number of significant genes identified (right column of results in bottom heat map, shown for coding regions in lung adenocarcinoma). Number of coding regions as in c.

Comment in

Similar articles

Cited by

References

    1. Bailey MH, et al. Comprehensive characterization of cancer driver genes and mutations. Cell. 2018;174:1034–1035. doi: 10.1016/j.cell.2018.07.034. - DOI - PMC - PubMed
    1. Zack TI, et al. Pan-cancer patterns of somatic copy number alteration. Nat. Genet. 2013;45:1134–1140. doi: 10.1038/ng.2760. - DOI - PMC - PubMed
    1. Lawrence MS, et al. Discovery and saturation analysis of cancer genes across 21 tumour types. Nature. 2014;505:495–501. doi: 10.1038/nature12912. - DOI - PMC - PubMed
    1. Beroukhim R, et al. The landscape of somatic copy-number alteration across human cancers. Nature. 2010;463:899–905. doi: 10.1038/nature08822. - DOI - PMC - PubMed
    1. The ICGC/TCGA Pan-Cancer Analysis of Whole Genomes Network. Pan-cancer analysis of whole genomes. Nature 10.1038/s41586-020-1969-6 (2020).

Publication types