. 2020 Feb 2;9(2):343.
doi: 10.3390/cells9020343.

PPM1A Controls Diabetic Gene Programming through Directly Dephosphorylating PPARγ at Ser273

Affiliations

PPM1A Controls Diabetic Gene Programming through Directly Dephosphorylating PPARγ at Ser273

Keon Woo Khim et al. Cells. .

Abstract

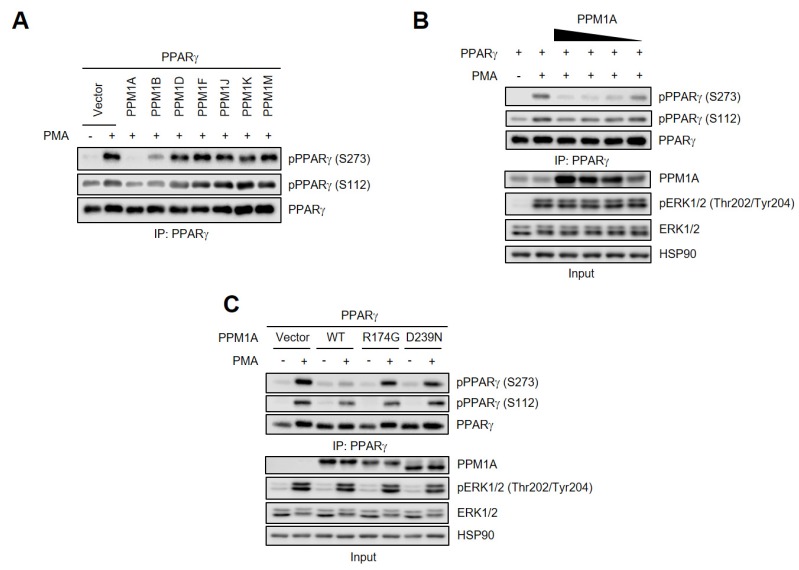
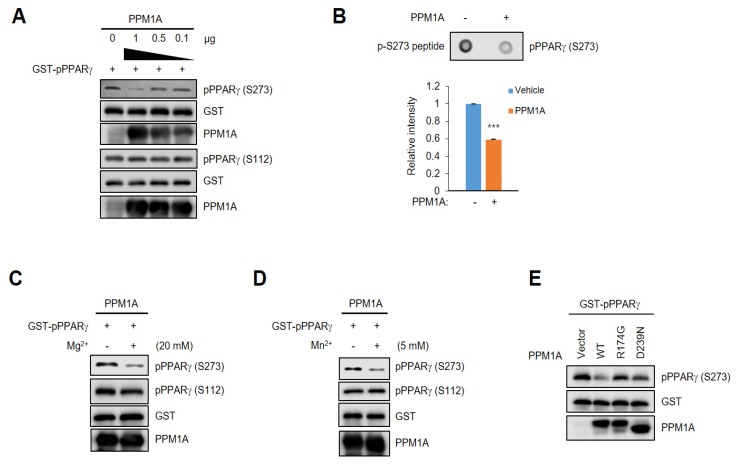
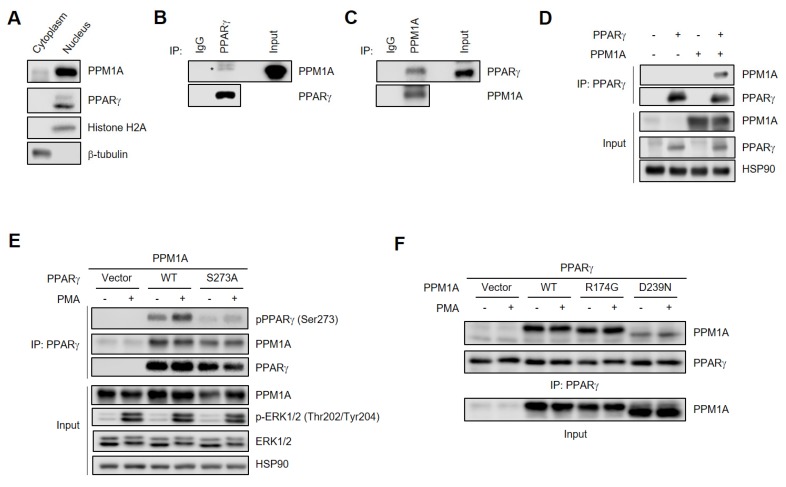
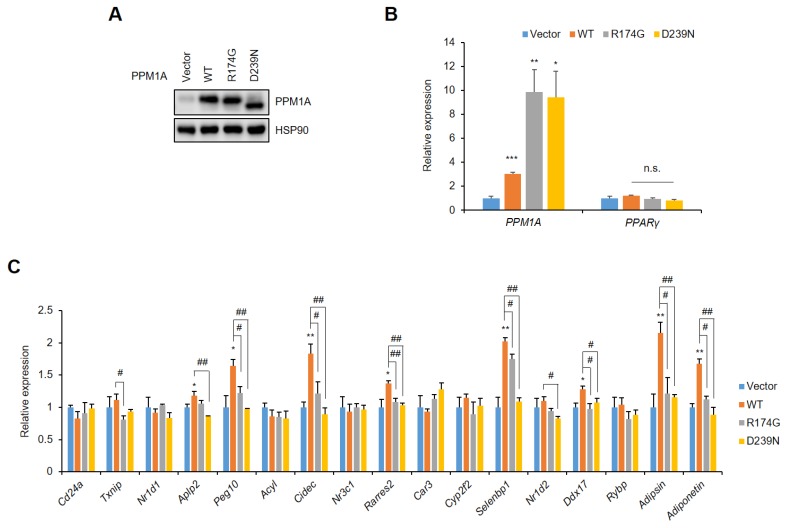
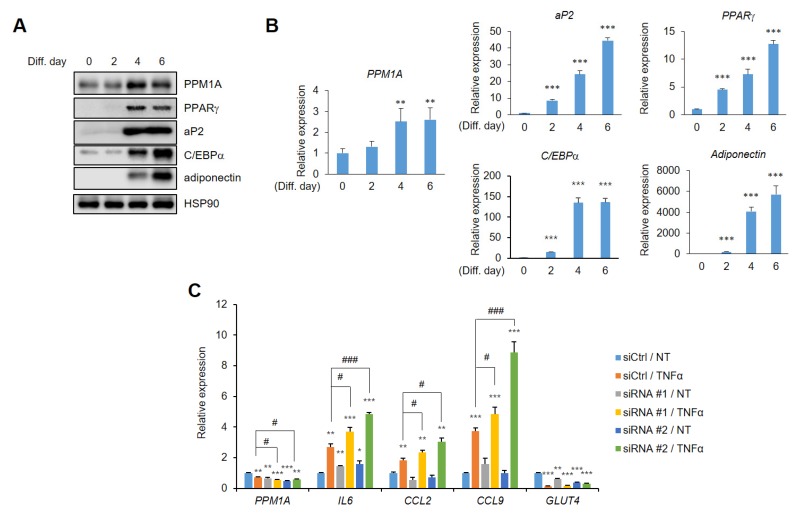
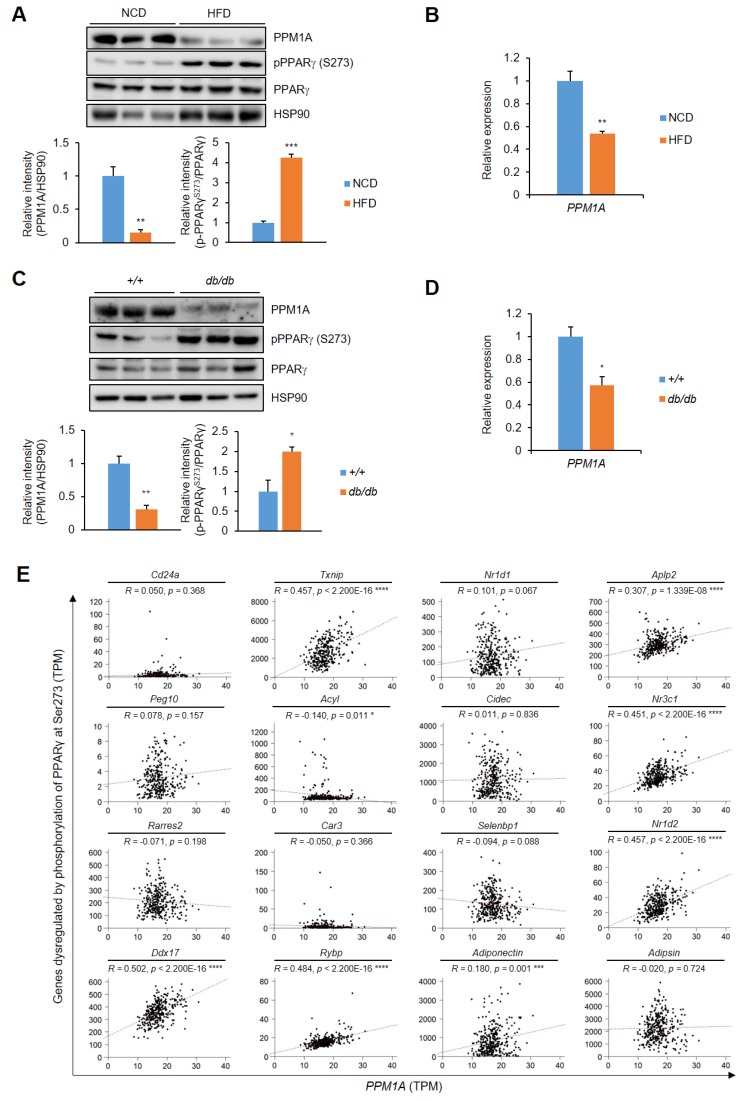
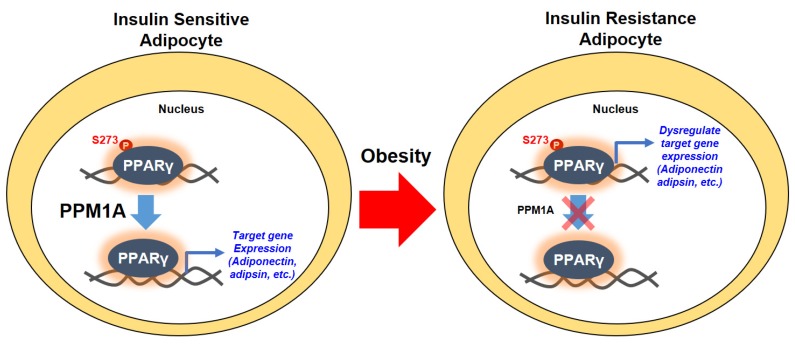
Peroxisome proliferator-activated receptor γ (PPARγ) is a master regulator of adipose tissue biology. In obesity, phosphorylation of PPARγ at Ser273 (pSer273) by cyclin-dependent kinase 5 (CDK5)/extracellular signal-regulated kinase (ERK) orchestrates diabetic gene reprogramming via dysregulation of specific gene expression. Although many recent studies have focused on the development of non-classical agonist drugs that inhibit the phosphorylation of PPARγ at Ser273, the molecular mechanism of PPARγ dephosphorylation at Ser273 is not well characterized. Here, we report that protein phosphatase Mg2+/Mn2+-dependent 1A (PPM1A) is a novel PPARγ phosphatase that directly dephosphorylates Ser273 and restores diabetic gene expression which is dysregulated by pSer273. The expression of PPM1A significantly decreases in two models of insulin resistance: diet-induced obese (DIO) mice and db/db mice, in which it negatively correlates with pSer273. Transcriptomic analysis using microarray and genotype-tissue expression (GTEx) data in humans shows positive correlations between PPM1A and most of the genes that are dysregulated by pSer273. These findings suggest that PPM1A dephosphorylates PPARγ at Ser273 and represents a potential target for the treatment of obesity-linked metabolic disorders.

Keywords: PPARγ S273 phosphorylation; PPM1A; diabetic gene reprogramming; insulin sensitivity; obesity.


Conflict of interest statement

The authors declare no conflict of interest.

Figures

Figure 1
Figure 1
Identification of novel phosphatase of peroxisome proliferator-activated receptor (PPARγ) at Ser273 and Ser112. (A) Human embryonic kidney 293 (HEK-293) cells were transfected with protein phosphatase Mg2+/Mn2 (PPM) and PPARγ. PPARγ was phosphorylated by phorbol myristate acetate (PMA) (500 nM) for 30 min. Immunoprecipitated PPARγ were analyzed by Western blotting. (B) HEK-293 cells were transfected with protein phosphatase Mg2+/Mn2+-dependent 1A (PPM1A) with PPARγ in a dose-dependent manner. PPARγ phosphorylation was analyzed in immunoprecipitated cell lysates, and PPM1A, extracellular signal-regulated kinase (ERK)1/2, and ERK1/2 phosphorylation were measured in whole cell lysate (input) by Western blotting. (C) Wild-type (WT) PPM1A and its catalytically inactive mutants (R174G and D239N) were transfected into HEK-293 cells with PPARγ. PPARγ phosphorylation was analyzed by Western blotting. HSP90 was used as loading control.
Figure 2
Figure 2
PPM1A directly dephosphorylates PPARγ at Ser273. (A) In vitro PPM1A phosphatase assay was performed with full-length glutathione S-transferase (GST)-fused phosphorylated PPARγ and recombinant PPM1A. Total PPARγ and PPARγ phosphorylation were analyzed by Western blotting. (B) Dot blot assay was performed using phospho-peptide flanking pSer273 residue with recombinant PPM1A. S273 phosphorylation of PPARγ was analyzed by Western blotting. Three independent experiments were performed and the level of PPARγ phosphorylation was quantified by Image Studio. (C,D) In vitro PPM1A phosphatase assay was performed in the presence of magnesium and manganese ions (20 mM and 5 mM, respectively). Western blots were performed to detect each protein indicated. (E) In vitro PPM1A phosphatase assay was performed with GST-fused phosphorylated PPARγ and immune-purified WT PPM1A and two mutants. PPARγ phosphorylation was analyzed by Western blotting. *** p < 0.001; Error bars indicate standard error of the mean (SEM).
Figure 3
Figure 3
PPM1A directly interacts with PPARγ in adipocyte. (A) Western blot analysis of subcellular fractions in 3T3-L1 adipocytes. Histone H2A and β-tubulin was detected for nucleus and cytoplasmic marker protein, respectively. (B, C) Endogenous PPM1A and PPARγ were immunoprecipitated and physical interaction between them was analyzed by Western blotting. (DF) PPARγ was phosphorylated by PMA (500 nM) for 30 min in HEK-293 cells. (D) HEK-293 cells were transfected with PPARγ and PPM1A. Immunoprecipitation was performed, and each protein was analyzed by Western blotting. (E) WT PPARγ and phospho-defective mutant of PPARγ (S273A) were transfected in HEK-293 cells with PPM1A. Immunoprecipitation was performed, and each protein was analyzed by Western blotting. (F) WT PPM1A and its catalytically inactive mutants R174G and D239N were transfected in HEK-293 cells with PPARγ. Immunoprecipitation was performed and each protein was analyzed by Western blotting.
Figure 4
Figure 4
Knockdown of PPM1A downregulates gene sets dysregulated by pSer273. 3T3-L1 adipocytes were transfected with specific human siRNAs targeting PPM1A. (A) Western blot of 3T3-L1 cell lysates transfected by siRNAs. (B, C) 3T3-L1 cells were introduced with specific mouse PPM1A targeting siRNAs. Relative mRNA expression of PPM1A and PPARγ are shown in (B), and expression of specific gene sets dysregulated by pS273 are shown in (C). * p < 0.05; ** p < 0.01; Error bars indicate SEM; n.s., not significant.
Figure 5
Figure 5
Forced expression of PPM1A restores the diabetic gene set in adipocytes. 3T3-L1 adipocytes were infected with lentivirus expressing of WT PPM1A and its mutants (R174G and D239N). (A) Western blot of 3T3-L1 cell lysates transfected by PPM1A. (B, C) 3T3-L1 cells expressing WT PPM1A and its mutants were differentiated into adipocytes. Relative mRNA expression of PPM1A and PPARγ is shown in (B), and expression of diabetic gene set regulated by pSer273 is shown in (C). * p < 0.05; ** p < 0.01; *** p < 0.001 vs. ‘vector’; # p < 0.05; ## p < 0.01 vs. ‘WT’; Error bars indicate SEM; n.s., not significant.
Figure 6
Figure 6
PPM1A ameliorates insulin resistance in adipocytes. (A) Western blot of PPM1A and adipogenic marker proteins from 3T3-L1 cells during adipogenesis. (B) Relative mRNA expression of PPM1A and adipogenic marker genes were investigated by RT-qPCR (n = 3). (C) Control and PPM1A siRNAs introducing 3T3-L1 adipocytes were treated with tumor necrosis factor-α (TNF-α) for 24 h and mRNA expression of PPM1A, insulin resistance marker genes (IL6, CCL2, CCL9), and insulin sensitivity marker gene (GLUT4) was measured by RT-qPCR. * p < 0.05; ** p < 0.01; *** p < 0.001 vs. ‘siCtrl/NT’; # p < 0.05; ### p < 0.001 vs. ‘siCtrl/TNF-α’; Error bars indicate SEM.
Figure 7
Figure 7
Negative correlation between PPM1A and the phosphorylation of PPARγ at Ser273 in pathophysiological conditions both in mice and humans. (A) Western blot analysis of PPM1A, PPARγ, and PPARγ phosphorylation at Ser273 in adipose tissue of both normal chow diet (NCD)-fed mice and high-fat diet (HFD)-fed mice for 8 weeks. The expression of PPM1A and the phosphorylation of PPARγ at Ser273 are normalized by HSP90 and total PPARγ, respectively (shown as bar graphs). (B) Relative mRNA expression of PPM1A in adipose tissue in the same mice (n=3). (C) Western blot of PPM1A, PPARγ, and PPARγ phosphorylation at Ser273 in adipose tissue of 10 week-old C57BL6/J and db/db mice. The expression of PPM1A and the phosphorylation of PPARγ at Ser273 are normalized by HSP90 and total PPARγ, respectively (shown as bar graphs). (D) Relative mRNA expression of PPM1A in adipose tissue in the same mice (n = 3). (E) Pearson correlation coefficient between PPM1A and gene set responsive to pSer273 within human subcutaneous adipose tissue is calculated. * p < 0.05; ** p < 0.01; *** p < 0.001; **** p< 0.0001; Error bars indicate SEM.
Figure 8
Figure 8
Schematic model of dephosphorylation of PPARγ at Ser273 by PPM1A. In normal status (insulin sensitive condition), a degree of PPARγ phosphorylation at Ser273 is reduced by the action of PPM1A in adipocytes. Dephosphorylated PPARγ orchestrates the specific target gene expression including insulin-sensitizing adipokines, such as adiponectin and adipsin. In obese status (insulin resistant condition), however, phosphorylation of PPARγ at Ser273 significantly increases because of the lower level of PPM1A expression. Phosphorylated PPARγ dysregulates the diabetic gene programming so that adipocytes change into insulin resistance phenotype.

Similar articles

Cited by

References

    1. Spiegelman B.M., Flier J.S. Adipogenesis and obesity: Rounding out the big picture. Cell. 1996;87:377–389. doi: 10.1016/S0092-8674(00)81359-8. - DOI - PubMed
    1. Kusminski C.M., Bickel P.E., Scherer P.E. Targeting adipose tissue in the treatment of obesity-associated diabetes. Nat. Rev. Drug Discov. 2016;15:639–660. doi: 10.1038/nrd.2016.75. - DOI - PubMed
    1. Van Gaal L.F., Mertens I.L., De Block C.E. Mechanisms linking obesity with cardiovascular disease. Nature. 2006;444:875–880. doi: 10.1038/nature05487. - DOI - PubMed
    1. Clinical Guidelines on the Identification, Evaluation, and Treatment of Overweight and Obesity in Adults--The Evidence Report. National Institutes of Health. Obes. Res. 1998;6 Suppl 2:51S–209S. - PubMed
    1. Kershaw E.E., Flier J.S. Adipose tissue as an endocrine organ. J. Clin. Endocrinol. Metab. 2004;89:2548–2556. doi: 10.1210/jc.2004-0395. - DOI - PubMed

Publication types