. 2020 Apr 1;318(4):L684-L697.
doi: 10.1152/ajplung.00128.2019. Epub 2020 Feb 5.

PDGFRα and αSMA mark two distinct mesenchymal cell populations involved in parenchymal and vascular remodeling in pulmonary fibrosis

Affiliations

PDGFRα and αSMA mark two distinct mesenchymal cell populations involved in parenchymal and vascular remodeling in pulmonary fibrosis

Valentina Biasin et al. Am J Physiol Lung Cell Mol Physiol. .

Abstract

Pulmonary fibrosis is characterized by pronounced collagen deposition and myofibroblast expansion, whose origin and plasticity remain elusive. We utilized a fate-mapping approach to investigate α-smooth muscle actin (αSMA)+ and platelet-derived growth factor receptor α (PDGFRα)+ cells in two lung fibrosis models, complemented by cell type-specific next-generation sequencing and investigations on human lungs. Our data revealed that αSMA+ and PDGFRα+ cells mark two distinct mesenchymal lineages with minimal transdifferentiation potential during lung fibrotic remodeling. Parenchymal and perivascular fibrotic regions were populated predominantly with PDGFRα+ cells expressing collagen, while αSMA+ cells in the parenchyma and vessel wall showed variable expression of collagen and the contractile protein desmin. The distinct gene expression profile found in normal conditions was retained during pathologic remodeling. Cumulatively, our findings identify αSMA+ and PDGFRα+ cells as two separate lineages with distinct gene expression profiles in adult lungs. This cellular heterogeneity suggests that anti-fibrotic therapy should target diverse cell populations.

Keywords: collagen; fibroblasts; fibrosis; myofibroblasts; transdifferentiation.


Conflict of interest statement

No conflicts of interest, financial or otherwise, are declared by the authors.

Figures

Fig. 1.
Fig. 1.
α-Smooth muscle actin (αSMA)- and platelet-derived growth factor receptor-α (PDGFRα)-expressing cells represent two distinct populations of fibroblasts in human idiopathic pulmonary fibrosis (IPF) lungs. A: immunofluorescence staining of human donor and IPF sections for αSMA, PDGFRα, and von Willebrand factor (vWF). Parenchymal and vascular regions are shown. Scale bar: overview 200 µm; single staining and merged 50 µm; zoomed merged 12.5 µm. Arrows: single αSMA-positive cells; arrowheads: single PDGFRα-positive cells; asterisk: double αSMA/PDGFRα-positive cells. Number and percentage of positive cells for single αSMA, single PDGFRα, and double αSMA/PDGFRα-positive cells in the parenchyma (B) and in the vasculature (C). Cell counts were performed on 3–5 images for each donor and IPF section from n = 6–8 different donors and IPF lungs. P < 0.05 was considered significant. #Differences between single PDGFRα-positive cells in IPF compared with donor lungs. D: t-distributed stochastic neighbor embedding (tSNE) plots showing expression of ACTA2 and PDGFRA expression on the fibroblasts cluster. Data from Reyfman et al. data set (GSE122960) (25).
Fig. 2.
Fig. 2.
Both α-smooth muscle actin (αSMA)- and platelet-derived growth factor receptor-α (PDGFRα)-expressing cells contribute to collagen production, but desmin (DES) is expressed mostly by αSMA-expressing cells in human idiopathic pulmonary fibrosis (IPF) lungs. A: multicolor immunofluorescence staining of human donor and IPF sections for αSMA, PDGFRα, and collagen 1 (COL1). Parenchymal and vascular regions are shown. Scale bar: merged 50 µm; zoomed 12.5 µm. Arrows: single αSMA-positive cells; arrowheads: single PDGFRα-positive cells; asterisk: double αSMA/COL1 or PDGFRα/COL1-positive cells. Number and percentage of single αSMA, single PDGFRα, double αSMA /COL1, and double PDGFRα /COL1-positive cells in the parenchyma (B) and in the vasculature (C). Cell count was performed on 3–6 images for each donor and IPF section from n = 3–4 different donors and IPF lungs. P value < 0.05 was considered significant. $Differences between double PDGFRα/COL1-positive cells in IPF compared with donor lungs. D: multicolor immunofluorescence staining of human donor and IPF sections for αSMA, PDGFRα, and DES. Parenchymal and vascular region are shown. Scale bar: merged 50 µm; zoomed merged 12.5 µm. Arrows: single αSMA-positive cells; arrowheads: single PDGFRα-positive cells; asterisk: double αSMA/DES or PDGFRα/DES-positive cells. Number and percentage of single αSMA, single PDGFRα, double αSMA/DES, and double PDGFRα/DES-positive cells in the parenchyma (E) and in the vasculature (F). Cell count was performed in 3–6 images for each donor and IPF section from n = 2–3 different donors and IPF. P value < 0.05 was considered significant. #Differences between single PDGFRα-positive cells in IPF compared with donor lungs.
Fig. 3.
Fig. 3.
Lineage-traced α-smooth muscle actin (αSMA)-expressing cells contribute to parenchymal and vascular remodeling in bleomycin model. A: lineage tracing of αSMA-positive cells (Acta2-tdT) and immunofluorescence staining for platelet-derived growth factor receptor-α (PDGFRα) and von Willebrand factor (vWF) was performed in saline- and bleomycin-treated mice. Parenchymal and vascular regions are shown. Scale bar: overview 200 µm; single staining and merged 50 µm; zoomed merged 12.5 µm. Arrows: single Acta-tdT-positive cells; arrowheads: single PDGFRα-positive cells; asterisk: double Acta-tdT/PDGFRα-positive cells. Number and percentage of Acta2-tdT and PDGFRα-positive cells in the parenchyma (B) and in the vasculature (C). Cell count was performed in 3–8 images for each mouse section from n = 3–4 different saline- and bleomycin-treated mice. P value < 0.05 was considered significant. #Differences between single PDGFRα-positive cells; *Differences between single Acta2-tdT positive cells in bleomycin- compared with saline-treated mice.
Fig. 4.
Fig. 4.
Lineage-traced α-smooth muscle actin (αSMA)-expressing cells contribute to parenchymal and vascular remodeling in Fra-2 Tg mice. A: lineage tracing of αSMA-positive cells (Acta2-tdT) and immunofluorescence staining for platelet-derived growth factor receptor-α (PDGFRα) and von Willebrand factor (vWF) was performed in wild-type (wt) littermates and Fra-2 tg mice. Parenchymal and vascular regions are shown. Scale bar: overview 200 µm; single staining and merged 50 µm; zoomed merged 12.5 µm. Arrows: single Acta2-tdT-positive cells; arrowheads: single PDGFRα-positive cells; asterisk: double Acta2-tdT /PDGFRα-positive cells. Number and percentage of single Acta2-tdT, single PDGFRα and Acta2-tdT/PDGFRα double positive cells in the parenchyma (B) and in the vasculature (C). Cell count was performed in 4–9 images for each mouse section from n = 3–5 different wt littermate controls and Fra-2 Tg mice. P value < 0.05 was considered significant. #Differences between single PDGFRα-positive cells in Fra-2 Tg mice compared with wt littermates.
Fig. 5.
Fig. 5.
Lineage-traced platelet-derived growth factor receptor-α (PDGFRα)-positive cells strongly contribute to parenchymal remodeling in bleomycin model. A: lineage tracing of PDGFRα-positive cells (Pdgfra-tdT) and immunofluorescence staining for α-smooth muscle actin (αSMA) and von Willebrand factor (vWF) was performed in saline- and bleomycin-treated mice. Parenchymal and vascular regions are shown. Scale bar: overview 200 µm; single staining and merged 50 µm; zoomed merged 12.5 µm. Arrows: single αSMA-positive cells; arrowheads: single Pdgfra-tdT-positive cells; asterisk: double αSMA/ Pdgfra-tdT-positive cells. Number and percentage of single αSMA, single Pdgfra-tdT, and αSMA/Pdgfra-tdT double positive cells in the parenchyma (B) and in the vasculature (C). Cell count was performed in 6–10 images for each mouse section from n = 3–5 different saline- and bleomycin-treated mice. P value < 0.05 was considered significant.
Fig. 6.
Fig. 6.
Lineage-traced platelet-derived growth factor receptor-α (PDGFRα)-positive cells partially contribute to parenchymal remodeling in Fra-2 Tg mice. Lineage tracing of PDGFRα-positive cells (Pdgfra-tdT) and immunofluorescence staining for α-smooth muscle actin (αSMA) and von Willebrand factor (vWF) was performed in wild-type (wt) littermates and Fra-2 Tg mice A: parenchymal and vascular regions are shown. Scale bar: overview 200 µm; single staining and merged 50 µm; zoomed merged 12.5 µm. Arrows: single αSMA-positive cells; arrowheads: single Pdgfra-tdT-positive cells; asterisk: double αSMA/Pdgfra-tdT-positive cells. Number and percentage of single αSMA, single Pdgfra-tdT, and αSMA/Pdgfra-tdT double positive cells in the parenchyma (B) and in the vasculature (C). Cell count was performed in 6–10 images for each mouse section from n = 4 different littermate controls and Fra-2 Tg mice. P value < 0.05 was considered significant. #Differences between single Pdgfra-tdT-positive cells; *differences between single αSMA-positive cells in Fra-2 Tg mice compared with wt littermates.
Fig. 7.
Fig. 7.
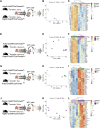
α-Smooth muscle actin (αSMA)- and platelet-derived growth factor receptor-α (PDGFRα)-expressing cells present a distinct gene expression. A, D, G, J: schematic representation of the applied workflow for RNA sequencing. B, E, H, K: principal component analysis (PCA) of the normalized RNA-Seq data transcripts of the reported groups. C, F, I, L: heatmap of hierarchical clustering showing the top 30 differentially expressed protein-coding genes between the reported groups.
Fig. 8.
Fig. 8.
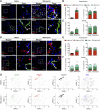
A fraction of both α-smooth muscle actin (αSMA) and platelet-derived growth factor receptor-α (PDGFRα)-positive cells express collagen 1 (COL1), while desmin (DES) is expressed mostly by αSMA-expressing cells in bleomycin. A: lineage tracing of PDGFRα-positive cells (Pdgfra-tdT) and immunofluorescence staining for αSMA and COL1 in saline- and bleomycin-treated mice. Parenchymal and vascular regions are shown. Scale bar: single staining and merged 50 µm; zoomed merged 12.5 µm. Arrows: single αSMA-positive cells; arrowheads: single Pdgfra-tdT-positive cells; asterisk: double αSMA/COL1 or Pdgfra-tdT/COL1-positive cells. Number and percentage of single αSMA, single Pdgfra-tdT, αSMA/COL1 and Pdgfra-tdT /COL1 double positive cells in the parenchyma (B) and in the vasculature (C). P value < 0.05 was considered significant. #Differences between single Pdgfra-tdT positive cells in bleomycin compared with saline. D: lineage tracing of PDGFRα-positive cells (Pdgfra-tdT) and immunofluorescence staining for αSMA and DES in saline- and bleomycin-treated mice. Parenchymal and vascular region are shown. Scale bar: merged 50 µm; zoomed merged 12.5 µm. Arrows: single αSMA-positive cells; arrowheads: single PDGFRα-positive cells; asterisk: double αSMA/DES or PDGFRα/DES-positive cells. Number and percentage of αSMA, Pdgfra-tdT, αSMA/DES, and Pdgfra-tdT /DES double positive cells in the parenchyma (E) and in the vasculature (F). P value < 0.05 was considered significant. #Differences between single Pdgfra-tdT-positive cells; *differences between single αSMA-positive cells in bleomycin compared with saline treatment. G: t-distributed stochastic neighbor embedding (tSNE) plots showing expression of Acta2, Pdgfra, Col1a1, and Des on the fibroblasts cluster upon saline and bleomycin treatment. Data from the Peyser et al. data set (GSE129605) (23).
Fig. 9.
Fig. 9.
A fraction of both α-smooth muscle actin (αSMA)- and platelet-derived growth factor receptor-α (PDGFRα)-positive cells express collagen 1 (COL1), while desmin (DES) is expressed mostly by αSMA-expressing cells in Fra-2 Tg mice. A: lineage tracing of PDGFRα-positive cells (Pdgfra-tdT) and immunofluorescence staining for αSMA and COL1 in wild-type (wt) littermates and Fra-2 Tg mice. Parenchymal and vascular regions are shown. Scale bar: merged 50 µm; zoomed merged 12.5 µm. Arrows: single αSMA-positive cells; arrowheads: single PDGFRα-positive cells; asterisk: double αSMA/COL1 or PDGFRα/COL1-positive cells. Number and percentage of single αSMA, single Pdgfra-tdT, αSMA/COL1, and Pdgfra-tdT/COL1 double positive cells in the parenchyma (B) and in the vasculature (C). P value < 0.05 was considered significant. *Differences between single αSMA-positive cells in Fra-2 Tg mice compared with wt littermates. Cell count was performed in 3–5 images for mouse section from n = 2–3 different littermate controls and Fra-2 Tg mice. D: lineage tracing of PDGFRα cells (Pdgfra-tdT) and immunofluorescence staining for αSMA and DES in wt littermates and Fra-2 Tg mice. Parenchymal and vascular regions are shown. Scale bar: merged 50 µm; zoomed merged 12.5 µm. Arrows: single αSMA-positive cells; arrowheads: single Pdgfra-tdT-positive cells; asterisk: double αSMA/DES or Pdgfra-tdT/DES-positive cells. Number and percentage of αSMA, Pdgfra-tdT single positive, αSMA/DES, and Pdgfra-tdT/DES double positive cells in the parenchyma (E) and in the vasculature (F). P value < 0.05 was considered significant. #Differences between single Pdgfra-tdT-positive cells; *differences between single αSMA-positive cells; $difference between double αSMA/DES-positive cells in Fra-2 Tg mice compared with wt littermates. Cell count was performed in 3–6 images for mouse section. n = 3–4 different littermate controls and Fra-2 Tg mice.

Similar articles

Cited by

References

    1. Benayoun BA, Pollina EA, Singh PP, Mahmoudi S, Harel I, Casey KM, Dulken BW, Kundaje A, Brunet A. Remodeling of epigenome and transcriptome landscapes with aging in mice reveals widespread induction of inflammatory responses. Genome Res 29: 697–709, 2019. doi:10.1101/gr.240093.118. - DOI - PMC - PubMed
    1. Biasin V, Marsh LM, Egemnazarov B, Wilhelm J, Ghanim B, Klepetko W, Wygrecka M, Olschewski H, Eferl R, Olschewski A, Kwapiszewska G. Meprin β, a novel mediator of vascular remodelling underlying pulmonary hypertension. J Pathol 233: 7–17, 2014. doi:10.1002/path.4303. - DOI - PubMed
    1. Biasin V, Wygrecka M, Marsh LM, Becker-Pauly C, Brcic L, Ghanim B, Klepetko W, Olschewski A, Kwapiszewska G. Meprin β contributes to collagen deposition in lung fibrosis. Sci Rep 7: 39969, 2017. doi:10.1038/srep39969. - DOI - PMC - PubMed
    1. Birnhuber A, Biasin V, Schnoegl D, Marsh LM, Kwapiszewska G. Transcription factor Fra-2 and its emerging role in matrix deposition, proliferation and inflammation in chronic lung diseases. Cell Signal 64: 109408, 2019. doi:10.1016/j.cellsig.2019.109408. - DOI - PubMed
    1. Birnhuber A, Crnkovic S, Biasin V, Marsh LM, Odler B, Sahu-Osen A, Stacher-Priehse E, Brcic L, Schneider F, Cikes N, Ghanim B, Klepetko W, Graninger W, Allanore Y, Eferl R, Olschewski A, Olschewski H, Kwapiszewska G. IL-1 receptor blockade skews inflammation towards Th2 in a mouse model of systemic sclerosis. Eur Respir J 54: 1900154, 2019. doi:10.1183/13993003.00154-2019. - DOI - PMC - PubMed

Publication types

Substances