

Inferring quantity and qualities of superimposed reaction rates from single molecule survival time distributions
- PMID: 32019978
- PMCID: PMC7000831
- DOI: 10.1038/s41598-020-58634-y
Inferring quantity and qualities of superimposed reaction rates from single molecule survival time distributions
Abstract
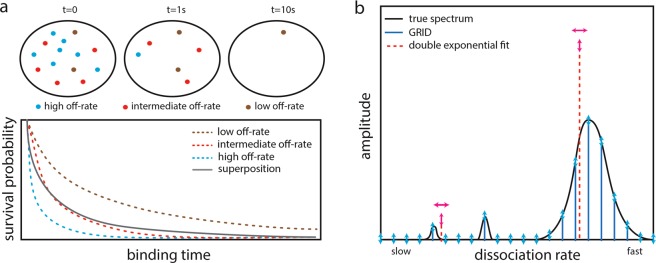
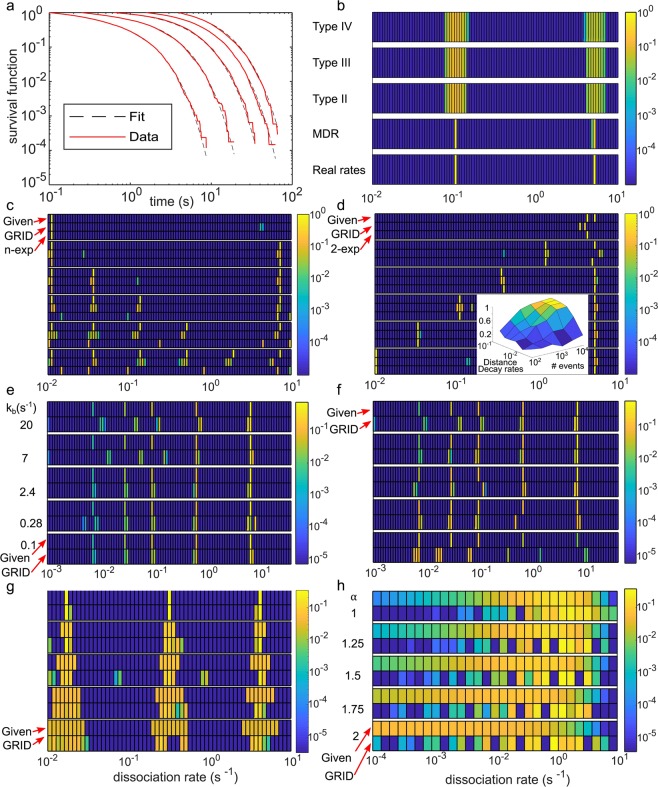
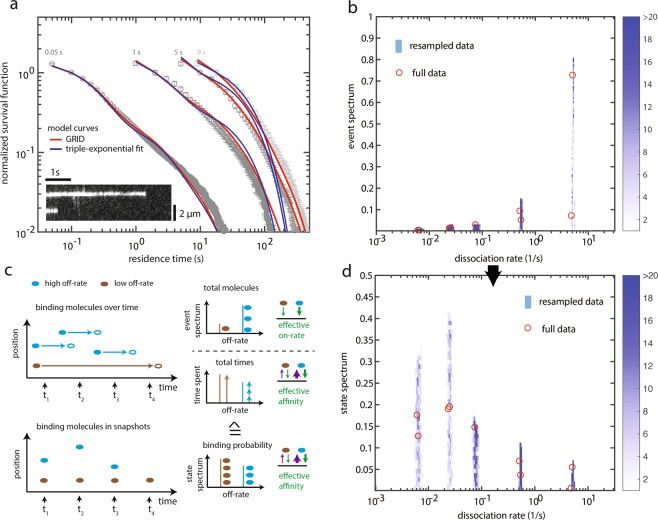
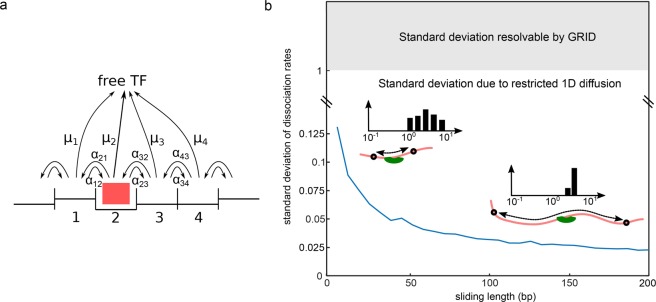
Actions of molecular species, for example binding of transcription factors to chromatin, may comprise several superimposed reaction pathways. The number and the rate constants of such superimposed reactions can in principle be resolved by inverse Laplace transformation of the corresponding distribution of reaction lifetimes. However, current approaches to solve this transformation are challenged by photobleaching-prone fluorescence measurements of lifetime distributions. Here, we present a genuine rate identification method (GRID), which infers the quantity, rates and amplitudes of dissociation processes from fluorescence lifetime distributions using a dense grid of possible decay rates. In contrast to common multi-exponential analysis of lifetime distributions, GRID is able to distinguish between broad and narrow clusters of decay rates. We validate GRID by simulations and apply it to CDX2-chromatin interactions measured by live cell single molecule fluorescence microscopy. GRID reveals well-separated narrow decay rate clusters of CDX2, in part overlooked by multi-exponential analysis. We discuss the amplitudes of the decay rate spectrum in terms of frequency of observed events and occupation probability of reaction states. We further demonstrate that a narrow decay rate cluster is compatible with a common model of TF sliding on DNA.
Conflict of interest statement
The authors declare no competing interests.
Figures
Similar articles
-
Resolvability of fluorescence lifetime distributions using phase fluorometry.Biophys J. 1987 Apr;51(4):587-96. doi: 10.1016/S0006-3495(87)83383-0. Biophys J. 1987. PMID: 3580485 Free PMC article.
-
Analysis of fluorescence decay kinetics measured in the frequency domain using distributions of decay times.Biophys Chem. 1987 Oct;28(1):35-50. doi: 10.1016/0301-4622(87)80073-x. Biophys Chem. 1987. PMID: 3689869 Free PMC article.
-
Application of the stretched exponential function to fluorescence lifetime imaging.Biophys J. 2001 Sep;81(3):1265-74. doi: 10.1016/S0006-3495(01)75784-0. Biophys J. 2001. PMID: 11509343 Free PMC article.
-
Fluorescence proteins, live-cell imaging, and mechanobiology: seeing is believing.Annu Rev Biomed Eng. 2008;10:1-38. doi: 10.1146/annurev.bioeng.010308.161731. Annu Rev Biomed Eng. 2008. PMID: 18647110 Review.
-
Applications of fluorescence lifetime spectroscopy and imaging to lipid domains in vivo.Methods Enzymol. 2012;504:57-81. doi: 10.1016/B978-0-12-391857-4.00003-3. Methods Enzymol. 2012. PMID: 22264529 Review.
Cited by
-
Single-molecule imaging of SWI/SNF chromatin remodelers reveals bromodomain-mediated and cancer-mutants-specific landscape of multi-modal DNA-binding dynamics.Nat Commun. 2024 Sep 2;15(1):7646. doi: 10.1038/s41467-024-52040-y. Nat Commun. 2024. PMID: 39223123 Free PMC article.
-
Altering transcription factor binding reveals comprehensive transcriptional kinetics of a basic gene.Nucleic Acids Res. 2021 Jun 21;49(11):6249-6266. doi: 10.1093/nar/gkab443. Nucleic Acids Res. 2021. PMID: 34060631 Free PMC article.
-
The needle and the haystack: single molecule tracking to probe the transcription factor search in eukaryotes.Biochem Soc Trans. 2021 Jun 30;49(3):1121-1132. doi: 10.1042/BST20200709. Biochem Soc Trans. 2021. PMID: 34003257 Free PMC article. Review.
-
Bromodomains regulate dynamic targeting of the PBAF chromatin-remodeling complex to chromatin hubs.Biophys J. 2022 May 3;121(9):1738-1752. doi: 10.1016/j.bpj.2022.03.027. Epub 2022 Mar 30. Biophys J. 2022. PMID: 35364106 Free PMC article.
-
Towards a 'Spot On' Understanding of Transcription in the Nucleus.J Mol Biol. 2021 Jul 9;433(14):167016. doi: 10.1016/j.jmb.2021.167016. Epub 2021 May 2. J Mol Biol. 2021. PMID: 33951451 Free PMC article. Review.
References
-
- Craig I, Thompson A, Thompson WJ. Practical numerical algorithms why laplace transforms are difficult to invert numerically. Computers in Physics. 1994;8:648–653.
-
- McWhirter J, Pike ER. On the numerical inversion of the Laplace transform and similar Fredholm integral equations of the first kind. Journal of Physics A: Mathematical and General. 1978;11:1729–1745. doi: 10.1088/0305-4470/11/9/007. - DOI
-
- Barone P, Ramponi A, Sebastiani G. On the numerical inversion of the Laplace transform for nuclear magnetic resonance relaxometry. Inverse Problems. 2001;17:77–94. doi: 10.1088/0266-5611/17/1/307. - DOI
Publication types
MeSH terms
Substances
LinkOut - more resources
Full Text Sources
Other Literature Sources
Miscellaneous
