CLEC14A deficiency exacerbates neuronal loss by increasing blood-brain barrier permeability and inflammation
- PMID: 32019570
- PMCID: PMC7001304
- DOI: 10.1186/s12974-020-1727-6
CLEC14A deficiency exacerbates neuronal loss by increasing blood-brain barrier permeability and inflammation
Abstract
Background: Ischemic stroke is a main cause of mortality. Blood-brain barrier (BBB) breakdown appears to play a critical role in inflammation in patients with ischemic stroke and acceleration of brain injury. The BBB has a protective function and is composed of endothelial cells, pericytes, and astrocytes. In ischemic stroke treatments, regulation of vascular endothelial growth factor (VEGF)-A and vascular endothelial growth factor receptor (VEGFR)-2 is a crucial target despite adverse effects. Our previous study found that loss of C-type lectin family 14 member A (CLEC14A) activated VEGF-A/VEGFR-2 signaling in developmental and tumoral angiogenesis. Here, we evaluate the effects of BBB impairment caused by CLEC14A deficiency in ischemia-reperfusion injury.
Methods: In vitro fluorescein isothiocyanate (FITC)-dextran permeability, transendothelial electrical resistance (TEER) assay, and immunostaining were used to evaluate endothelial integrity. BBB permeability was assessed using Evans blue dye and FITC-dextran injection in Clec14a-/- (CLEC14A-KO) mice and wild-type mice. Middle cerebral artery occlusion surgery and behavioral assessments were performed to evaluate the neurologic damage. The change of tight junctional proteins, adhesion molecules, pro-inflammatory cytokines, and microglial were confirmed by immunofluorescence staining, Western blotting, and quantitative reverse transcription polymerase chain reaction of brain samples.
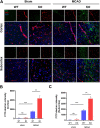
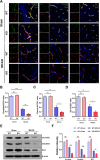
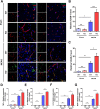
Results: In endothelial cells, knockdown of CLEC14A increased FITC-dextran permeability and decreased transendothelial electrical resistance; the severity of this effect increased with VEGF treatment. Immunofluorescence staining revealed that tight junctional proteins were attenuated in the CLEC14A knockdown endothelial cells. Consistent with the in vitro results, CLEC14A-KO mice that were injected with Evans blue dye had cerebral vascular leakage at postnatal day 8; wild-type mice had no leakage. We used a middle cerebral artery occlusion model and found that CLEC14A-KO mice had severe infarcted brain and neurological deficits with upregulated VEGFR-2 expression. FITC-dextran leakage was present in CLEC14A-KO mice after ischemia-reperfusion, and the numbers of tight junctional molecules were significantly decreased. Loss of CLEC14A increased the pro-inflammatory response through adhesion molecule expression, and glial cells were activated.
Conclusions: These results suggest that activation of VEGFR-2 in CLEC14A-KO mice aggravates ischemic stroke by exacerbating cerebral vascular leakage and increasing neuronal inflammation after ischemia-reperfusion injury.
Keywords: Blood-brain barrier (BBB); C-type lectin family 14 member A (CLEC14A); Ischemic stroke; Vascular endothelial growth factor (VEGF); Vascular endothelial growth factor receptor-2 (VEGFR-2).
Conflict of interest statement
The authors declare that they have no competing interests.
Figures


Similar articles
-
Endothelial Conditional Knockdown of NMMHC IIA (Nonmuscle Myosin Heavy Chain IIA) Attenuates Blood-Brain Barrier Damage During Ischemia-Reperfusion Injury.Stroke. 2021 Mar;52(3):1053-1064. doi: 10.1161/STROKEAHA.120.031410. Epub 2021 Feb 16. Stroke. 2021. PMID: 33588591
-
The protective effects of Axitinib on blood-brain barrier dysfunction and ischemia-reperfusion injury in acute ischemic stroke.Exp Neurol. 2024 Sep;379:114870. doi: 10.1016/j.expneurol.2024.114870. Epub 2024 Jun 17. Exp Neurol. 2024. PMID: 38897539
-
AIM2 deletion enhances blood-brain barrier integrity in experimental ischemic stroke.CNS Neurosci Ther. 2021 Oct;27(10):1224-1237. doi: 10.1111/cns.13699. Epub 2021 Jun 22. CNS Neurosci Ther. 2021. PMID: 34156153 Free PMC article.
-
Neuroinflammatory mechanisms of blood-brain barrier damage in ischemic stroke.Am J Physiol Cell Physiol. 2019 Feb 1;316(2):C135-C153. doi: 10.1152/ajpcell.00136.2018. Epub 2018 Oct 31. Am J Physiol Cell Physiol. 2019. PMID: 30379577 Free PMC article. Review.
-
Modulation of vascular integrity and neuroinflammation by peroxiredoxin 4 following cerebral ischemia-reperfusion injury.Microvasc Res. 2021 May;135:104144. doi: 10.1016/j.mvr.2021.104144. Epub 2021 Jan 28. Microvasc Res. 2021. PMID: 33515567 Review.
Cited by
-
LPA2 Alleviates Septic Acute Lung Injury via Protective Endothelial Barrier Function Through Activation of PLC-PKC-FAK.J Inflamm Res. 2023 Nov 8;16:5095-5109. doi: 10.2147/JIR.S419578. eCollection 2023. J Inflamm Res. 2023. PMID: 38026263 Free PMC article.
-
Neurovascular Unit: A critical role in ischemic stroke.CNS Neurosci Ther. 2021 Jan;27(1):7-16. doi: 10.1111/cns.13561. Epub 2021 Jan 2. CNS Neurosci Ther. 2021. PMID: 33389780 Free PMC article. Review.
-
Angiogenesis after ischemic stroke.Acta Pharmacol Sin. 2023 Jul;44(7):1305-1321. doi: 10.1038/s41401-023-01061-2. Epub 2023 Feb 24. Acta Pharmacol Sin. 2023. PMID: 36829053 Free PMC article. Review.
-
METTL3 Mediates Microglial Activation and Blood-Brain Barrier Permeability in Cerebral Ischemic Stroke by Regulating NLRP3 Inflammasomes Through m6A Methylation Modification.Neurotox Res. 2024 Feb 13;42(1):15. doi: 10.1007/s12640-024-00687-2. Neurotox Res. 2024. PMID: 38349604
-
Liposomal nanocarriers of preassembled glycocalyx restore normal venular permeability and shear stress sensitivity in sepsis: assessed quantitatively with a novel microchamber system.Am J Physiol Heart Circ Physiol. 2024 Aug 1;327(2):H390-H398. doi: 10.1152/ajpheart.00138.2024. Epub 2024 Jun 14. Am J Physiol Heart Circ Physiol. 2024. PMID: 38874615
References
-
- Kwiatkowski TG, et al. Effects of tissue plasminogen activator for acute ischemic stroke at one year. National Institute of Neurological Disorders and Stroke Recombinant Tissue Plasminogen Activator Stroke Study Group. N Engl J Med. 1999;340(23):1781–1787. doi: 10.1056/NEJM199906103402302. - DOI - PubMed
MeSH terms
Substances
Grants and funding
LinkOut - more resources
Full Text Sources
Molecular Biology Databases
Research Materials

