. 2020 Mar 19;77(6):1322-1339.e11.
doi: 10.1016/j.molcel.2020.01.008. Epub 2020 Jan 31.

Localized Inhibition of Protein Phosphatase 1 by NUAK1 Promotes Spliceosome Activity and Reveals a MYC-Sensitive Feedback Control of Transcription

Affiliations

Localized Inhibition of Protein Phosphatase 1 by NUAK1 Promotes Spliceosome Activity and Reveals a MYC-Sensitive Feedback Control of Transcription

Giacomo Cossa et al. Mol Cell. .

Erratum in

Abstract

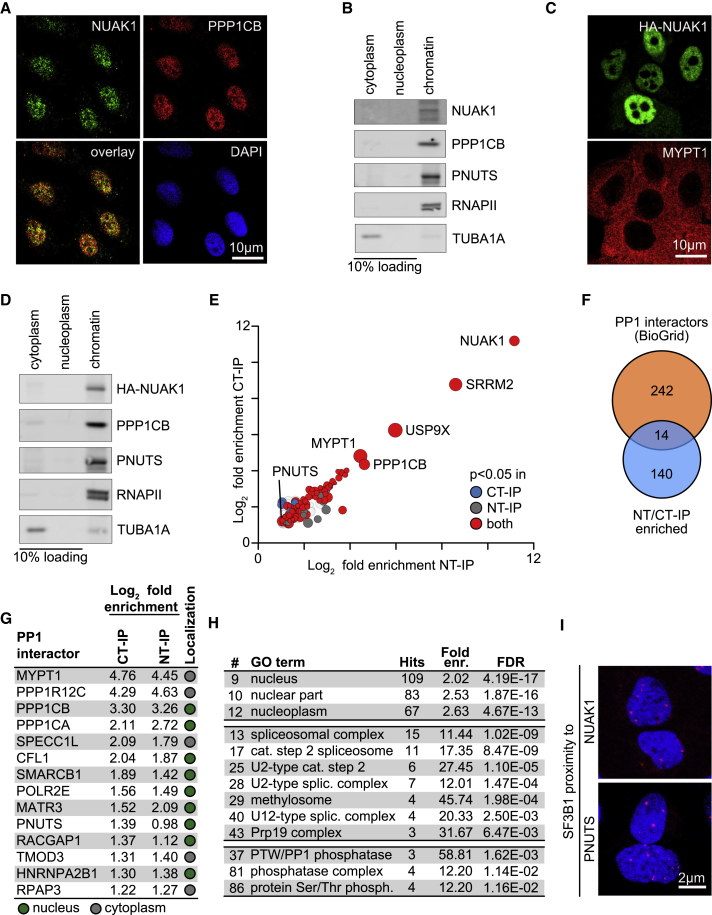
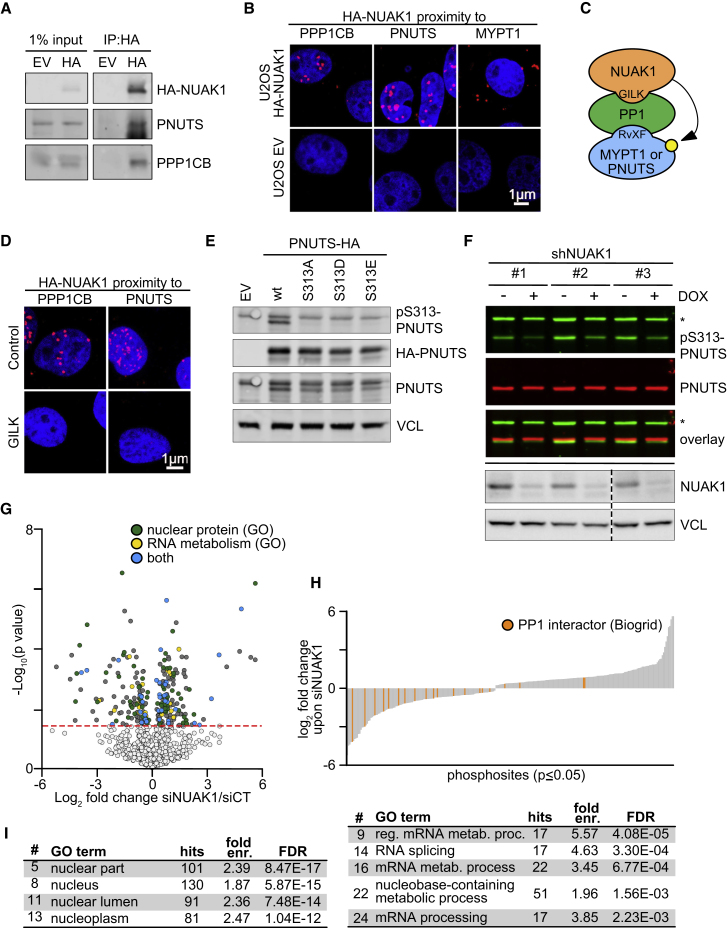
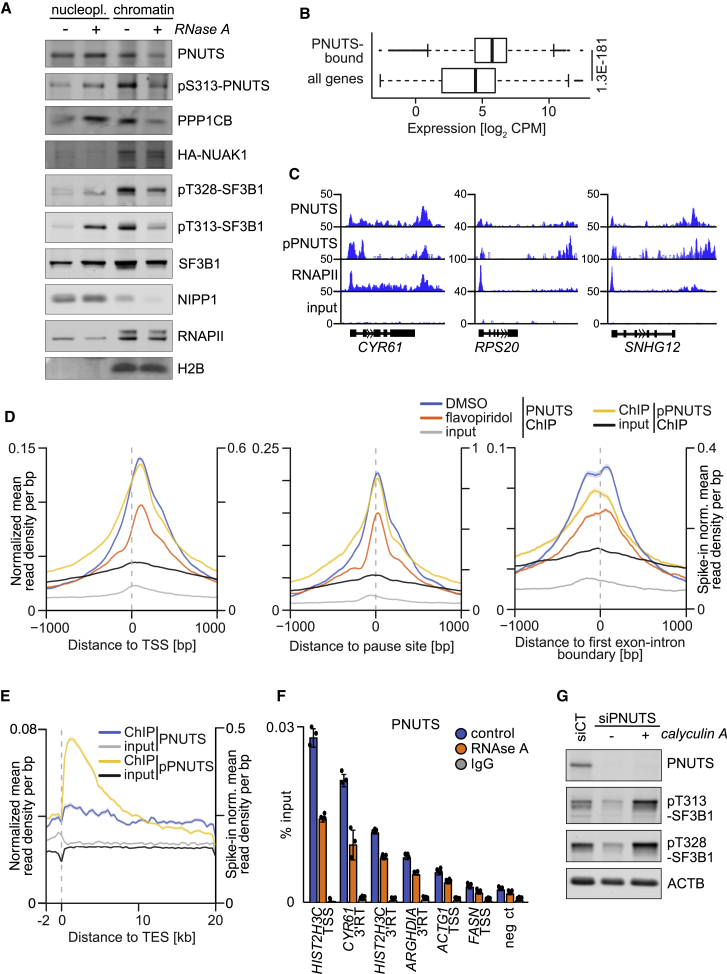
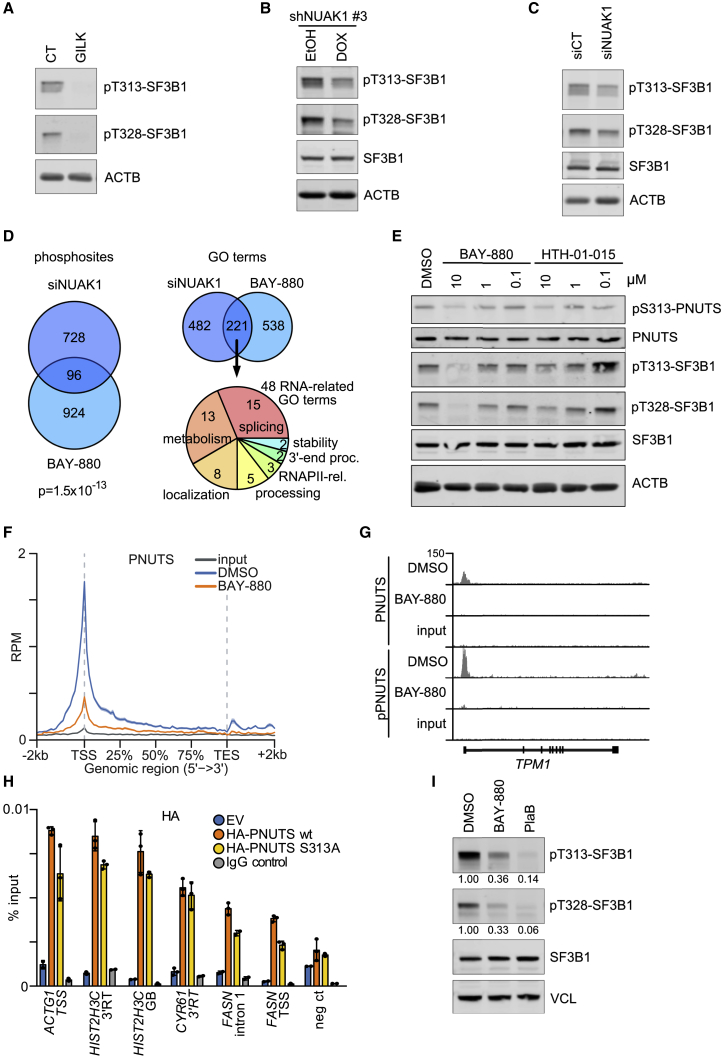
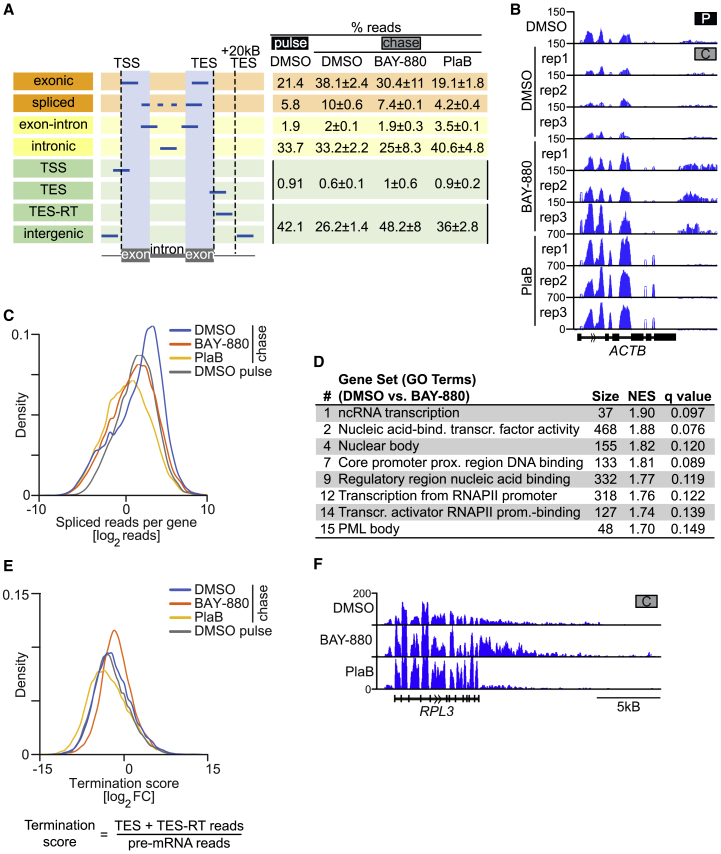
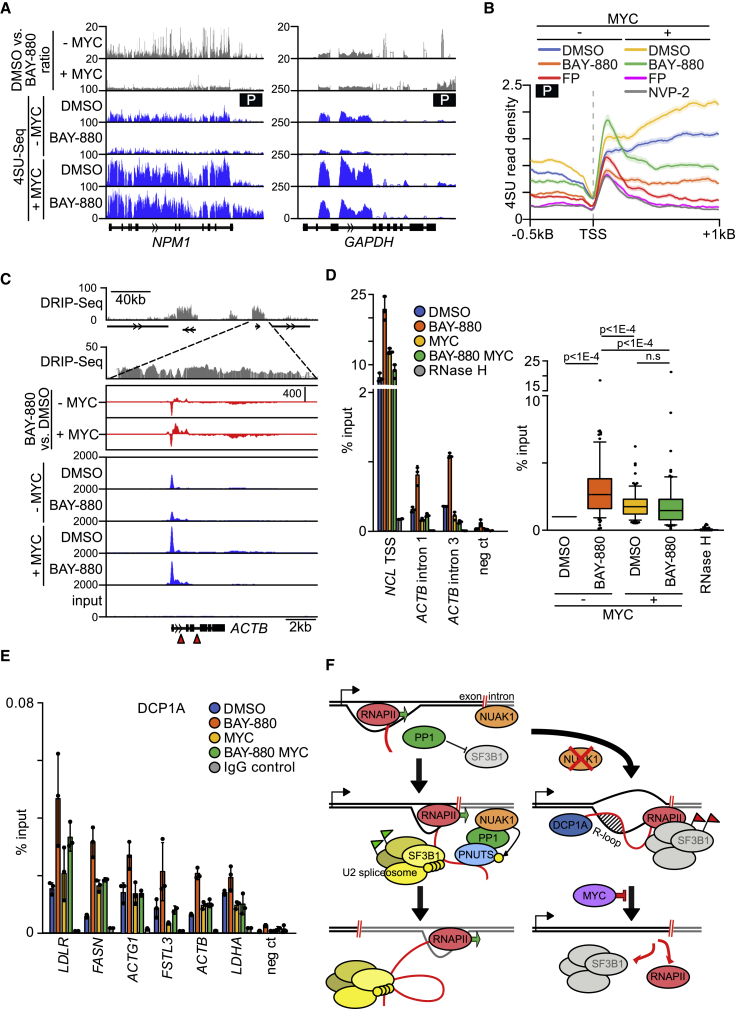
Deregulated expression of MYC induces a dependence on the NUAK1 kinase, but the molecular mechanisms underlying this dependence have not been fully clarified. Here, we show that NUAK1 is a predominantly nuclear protein that associates with a network of nuclear protein phosphatase 1 (PP1) interactors and that PNUTS, a nuclear regulatory subunit of PP1, is phosphorylated by NUAK1. Both NUAK1 and PNUTS associate with the splicing machinery. Inhibition of NUAK1 abolishes chromatin association of PNUTS, reduces spliceosome activity, and suppresses nascent RNA synthesis. Activation of MYC does not bypass the requirement for NUAK1 for spliceosome activity but significantly attenuates transcription inhibition. Consequently, NUAK1 inhibition in MYC-transformed cells induces global accumulation of RNAPII both at the pause site and at the first exon-intron boundary but does not increase mRNA synthesis. We suggest that NUAK1 inhibition in the presence of deregulated MYC traps non-productive RNAPII because of the absence of correctly assembled spliceosomes.

Keywords: ARK5; MYC; NUAK1; PNUTS; PP1; Protein Phosphatase 1; Spliceosome.


Conflict of interest statement

Declaration of Interests L.W., F.P., and D.M. are employees and shareholders of Bayer AG. The other authors declare no competing interests.

Figures

None
Graphical abstract
Figure 1
Figure 1
NUAK1 Binds to Chromatin and Interacts with a Nuclear PP1 Network (A) U2OS cells stained for endogenous NUAK1 and PPP1CB. DAPI is used as nuclear counterstain (n = 3; in all legends, n indicates the number of independent biological replicates). (B) Immunoblot of fractionation of U2OS cells probed with the indicated antibodies. Ten percent of cytoplasm and nucleoplasm fractions were loaded. RNAPII (chromatin) and TUBA1A (cytoplasm) were used as localization controls (n = 3). (C) Immunofluorescence of U2OS cells stably expressing HA-tagged NUAK1 stained with α-HA and α-MYPT1 antibodies (n = 3). (D) Cell fractionation of U2OS cells stably expressing HA-tagged NUAK1. Ten percent of cytoplasm and nucleoplasm fractions were loaded. RNAPII and TUBA1A were used as controls (n = 3). (E) Mass spectrometry (MS) analysis of FLAG-NUAK1 co-immunoprecipitates (IP) from U2OS cells expressing amino-(NT-IP)- or carboxy-(CT-IP)-terminally-FLAG-tagged NUAK1. Proteins are sorted according to log2 fold enrichment over IP performed in U2OS cells expressing empty vector (EV). Dot size is according to number of peptides identified by MS (n = 2). (F) Venn diagram of NUAK1 interactors and previously documented PP1 interaction partners (BioGrid database). (G) List of the 14 PP1 interactors from (F). Nuclear (green) or cytoplasmic (gray) localization is shown. (H) List of selected GO terms enriched by analyzing proteins enriched in both NT- and CT-IP (n = 154). Terms referring to nuclear protein, splicing factors, or PP1 interactors are shown. FDR, false discovery rate; fold enr., fold enrichment. (I) Proximity ligation assay (PLA) in U2OS cells documenting proximity of SF3B1 and NUAK1 or PNUTS. Red dots indicate proximity of the indicated proteins. DAPI is used as nuclear counterstain. See also Figure S1.
Figure 2
Figure 2
PNUTS Interacts with and Is Phosphorylated by NUAK1 in the Nucleus (A) Immunoblot of α-HA immunoprecipitates of U2OS cells expressing HA-tagged NUAK1 or empty vector (EV). Input corresponds to 1% lysate (n = 3). (B) Proximity ligation assay (PLA) performed in U2OS cells expressing HA-tagged NUAK1 or EV (used as negative control). Red dots indicate proximity of the indicated proteins. DAPI is used as nuclear counterstain (n = 3). (C) Cartoon depicting the mode of interaction of NUAK1 with MYPT1 and the suggested mode of interaction with PNUTS. Binding motifs of NUAK1 (GILK) and MYPT1/PNUTS (RVxF) to PP1 are also depicted. Yellow circle, phosphorylation. (D) PLA performed in U2OS cells expressing HA-tagged NUAK1 or EV (used as negative control). Cells were treated for 3 h with 50 μM GILK or control peptide. Red dots indicate proximity of the indicated proteins. DAPI is used as nuclear counterstain (n = 3). (E) Immunoblot using the indicated antibodies of U2OS cells transfected with pcDNA3 vectors encoding HA-tagged rat wild-type or S313A/D/E-mutated PNUTS; EV was used as negative control. In the α-pS313-PNUTS panel, the upper band represents endogenous PNUTS, while the lower is the exogenous rat protein. VCL was used as loading control (n = 3). (F) U2OS cells were infected with three independent doxycycline (DOX)-inducible shRNAs targeting NUAK1 and, where indicated, treated with DOX (1 μg/mL) for 24 h. Asterisk denotes unspecific band (n = 3). Bottom: immunoblot of NUAK1 confirming its depletion. VCL was used as loading control (n = 3). (G) Volcano plot showing differentially regulated phosphosites and the functional annotation of respective proteins in a spike-in SILAC phosphoproteomic analysis upon transfection of a siRNA pool targeting NUAK1 mRNA (siNUAK1). Significance is indicated by the dashed line (p < 0.05) (n = 3). (H) Waterfall plot showing differentially spike-in SILAC-labeled phosphorylated residues (p < 0.05) upon NUAK1 depletion. Orange, phosphosites of PP1-interacting proteins (n = 3). (I) Differentially phosphorylated residues upon NUAK1 depletion (n = 197, p < 0.05) were used as input for a GO term analysis (left: cell component; right: biological function). FDR, false discovery rate; fold enr., fold enrichment. See also Figure S2.
Figure 3
Figure 3
PNUTS Binds Chromatin via RNA and Promotes Spliceosome Activity (A) Immunoblot documenting chromatin association of the indicated proteins in control cell lysates and in lysates upon RNase A treatment. Cell fractionation was performed on U2OS cells expressing HA-tagged NUAK1. Nucleopl., nucleoplasmic fraction; chromatin, chromatin-bound fraction. SF3B1 and NIPP1 or phosphorylated RNAPII and H2B were used as RNA- and chromatin-bound controls, respectively (n = 3). (B) Expression of PNUTS-bound genes (n = 2,786) versus all expressed genes (n = 19,382). The p value was calculated with a two-tailed Wilcoxon rank-sum test. CPM, counts per million. (C) Genome Browser tracks showing PNUTS, phospho-S313-PNUTS (pPNUTS), and RNAPII binding to representative genes. Input tracks are included as control. (D) Average density plots of PNUTS ChIP-seq (left y axis) and pPNUTS ChIP-RX (right y axis). The shadow around tracks indicates SEM. TSS, transcription start site. (E) Average density plots of PNUTS ChIP-seq (left y axis) and pPNUTS ChIP-RX (right y axis) centered to transcription end site (TES). The shadow around tracks indicates SEM. (F) PNUTS ChIP performed upon RNase A treatment. IgG ChIP was used as antibody specificity control. TSS, transcription start site; 3′RT, 3′ readthrough site; neg ct, negative control (mean ± SD of technical triplicates of a representative experiment; n = 3). (G) Immunoblots documenting phosphorylation of SF3B1 at the indicated sites. U2OS cells were transfected with a siRNA pool targeting PNUTS and, 48 h later, treated with 25 nM calyculin A for 30 min. ACTB was used as loading control (n = 3). See also Figure S3.
Figure 4
Figure 4
NUAK1 Controls Chromatin Association of PNUTS (A) Immunoblots documenting phosphorylation of SF3B1 at the indicated sites. U2OS cells were treated 4 h with 50 μM GILK (or control [CT]) peptide. ACTB was used as loading control (n = 3). (B) Immunoblots documenting phosphorylation of SF3B1 at the indicated sites. U2OS cells stably expressing a doxycycline (DOX)-inducible shRNA targeting NUAK1 mRNA (shNUAK1 #3 in Figure 2F) was induced with DOX for 24 h. ACTB was used as loading control (n = 3). (C) Same as B, but using and siRNA pool targeting NUAK1 (siNUAK1) or control siRNA pool. ACTB was used as loading control (n = 3). (D) Left: Venn diagram showing the overlap between significantly differentially regulated phosphosites identified in response to siRNA-mediated NUAK1 depletion (48 h) or treatment with 10 μM BAY-880 (2 h) in a TMT phosphoproteomic experiment. Right: GO term analysis of differentially phosphorylated proteins. At the top is a Venn diagram showing the overlap between all identified GO terms; below is a pie chart of categories of 48 RNA-related GO terms. (E) Immunoblots documenting phosphorylation of PNUTS at S313 and of SF3B1 at the indicated sites after 24 h incubation of U2OS cells with the indicated concentrations of BAY-880 or HTH-01-015. ACTB was used as loading control (n = 3). (F) Read density plot analysis of PNUTS ChIP-seq upon 4 h 10 μM BAY-880 treatment (n = 3,172 PNUTS-bound genes). The shadow around tracks indicates SEM. TSS, transcription start site; TES, transcription end site. (G) Genome Browser track at the TPM1 gene of PNUTS ChIP-seq and phospho-S313-PNUTS (pPNUTS) ChIP-RX from U2OS cells treated 4 h with 10 μM BAY-880. Input tracks are included as control. (H) ChIP experiments using an α-HA antibody showing chromatin association of wild-type PNUTS and of PNUTS S313A after transfection in U2OS cells of expression plasmids encoding HA-tagged PNUTS or empty vector (EV). IgG ChIP was used as antibody specificity control. TSS, transcription start site; 3′RT, 3′ readthrough site; neg ct, negative control (mean ± SD of technical triplicates of a representative experiment; n = 3). (I) Immunoblots documenting phosphorylation of SF3B1 at the indicated sites after treatment of U2OS cells with 10 μM BAY-880 or 1 μM pladienolide B (PlaB) for 4 h. VCL was used as loading control. Quantification of T313- and T328-SF3B1 bands was compared with DMSO-treated samples and normalized to VCL band intensity from three independent experiments. See also Figures S4 and S5 and Table S1.
Figure 5
Figure 5
NUAK1 Promotes Splicing and Transcription Termination (A) Left: definition of read categories; orange reads represent mature mRNA, yellow reads pre-mRNA. Right: percentage (average ± SD) of reads identified in the nascent RNA-seq analysis described in Figure S5F. (B) Genome Browser tracks of 4sU-labeled RNA recovered from a pulse-chase experiment performed as described in Figure S5F. For each chased (C) sample, three replicates (rep) are reported. Tracks were first normalized to overall reads, then exonic reads were electronically removed. (C) Kernel density plot of the number of reads harboring splice junctions (spliced reads; see A). Read counts were normalized to the number of exons per gene and the bandwidth was set to 0.3. Genes without spliced reads were removed. The mean over all replicates was plotted (DMSO, n = 16,257; BAY-880, n = 14,602; PlaB, n = 13,216; DMSO pulse, n = 13,249). (D) Gene sets identified by a GSEA on GO terms of genes showing splicing defects upon NUAK1 inhibition. Genes were ranked according to their splicing score. Splicing score was defined as the ratio between reads harboring splice junctions (spliced reads; see A) and pre-mRNA reads (reads falling into introns and intron-exon-spanning reads; yellow in A). (E) Top: kernel density plot of the termination score. The mean over all replicates was plotted and the bandwidth was set to 0.3 (DMSO, n = 18,782; BAY-880, n = 18,907; PlaB, n = 17,639; DMSO pulse, n = 16,342). Bottom: definition of termination score as reads in TES or TES + 20 kb/pre-mRNA reads, whereas pre-mRNA reads are defined as all reads falling into introns and intron-exon-spanning reads (i.e., yellow in A). (F) Genome Browser tracks of nascent RNA expression of a representative gene displaying termination readthrough. Tracks were generated as described in B (cumulative gene browser picture from three independent replicates). See also Figure S5.
Figure 6
Figure 6
NUAK1 Controls RNAPII-Mediated Elongation in a MYC-Dependent Manner (A) RNAPII occupancy at three representative genes. Blue, Genome Browser tracks of RNAPII ChIP-RX upon treatment with 4 h 10 μM BAY-880 or DMSO in control cells (− MYC) or upon 20 h MYC-ER activation with 100 nM 4-OHT (+ MYC). Red, read difference between BAY-880 and DMSO samples. (B) Read density plots of RNAPII ChIP-RX analysis upon treatment with 4 h 10 μM BAY-880 or DMSO in control cells (− MYC) or upon 20 h MYC-ER activation with 100 nM 4-OHT (+ MYC). Plots are centered to transcription start site (TSS, left), RNAPII pause site (middle), or first exon-intron boundary (right). (C) Read density plots of RNAPII ChIP-RX analysis upon treatment with 4 h 10 μM BAY-880 or DMSO in control cells (− MYC) or upon MYC-ER activation (+ MYC). Plots are centered to transcription end site (TES). The shadow around tracks indicates SEM. See also Figure S6.
Figure 7
Figure 7
NUAK1 Affects Nascent RNA Synthesis, R-Loop Formation, and De-capping enzyme Recruitment in a MYC-Dependent Manner (A) Nascent RNA synthesis of two representative genes as determined by a 15 min pulse of 4sU incorporation (P). Blue, Genome Browser tracks of nascent RNA upon treatment with 4 h 10 μM BAY-880 or DMSO in control cells (− MYC) or upon MYC-ER activation (+ MYC; 20 h). Flowchart of experiment is shown in Figure S5E. Tracks were generated as described in Figure 5B. Gray, ratio of reads in DMSO and BAY-880-treated samples. (B) Transcription start site (TSS)-centered read density plot (n = 6,133) of 4sU-labeled nascent RNA (15 min pulse; P) upon 2 h treatment with 10 μM BAY-880, 1 μM flavopiridol (FP), 1 μM NVP-2, or DMSO in control cells (− MYC) or upon MYC activation (+ MYC; 18 h). The shadow around tracks indicates SEM. (C) Top: Genome Browser track of a region of chromosome 7 showing DRIP(DNA-RNA-immunoprecipitation)-seq data in U2OS cells (GEO: GSE115957). Black bars, genes. Magnification shows detail of ACTB gene. Bottom: blue, Genome Browser tracks showing RNAPII occupancy at the ACTB gene locus upon treatment with 4 h 10 μM BAY-880 or DMSO in control cells (− MYC) or upon 20 h MYC activation with 100 nM 4-OHT (+ MYC). Red, read difference between BAY-880 and DMSO samples. Red arrows indicate the position of primers used for DRIP-qPCR (D). (D) Left: DRIP-qPCRs of U2OS MYC-ER cells treated with DMSO or 10 μM BAY-880 for 4 h and, where indicated, co-treated with 100 nM 4-OHT for 20 h (MYC). RNase H treatment and a negative region were used to test antibody specificity. Right: box blot summarizing all performed DRIP-qPCR analyses of U2OS MYC-ER cells treated as in the left plot. The plot shows average of 38 genetic loci (Figure S7I) tested in three biologically independent experiments. All sets of data were normalized to their respective DMSO/-MYC condition. Dots represent values in the 10th to 90th percentiles. Wilcoxon matched-pairs signed rank tests were performed to compare the different conditions (n.s., not significant). (E) DCP1A ChIP of U2OS MYC-ER cells treated with DMSO or 10 μM BAY-880 for 4 h and, where indicated, co-treated with 100 nM 4-OHT for 20 h (MYC). All tested genetic loci reside at the TSS of the indicated genes. IgG ChIP and a negative region were used as antibody specificity controls. Neg ct, negative control (mean ± SD of technical triplicates of a representative experiment; n = 2). (F) Model summarizing our findings. For details, see text. See also Figures S6 and S7.

Comment in

Similar articles

Cited by

References

    1. Aubol B.E., Hailey K.L., Fattet L., Jennings P.A., Adams J.A. Redirecting SR protein nuclear trafficking through an allosteric platform. J. Mol. Biol. 2017;429:2178–2191. - PMC - PubMed
    1. Austenaa L.M., Barozzi I., Simonatto M., Masella S., Della Chiara G., Ghisletti S., Curina A., de Wit E., Bouwman B.A., de Pretis S. Transcription of mammalian cis-regulatory elements is restrained by actively enforced early termination. Mol. Cell. 2015;60:460–474. - PubMed
    1. Baluapuri A., Hofstetter J., Dudvarski Stankovic N., Endres T., Bhandare P., Vos S.M., Adhikari B., Schwarz J.D., Narain A., Vogt M. MYC recruits SPT5 to RNA polymerase II to promote processive transcription elongation. Mol. Cell. 2019;74:674–687.e11. - PMC - PubMed
    1. Banerjee S., Buhrlage S.J., Huang H.T., Deng X., Zhou W., Wang J., Traynor R., Prescott A.R., Alessi D.R., Gray N.S. Characterization of WZ4003 and HTH-01-015 as selective inhibitors of the LKB1-tumour-suppressor-activated NUAK kinases. Biochem. J. 2014;457:215–225. - PMC - PubMed
    1. Banerjee S., Zagórska A., Deak M., Campbell D.G., Prescott A.R., Alessi D.R. Interplay between Polo kinase, LKB1-activated NUAK1 kinase, PP1βMYPT1 phosphatase complex and the SCFβTrCP E3 ubiquitin ligase. Biochem. J. 2014;461:233–245. - PMC - PubMed

Publication types

MeSH terms