. 2020 Jan 30;11(1):602.
doi: 10.1038/s41467-020-14290-4.

Tumor heterogeneity and clonal cooperation influence the immune selection of IFN-γ-signaling mutant cancer cells

Affiliations

Tumor heterogeneity and clonal cooperation influence the immune selection of IFN-γ-signaling mutant cancer cells

Jason B Williams et al. Nat Commun. .

Abstract

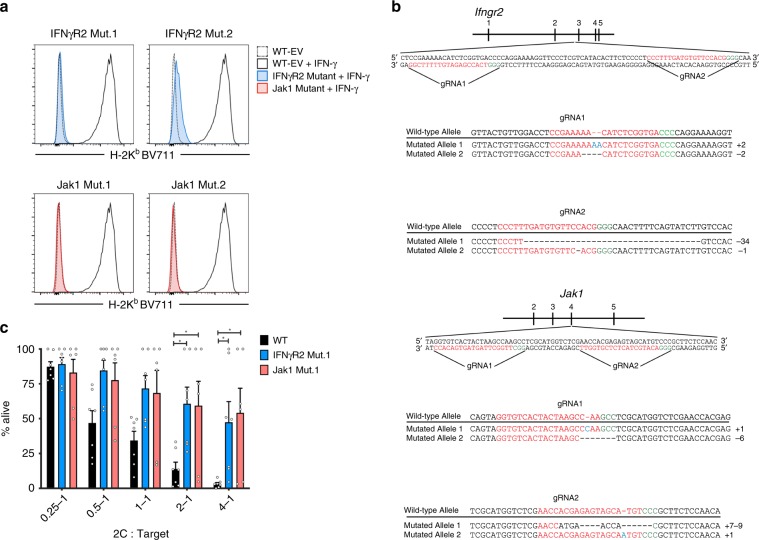
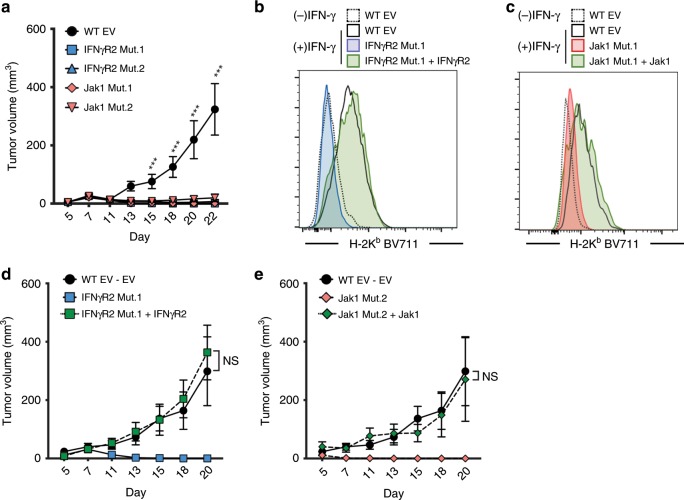
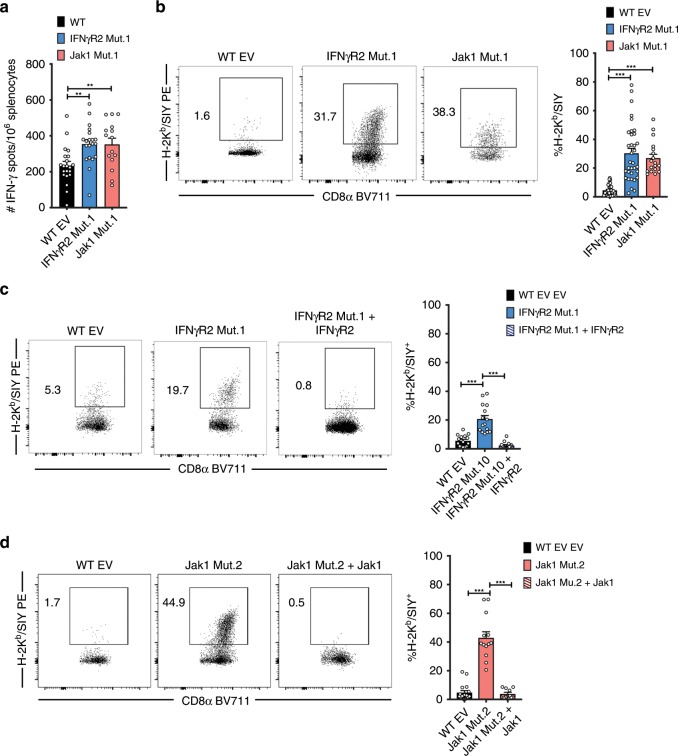
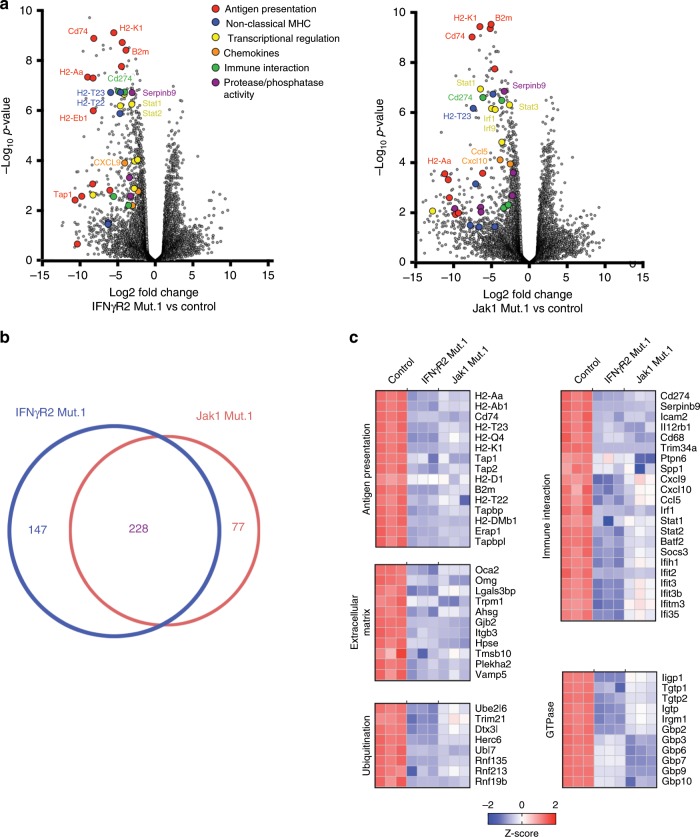
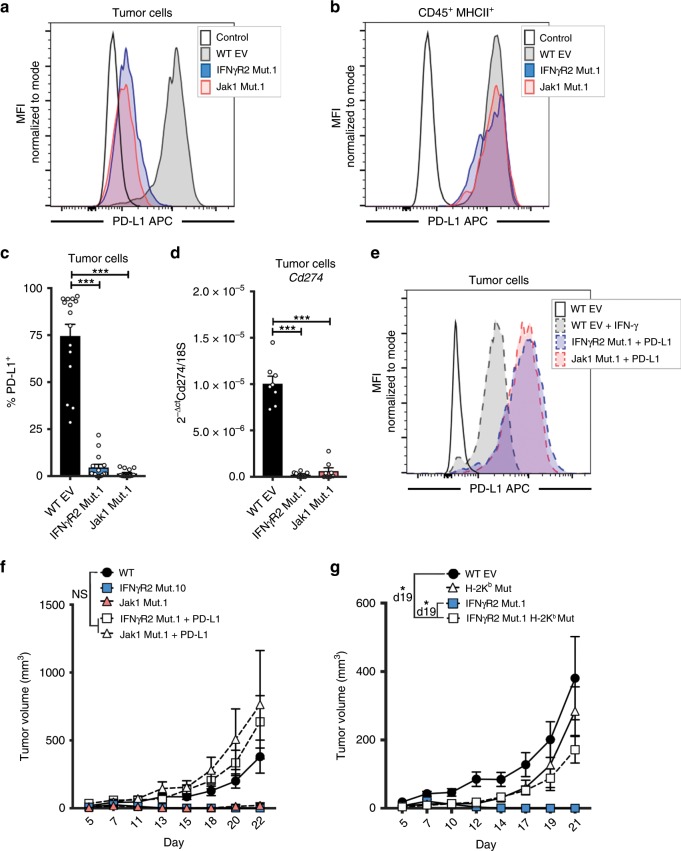
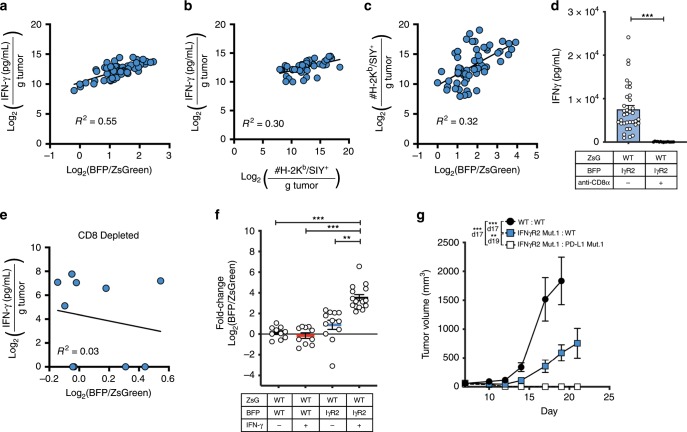
PD-1/PD-L1 blockade can promote robust tumor regression yet secondary resistance often occurs as immune selective pressure drives outgrowth of resistant tumor clones. Here using a genome-wide CRISPR screen in B16.SIY melanoma cells, we confirm Ifngr2 and Jak1 as important genes conferring sensitivity to T cell-mediated killing in vitro. However, when implanted into mice, these Ifngr2- and Jak1-deficient tumors paradoxically are better controlled immunologically. This phenotype maps to defective PD-L1 upregulation on mutant tumor cells, which improves anti-tumor efficacy of CD8+ T cells. To reconcile these observations with clinical reports of anti-PD-1 resistance linked to emergence of IFN-γ signaling mutants, we show that when mixed with wild-type tumor cells, IFN-γ-insensitive tumor cells indeed grow out, which depends upon PD-L1 expression by wild-type cells. Our results illustrate the complexity of functions for IFN-γ in anti-tumor immunity and demonstrate that intratumor heterogeneity and clonal cooperation can contribute to immunotherapy resistance.


Conflict of interest statement

The authors declare no competing interests.

Figures

Fig. 1
Fig. 1. A genome-wide CRISPR/Cas9 screen identifies Ifngr2 and Jak1 as essential for T cell-mediated killing of B16.SIY cells in vitro.
a In vitro assessment for loss of IFN-γ signaling. Tumor cell clones were stimulated with 10 ng/mL IFN-γ for 16 h and measured for H-2Kb upregulation by flow cytometry. b Genotype of IFNγR2- and Jak1-mutant cell lines. Colors highlight features as follows: red, gRNA sequence; green, PAM; blue, nucleotide insertion. c Relative resistance of IFNγR2- and Jak1-mutant tumor cells to T cell-mediated killing in vitro. Tumor cells were incubated with pre-primed 2 C T cells for 24 h and remaining cells were measured by live/dead staining. n = 7 assays; data are pooled from three independent experiments. Results are expressed as mean ± s.e.m. Statistical significance was determined by a two-way ANOVA Bonferroni post-hoc test (c). *p < 0.05.
Fig. 2
Fig. 2. IFNγR2- and Jak1-mutant tumors are spontaneously controlled in vivo.
a Tumor growth curves of WT, IFNγR2-, and Jak1-mutant tumors. n = 10 mice; data are pooled from two independent experiments. b, c Representative histogram showing restored IFN-γ signaling after retroviral reintroduction of IFNγR2 (b) or Jak1 (c). Tumor cells were stimulated with 10 ng/mL IFN-γ for 16 h and measured for H-2Kb upregulation by flow cytometry. n = 4 stimulations; data is representative of two independent experiments. d, e Restoration of progressive tumor growth of IFNγR2 Mut.1 tumors with reintroduced IFNγR2 (d) and Jak1 Mut.1 tumors with reintroduced Jak1 (e). n = 15 mice (WT EV, IFNγR2 Mut.1, and IFNγR2 Mut.1 + IFNγR2), n = 10 mice (Jak1 Mut.2), n = 5 mice (Jak1 Mut.2 + Jak1); data are pooled from three (d) or one (e) independent experiments. Results are expressed as mean ± s.e.m. Statistical significance was determined by a two-way ANOVA Bonferroni post-hoc test (a, d, e). *** p < 0.001.
Fig. 3
Fig. 3. CD8+ T cells are required for the spontaneous control of IFN-γ-insensitive tumors.
a Tumor outgrowth of WT, IFNγR2 Mut.1, and Jak1 Mut.2 tumors in Rag2–/– mice. n = 6 mice; data are pooled from two independent experiments. b Tumor outgrowth of WT, IFNγR2 Mut.1 CD8+ T cell-depleted mice. Mice received 200 μg of anti-CD8α (clone YTS169.4). n = 8 mice (WT and IFNγR2 Mut.1) and n = 7 mice (Jak1 Mut.1); data are pooled from two independent experiments. Results are expressed as mean ± s.e.m. Statistical significance was determined by a two-way ANOVA Bonferroni post-hoc test (a, b). *** p < 0.001.
Fig. 4
Fig. 4. The antitumor CD8+ T cell response is augmented against IFN-γ-insensitive tumors.
a Frequency of splenic IFN-γ-secreting T cells in response to SIY measured by enzyme-linked immunospot (ELISPOT). Splenocytes were isolated from mice on day 7 after tumor engraftment and cultured with 100 μM SIY for 18 h. n = 21 mice (WT), n = 20 mice (IFNγR2 Mut.1), and n = 10 mice (Jak1 Mut.1); data are pooled from 4 (IFNγR2 Mut.1) or 2 (Jak1 Mut.1) independent experiments. b Representative flow cytometry plots (left) and cumulative data (right) of H-2Kb/SIY+ CD8+ TILs isolated on day 7 after engraftment of WT, IFNγR2 Mut.1, and Jak1 Mut.1 tumor cells. n = 33 mice (WT), n = 34 mice (IFNγR2 Mut.1), and n = 18 mice (Jak1 Mut.1); data are pooled from six (IFNγR2 Mut.1) or four (Jak1 Mut.1) independent experiments. c As in b but with IFNγR2 Mut.1 tumors with reintroduced IFNγR2. n = 15 mice (WT and IFNγR2 Mut.1), n = 14 mice (IFNγR2 Mut.1 + IFNγR2); data are pooled from three independent experiments. d As in b but with Jak1 Mut.1 tumors with reintroduced Jak1. n = 17 mice (WT), n = 13 mice (Jak1 Mut.1), and n = 10 mice (Jak1 Mut.1 + Jak1); data are pooled from three independent experiments. Results are expressed as mean ± s.e.m. Statistical significance was determined by a Kruskal-Wallis (non-parametric) test (ad). *p < 0.05, **p < 0.01, ***p < 0.001.
Fig. 5
Fig. 5. A complex genetic program is induced by IFN-γ signaling in tumor cells that includes PD-L1.
a Volcano plot of differentially expressed genes (DEGs) from IFNγR2- and Jak1-mutant tumor cells compared to WT tumor cells. Tumor cells were sorted on day 7 after tumor engraftment. b The number of unique and shared DEGs between IFNγR2- and Jak1-mutant tumor cells. c Selected downregulated genes in IFNγR2- or Jak1-mutant tumor cells compared to WT tumor cells grouped by biological pathway. Numerical values in heat map are expressed as Z-scores.
Fig. 6
Fig. 6. Re-establishment of PD-L1 restores progress tumor growth of IFN-γ-insensitive tumors.
ac Representative histograms of PD-L1 expression on tumor cells (a) or CD45+ MHCII+ APCs (b) from IFNγR2 Mut.1, Jak1 Mut.1, or WT tumors and summary of percent PD-L1+ tumor cells (c). Analysis was performed on day 7 after tumor engraftment. n = 15 mice; data are pooled from three independent experiments. d mRNA expression of PD-L1 from sorted tumor cells on day 7 after tumor engraftment. n = 8 mice; data are pooled from two independent experiments. e Representative histogram of PD-L1 expression after retroviral introduction of PD-L1 in IFNγR2- and Jak1-mutant tumor cells in vitro. Expression of PD-L1 was compared to WT tumor cells with or without IFN-γ stimulation. f Tumor outgrowth curves when PD-L1 was re-expressed in IFNγR2- and Jak1-mutant tumor cells. n = 10 mice (WT, IFNγR2 Mut1, Jak1 Mut1, and IFNγR2 Mut.1 + PD-L1) and n = 5 mice (Jak1 Mut.1 + PD-L1); data are pooled from two independent experiments (IFNγR2) or from one experiment (Jak1). g Tumor outgrowth curves when H-2Kb was deleted in IFNγR2-mutant tumor cells. n = 10 mice (WT and IFNγR2 Mut.1), n = 15 mice (IFNγR2 Mut.1 H-2Kb Mut), and n = 5 mice (H-2Kb Mut); data are pooled from two independent experiments. Results are expressed as mean ± s.e.m. Statistical significance was determined by a Kruskal-Wallis (non-parametric) test (b, c) and a two-way ANOVA Bonferroni post-hoc test (f, g). *p < 0.05, ***p < 0.001.
Fig. 7
Fig. 7. When mixed with WT tumor cells, IFN-γ-insensitive tumor cells selectively grow out following to anti-PD-L1 therapy in vivo.
a Tumor outgrowth of mixed WT and IFNγR2-mutant tumors with and without anti-PD-L1 therapy. n = 24 mice (WT:WT), n = 14 mice (WT:WT + anti-PD-L1), n = 25 mice (IFNγR2 Mut.1:WT), and n = 28 (WT:IFNγR2 Mut.1 + anti-PD-L1); data are pooled from four independent experiments. b Log2(BFP/ZsGreen) fold-change after anti-PD-L1 therapy. c Fold-change of mixed tumors in Rag2–/– mice. n = 9 mice (WT:WT) and n = 10 mice (WT:IFNγR2 Mut.1); data are pooled from two independent experiments. d Representative flow plots of tumor composition of mixed WT:IFNγR2-mutant tumors in the context of a strong and weak immune response. e Tumor composition of mixed tumors from individual mice treated with anti-PD-L1. f Correlation between H-2Kb/SIY+ CD8+ TILs and selection for WT-BFP or IFNγR2 Mut.1 BFP. For (b, e, f) n = 13 mice (WT:WT + anti-PD-L1) and n = 15 mice (WT:IFNγR2 Mut.1 + anti-PD-L1); data are pooled from five independent experiments. Results are expressed as mean ± s.e.m. Statistical significance was determined by a two-way ANOVA Bonferroni post-hoc test (a) and a Kruskal-Wallis (non-parametric) test (b, c). Least squares regression was performed in (f). **p < 0.01, ***p < 0.001.
Fig. 8
Fig. 8. The antitumor effects of IFN-γ on WT tumor cells drives selection for IFNγR2-mutant tumor cells.
a and b Correlation between the concentration of intratumoral IFN-γ and the fold-change in the frequency of BFP+ versus ZsGreen+ tumor cells (a) and the total number of H-2Kb/SIY+ CD8+ TILs (b). c Correlation between the total number of H-2Kb/SIY+ CD8+ TILs and fold-change in the frequency of BFP+ versus ZsGreen+ tumor cells. ac Tumors were analyzed on day 14 after tumor inoculation. All data were log2-transformed. n = 60 mice (a, c) and n = 49 mice (b); data are pooled from five independent experiments. d Concentration of IFN-γ after CD8+ T cell depletion. n = 35 mice (no treatment) and n = 15 mice (anti-CD8α) e Correlation between intratumoral IFN-γ and log2(BFP/ZsGreen) fold-change in the absence of CD8+ T cells. Mice received 200 μg anti-CD8a (clone YTS169.4) on days -1 and 7. Tumors were analyzed on day 14. n = 10 mice; data are pooled from two independent experiments. f Fold-change in BFP+ versus ZsGreen+ tumor cells after administration of recombinant mouse IFN-γ. 50 μg of IFN-γ was administered i.p. on days 7, 10, 13, and 16. Tumor cell composition was analyzed on day 18. n = 10 mice (WT:WT and WT:WT + IFN-γ), n = 12 mice (WT:IγR2), and n = 15 mice (WT:IγR2 + IFN-γ); data are pooled from two independent experiments. g Tumor outgrowth of mixed WT and PD-L1-mutant tumors. n = 10 mice; data are pooled from two independent experiments. Results are expressed as mean ± s.e.m. Least squares regression was performed in (ac, e). Statistical significance was determined by a Mann-Whitney test (f) and a two-way ANOVA Bonferroni post-hoc test (g). *p < 0.05, **p < 0.01, ***p < 0.001.

Similar articles

Cited by

References

    1. Gong J, Chehrazi-Raffle A, Reddi S, Salgia R. Development of PD-1 and PD-L1 inhibitors as a form of cancer immunotherapy: a comprehensive review of registration trials and future considerations. J. Immunother. Cancer. 2018;6:8. doi: 10.1186/s40425-018-0316-z. - DOI - PMC - PubMed
    1. Rosenberg JE, et al. Atezolizumab in patients with locally advanced and metastatic urothelial carcinoma who have progressed following treatment with platinum-based chemotherapy: a single-arm, multicentre, phase 2 trial. Lancet. 2016;387:1909–1920. doi: 10.1016/S0140-6736(16)00561-4. - DOI - PMC - PubMed
    1. Powles T, et al. MPDL3280A (anti-PD-L1) treatment leads to clinical activity in metastatic bladder cancer. Nature. 2014;515:558–562. doi: 10.1038/nature13904. - DOI - PubMed
    1. Brahmer JR, et al. Safety and activity of anti-PD-L1 antibody in patients with advanced cancer. N. Engl. J. Med. 2012;366:2455–2465. doi: 10.1056/NEJMoa1200694. - DOI - PMC - PubMed
    1. Topalian SL, et al. Safety, activity, and immune correlates of anti-PD-1 antibody in cancer. N. Engl. J. Med. 2012;366:2443–2454. doi: 10.1056/NEJMoa1200690. - DOI - PMC - PubMed

Publication types