

FocAn: automated 3D analysis of DNA repair foci in image stacks acquired by confocal fluorescence microscopy
- PMID: 31992200
- PMCID: PMC6986076
- DOI: 10.1186/s12859-020-3370-8
FocAn: automated 3D analysis of DNA repair foci in image stacks acquired by confocal fluorescence microscopy
Abstract
Background: Phosphorylated histone H2AX, also known as γH2AX, forms μm-sized nuclear foci at the sites of DNA double-strand breaks (DSBs) induced by ionizing radiation and other agents. Due to their specificity and sensitivity, γH2AX immunoassays have become the gold standard for studying DSB induction and repair. One of these assays relies on the immunofluorescent staining of γH2AX followed by microscopic imaging and foci counting. During the last years, semi- and fully automated image analysis, capable of fast detection and quantification of γH2AX foci in large datasets of fluorescence images, are gradually replacing the traditional method of manual foci counting. A major drawback of the non-commercial software for foci counting (available so far) is that they are restricted to 2D-image data. In practice, these algorithms are useful for counting the foci located close to the midsection plane of the nucleus, while the out-of-plane foci are neglected.
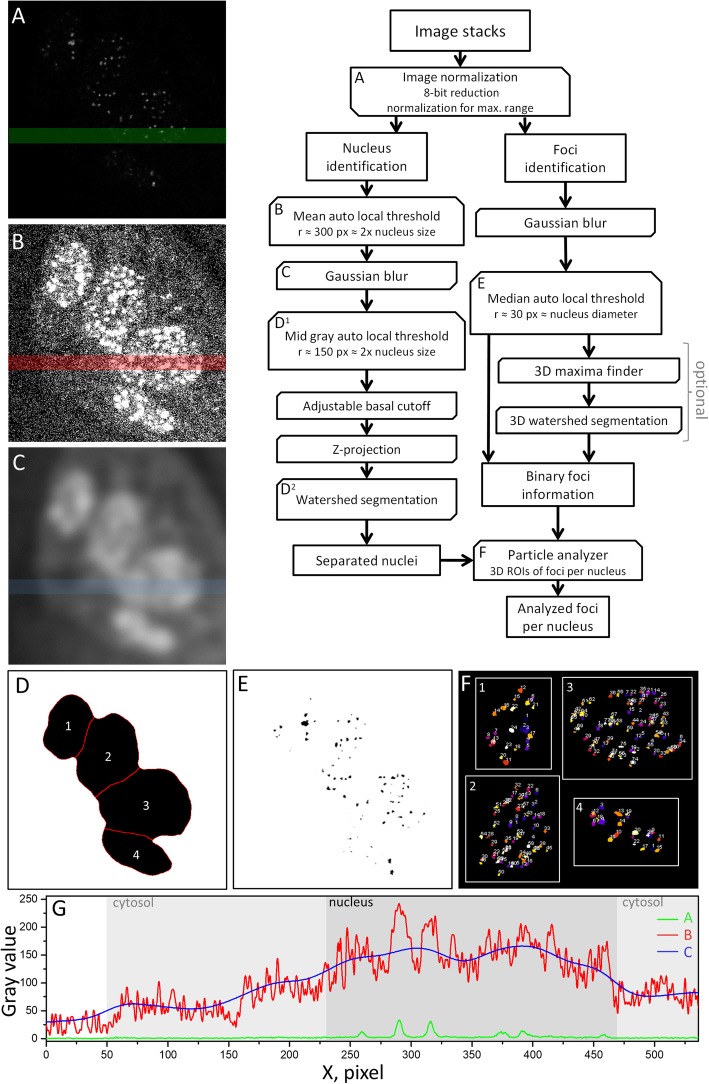
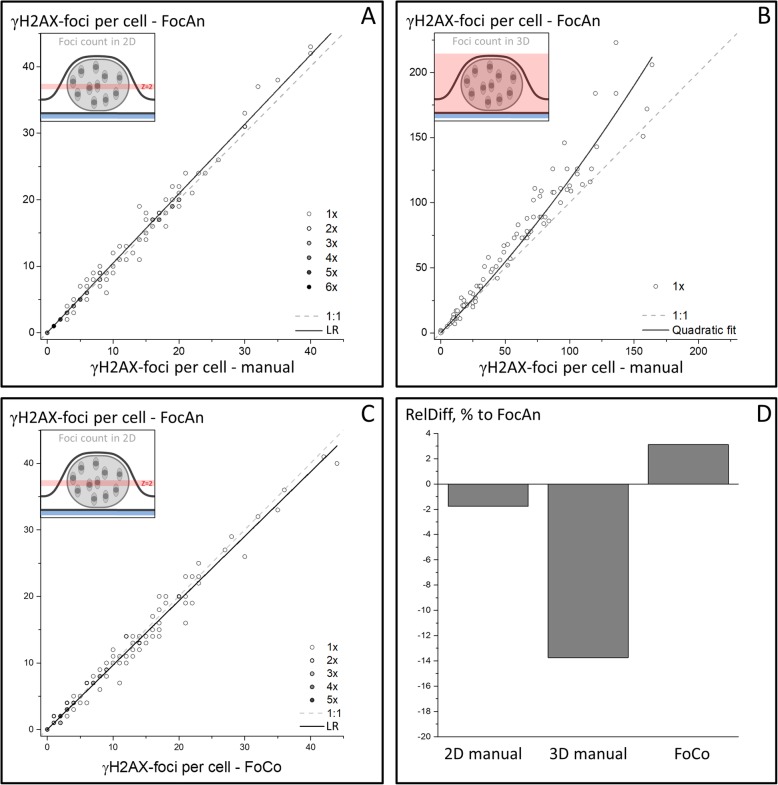
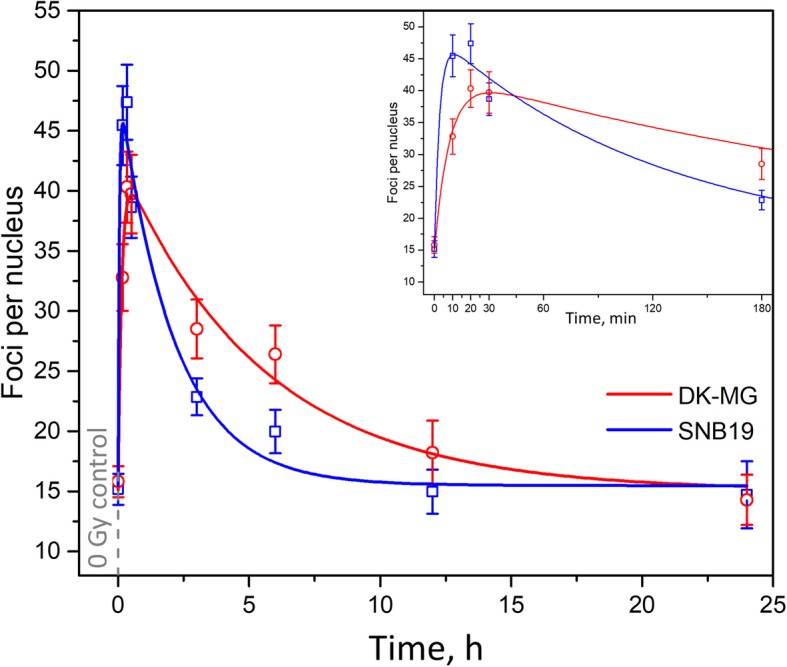
Results: To overcome the limitations of 2D foci counting, we present a freely available ImageJ-based plugin (FocAn) for automated 3D analysis of γH2AX foci in z-image stacks acquired by confocal fluorescence microscopy. The image-stack processing algorithm implemented in FocAn is capable of automatic 3D recognition of individual cell nuclei and γH2AX foci, as well as evaluation of the total foci number per cell nucleus. The FocAn algorithm consists of two parts: nucleus identification and foci detection, each employing specific sequences of auto local thresholding in combination with watershed segmentation techniques. We validated the FocAn algorithm using fluorescence-labeled γH2AX in two glioblastoma cell lines, irradiated with 2 Gy and given up to 24 h post-irradiation for repair. We found that the data obtained with FocAn agreed well with those obtained with an already available software (FoCo) and manual counting. Moreover, FocAn was capable of identifying overlapping foci in 3D space, which ensured accurate foci counting even at high DSB density of up to ~ 200 DSB/nucleus.
Conclusions: FocAn is freely available an open-source 3D foci analyzer. The user-friendly algorithm FocAn requires little supervision and can automatically count the amount of DNA-DSBs, i.e. fluorescence-labeled γH2AX foci, in 3D image stacks acquired by laser-scanning microscopes without additional nuclei staining.
Keywords: Automated analysis; DNA double-strand breaks; ImageJ plugin; Ionizing radiation; Open-source tool; Radiation biology; γH2AX-foci.
Conflict of interest statement
The authors declare that they have no competing interests.
Figures
Similar articles
-
Improved identification of DNA double strand breaks: γ-H2AX-epitope visualization by confocal microscopy and 3D reconstructed images.Radiat Environ Biophys. 2019 May;58(2):295-302. doi: 10.1007/s00411-019-00778-1. Epub 2019 Feb 24. Radiat Environ Biophys. 2019. PMID: 30799523
-
FoCo: a simple and robust quantification algorithm of nuclear foci.BMC Bioinformatics. 2015 Nov 21;16:392. doi: 10.1186/s12859-015-0816-5. BMC Bioinformatics. 2015. PMID: 26589438 Free PMC article.
-
Fully automated counting of DNA damage foci in tumor cell culture: A matter of cell separation.DNA Repair (Amst). 2021 Jun;102:103100. doi: 10.1016/j.dnarep.2021.103100. Epub 2021 Mar 16. DNA Repair (Amst). 2021. PMID: 33812230
-
Mechanism of elimination of phosphorylated histone H2AX from chromatin after repair of DNA double-strand breaks.Mutat Res. 2010 Mar 1;685(1-2):54-60. doi: 10.1016/j.mrfmmm.2009.08.001. Epub 2009 Aug 12. Mutat Res. 2010. PMID: 19682466 Review.
-
Microscopic imaging of DNA repair foci in irradiated normal tissues.Int J Radiat Biol. 2009 Sep;85(9):732-46. doi: 10.1080/09553000902785791. Int J Radiat Biol. 2009. PMID: 19296345 Review.
Cited by
-
A computational approach to quantifying miscounting of radiation-induced double-strand break immunofluorescent foci.Commun Biol. 2022 Jul 14;5(1):700. doi: 10.1038/s42003-022-03585-5. Commun Biol. 2022. PMID: 35835982 Free PMC article.
-
DNA damage and repair in peripheral blood mononuclear cells after internal ex vivo irradiation of patient blood with 131I.Eur J Nucl Med Mol Imaging. 2022 Apr;49(5):1447-1455. doi: 10.1007/s00259-021-05605-8. Epub 2021 Nov 13. Eur J Nucl Med Mol Imaging. 2022. PMID: 34773472 Free PMC article.
-
Ex vivo radiation sensitivity assessment for individual head and neck cancer patients using deep learning-based automated nuclei and DNA damage foci detection.Clin Transl Radiat Oncol. 2024 Jan 30;45:100735. doi: 10.1016/j.ctro.2024.100735. eCollection 2024 Mar. Clin Transl Radiat Oncol. 2024. PMID: 38380115 Free PMC article.
-
A deep learning model (FociRad) for automated detection of γ-H2AX foci and radiation dose estimation.Sci Rep. 2022 Apr 1;12(1):5527. doi: 10.1038/s41598-022-09180-2. Sci Rep. 2022. PMID: 35365702 Free PMC article.
-
HARLEY mitigates user bias and facilitates efficient quantification and co-localization analyses of foci in yeast fluorescence images.Sci Rep. 2022 Jul 18;12(1):12238. doi: 10.1038/s41598-022-16381-2. Sci Rep. 2022. PMID: 35851403 Free PMC article.
References
Publication types
MeSH terms
Substances
Grants and funding
LinkOut - more resources
Full Text Sources
