. 2020 Mar;19(3):e13097.
doi: 10.1111/acel.13097. Epub 2020 Jan 28.

Mitochondrial function in skeletal myofibers is controlled by a TRF2-SIRT3 axis over lifetime

Affiliations

Mitochondrial function in skeletal myofibers is controlled by a TRF2-SIRT3 axis over lifetime

Jérôme D Robin et al. Aging Cell. 2020 Mar.

Abstract

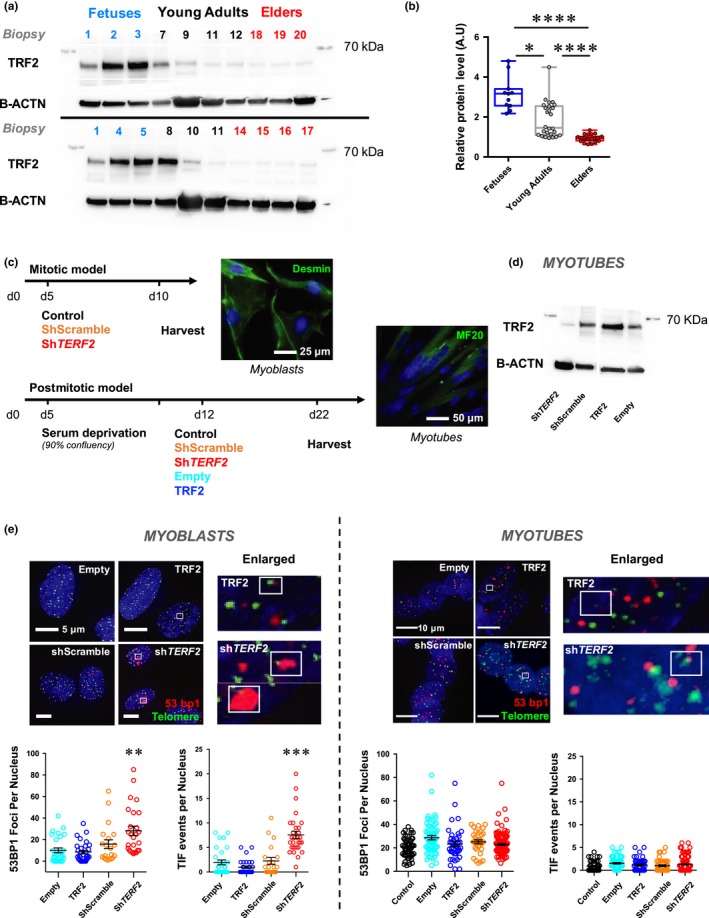
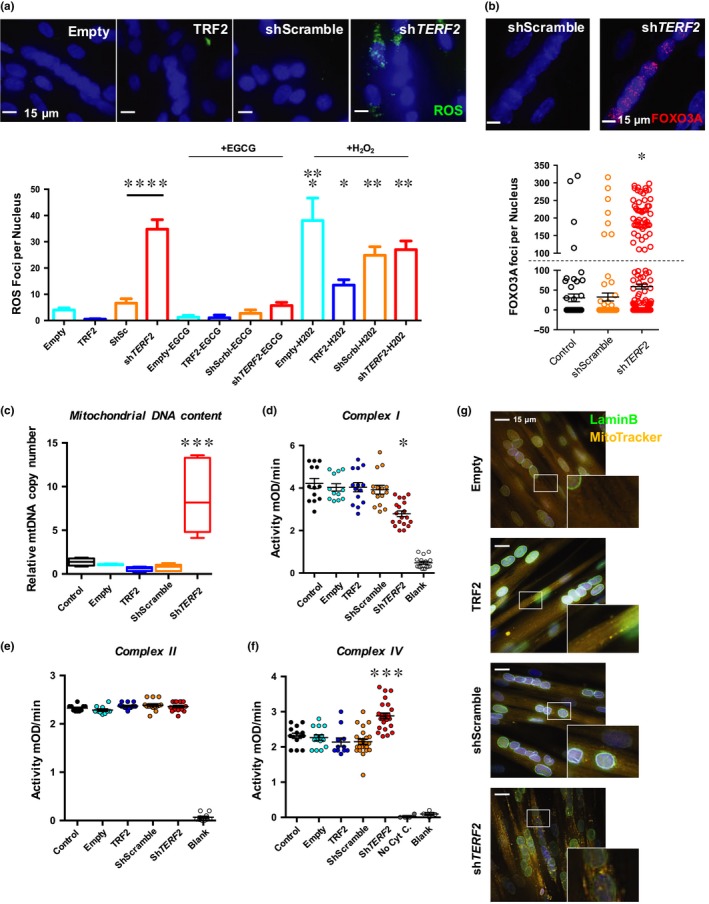
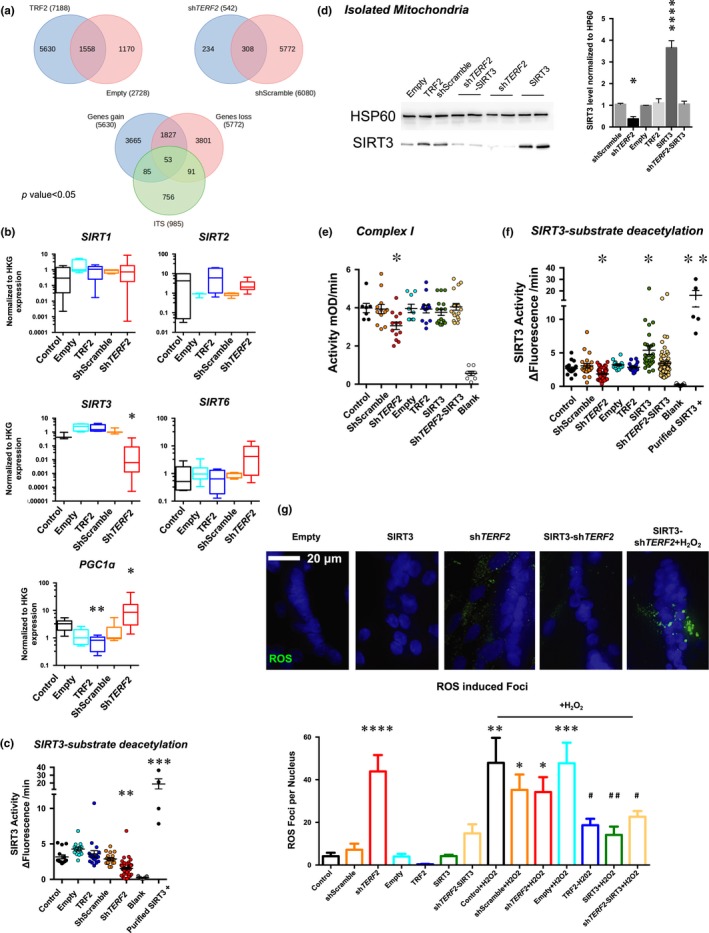
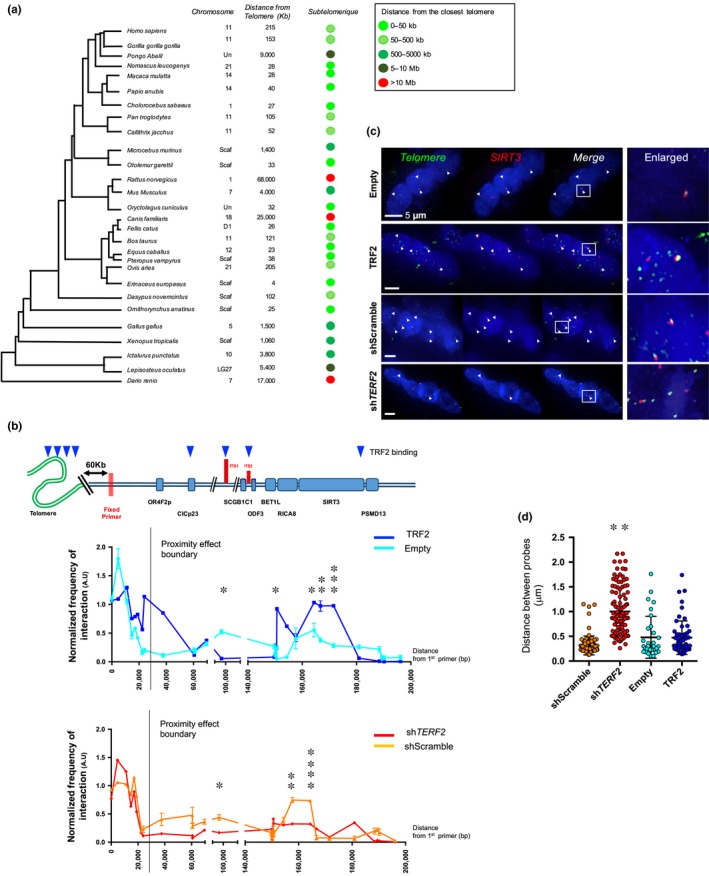
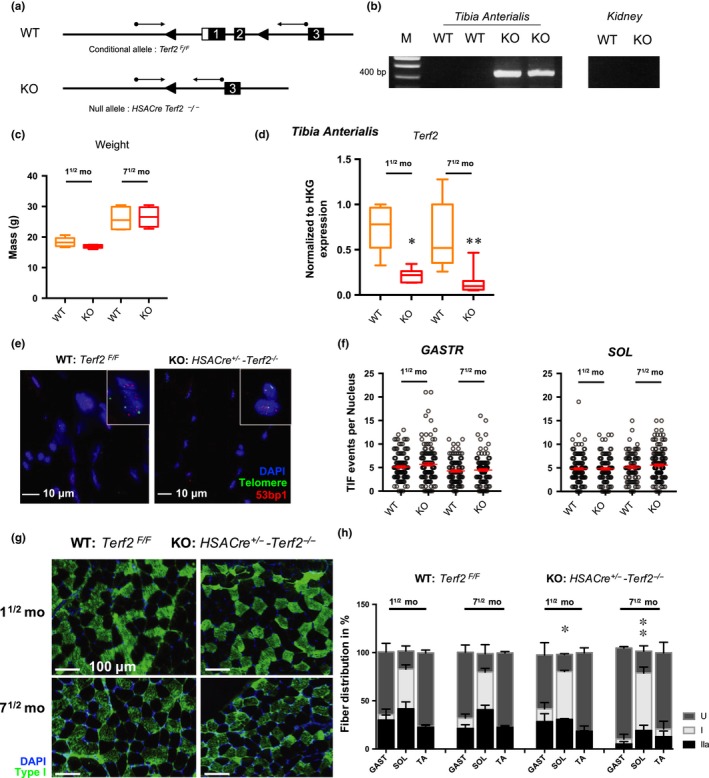
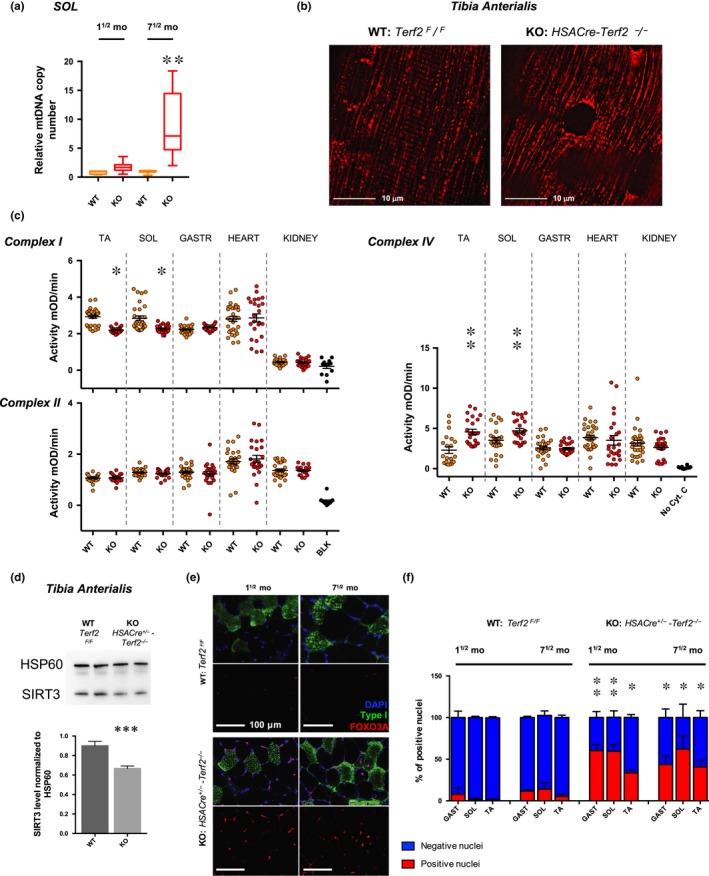
Telomere shortening follows a developmentally regulated process that leads to replicative senescence of dividing cells. However, whether telomere changes are involved in postmitotic cell function and aging remains elusive. In this study, we discovered that the level of the TRF2 protein, a key telomere-capping protein, declines in human skeletal muscle over lifetime. In cultured human myotubes, TRF2 downregulation did not trigger telomere dysfunction, but suppressed expression of the mitochondrial Sirtuin 3 gene (SIRT3) leading to mitochondrial respiration dysfunction and increased levels of reactive oxygen species. Importantly, restoring the Sirt3 level in TRF2-compromised myotubes fully rescued mitochondrial functions. Finally, targeted ablation of the Terf2 gene in mouse skeletal muscle leads to mitochondrial dysfunction and sirt3 downregulation similarly to those of TRF2-compromised human myotubes. Altogether, these results reveal a TRF2-SIRT3 axis controlling muscle mitochondrial function. We propose that this axis connects developmentally regulated telomere changes to muscle redox metabolism.

Keywords: aging; mitochondria; postmitotic cells; skeletal muscle; telomeres.


Conflict of interest statement

None declared.

Figures

Figure 1
Figure 1
Specific TRF2 downregulation in skeletal muscle and myotubes does not trigger telomere damages. (a) Immunoblots and associated quantifications (in independent duplicates, (b) of whole protein extracts from human biopsies (Figure S1) collected at different ages with antibodies against TRF2 (upper panel) and B‐ACTIN used as a loading control (lower panel). Biopsies were grouped in three categories: fetuses; young adults (17–35 yo); and elders (>60 yo). TRF2 level decreases with age, young adults versus elders, p < .001; fetuses versus elders, p < .001 (Kruskal–Wallis multiple comparisons test; α = 0.05). (c) Schematic representation of the strategy used. Myoblasts stained with anti‐desmin antibody and myotubes with MF20 antibody are shown as illustrations; control refers as the untransduced condition. (d) TRF2 immunoblots of transduced human myotubes using B‐ACTIN as a loading control. € 53BP1 staining and TIFs in transduced myoblasts and myotubes performed using a telomeric probe (PNA, green) and 53BP1 (red) antibody indicating dsDNA damage. Means ± SEM are shown. Only foci within multinucleated cells, that is, corresponding to postmitotic myotubes were counted (n > 40 nuclei per condition). No statistical difference in myotubes is seen between the different conditions (TERF2 overexpression or knockdown and respective controls; ANOVA, Kruskal–Wallis multiple comparisons test, α = 0.05). *p < .05; **p < .01; ****p < .001
Figure 2
Figure 2
TRF2 knockdown is associated with increased ROS and modifies mitochondrial activity in postmitotic tissues. (a) Detection of ROS foci in transduced myotubes. We report the total number of ROS foci normalized to the number of nuclei. On average, the number of nuclei per cell and DAPI intensities was identical between conditions (Figure S3). N > 300 nuclei per condition, means ± SEM are shown. Hydrogen peroxide treatment increases ROS foci number (Empty vs. Empty + H2O2, p = .0274; Empty vs. TRF2 + H2O2, p = .0291; Holm–Sidak's multiple comparisons test; α = 0.05). Downregulation of TERF2 significantly increases ROS (shScramble vs. shTERF2, TRCN0000004812, p < .0001; Holm–Sidak's multiple comparisons test; α = 0.05). (b) FOXO3A staining and quantification of foci per nucleus; single nucleus cells were excluded from the analysis. Positive cells correspond to cells exhibiting >100 FOXO3A foci per nucleus (cutoff symbolized by dashed line). N = 300 nuclei per condition, means ± SEM are shown. TERF2 knockdown is associated with an increase of positive FOXO3A cells (n = 7 vs. n = 80 positive nuclei, shScramble vs. shTERF2, respectively, p < .0001; chi‐square test; α = 0.05). (c) Relative quantification of mitochondrial DNA content in transduced myotubes. ShTERF2‐transduced myotubes show an increase in mitochondrial DNA content (shScramble vs. shTERF2, p = .0003; Kruskal–Wallis multiple comparisons test; α = 0.05). N = 6 per condition (biological triplicate in technical duplicate), means ± SEM are shown. (d–f) Mitochondrial complex I (d), II (e), and IV (f) activity in transduced myotubes. ShTERF2‐transduced myotubes exhibit specific mitochondrial defects. We report a decreased complex I activity (p < .001) and an increased complex IV activity (p < .001, Kruskal–Wallis multiple comparison test; α = 0.05). (g) Mitochondrial network in transduced myotubes was analyzed using MitoTracker®. An average of 100 z‐stacks was taken for each condition (DeltaVision Elite®, GE). Pictures from 10 to 15 independent and randomly chosen microscope fields were taken, treated postacquisition, and deconvoluted with IMARIS. Single nucleus cells were excluded from the analysis. Nuclei were stained using an anti‐lamin B antibody (green) and counterstained with DAPI. A punctate mitochondrial staining is observed in myotubes transduced with shTERF2 suggesting mitochondrial fission. Similarly, H2O2 treatments induce a punctuated mitochondrial staining (Figure S3). *p < .05; **p < .01; ***p < .005, ****p < .001
Figure 3
Figure 3
TRF2 binds and modifies expression of the subtelomeric SIRT3 gene. (a) Venn diagrams generated from a TRF2 ChIP‐Seq performed in myotubes, and all data are uploaded into the GEO database under the accession number http://www.ncbi.nlm.nih.gov/geo/query/acc.cgi?acc=GSE88983. Significant peaks (p < .05) were identified and annotated. A differential analysis identified the significant peak that was “lost” or “gained” by TRF2 modulations. A final Venn diagram was then produced using the genes associated with the peaks found only in the shScramble condition (e.g., lost gene); the genes related to the peaks found only in the TRF2 condition (e.g., gained gene) and genes related to ITS by an in silico analysis (see Section 4 for details). The list of 53 genes localized within 100 kb of modulated ChIP peaks and ITS can be found in Table S1. This analysis led to identification of SIRT3 as a candidate gene. (b) Gene expression quantified by RT‐qPCR in transduced myotubes normalized to three housekeeping genes (HKG: HPRT, PPIA, and GAPDH; ΔΔCt method). N = 6 per condition (technical duplicates of biological triplicates), means ± SEM with associated statistical significance are reported (Kruskal–Wallis multiple comparisons test; α = 0.05). TERF2 depletion reduces transcription of SIRT3 without modulating other main Sirtuins, correlates with PGC1α upregulation, and is associated with reduced SIRT3 activity as reported in (c) SIRT3 activity in enriched mitochondria extracts from transduced myotubes. A purified SIRT3 recombinant protein was used as positive control (Kruskal–Wallis multiple comparisons test; α = 0.05). (d–g) SIRT3 rescue experiments and immunoblots of enriched mitochondria extracts from transduced human myotubes using HSP60 as a loading control (d). TERF2‐modulated expression results in decreased SIRT3 level (shScramble vs. shTERF2, p = .0425). (e–f) Mitochondrial complex I (e) and SIRT3 activity (f) in mitochondrial extract from transduced myotubes. SIRT3 overexpression in TRF2‐depleted myotubes restores the mitochondrial‐associated activity (shScramble vs. shTERF2‐SIRT3, p > .9; in both assays, Holm–Sidak's multiple comparisons test; α = 0.05, Figure S5). (g) ROS foci in transduced myotubes. We report the total number of ROS foci normalized to the number of nuclei (Figure S6). N > 400 nuclei per condition, means ± SEM are shown. SIRT3 overexpression decreases ROS foci number upon TERF2 downregulation (shScramble vs. shTERF2‐SIRT3, p = .496; shScramble vs. shTERF2, <.0001; Holm–Sidak's multiple comparisons test; α = 0.05) and protects myotubes under H2O2 treatment (Empty + H2O2 vs. SIRT3 + H2O2, p = .0034; ShScramble + H2O2 vs. SIRT3‐shTERF2, p = .039; Holm–Sidak's multiple comparisons test; α = 0.05). *p < .05; **p < .01; ***p < .001; *****p < .0001; # p < .05; ## p < .01 (H2O2 conditions)
Figure 4
Figure 4
TRF2 depletion modifies higher‐order conformation of the subtelomeric SIRT3 gene. (a) Phylogenetic tree and SIRT3 localization through evolution. For each species, we report the chromosomal position when available (Scaf: scaffold genome; Un: unplaced) and deducted distance from the closest telomere. Remarkably, the subtelomeric position of SIRT3 is well conserved, more particularly among mammals and primates. (b) Chromatin conformation capture (3C) assay. Schematic representation of the 11p locus with TRF2 detected binding regions (top); genes and primer localization are aligned to the 3C performed on the 11p locus (first 2Mb), reported below. Myotubes were collected 10 days after transduction. Each measure represents the amplification of interactions involving a fixed primer (red bars) and a second primer along the 2Mb of the locus, both located in proximity of a HindIII restriction site. TERF2 overexpression enhances subtelomeric looping and interaction between the distal part of the 11p subtelomere and the SIRT3 locus (Empty vs. TRF2 position: 164,360, p = .0195; 166,712, p = .0039; 171,528, p = .0008; unpaired t test; α = 0.05), whereas TERF2 downregulation decreases these interactions (shScramble vs. shTERF2 position: 157,640, p = .0017; 164,360, p < .0001; 166,712, p = .074; 171,528, p = .4785; unpaired t test; α = 0.05). N = 6 per data point (technical duplicates of biological triplicates), means ± SD are shown. No difference was detected between control conditions (Figure S7). (c–d) DNA FISH in 3D‐preserved transduced human myotubes and associated quantifications (c). Telomeres were labeled in green and the SIRT3 locus in red. Distances between gravity centers of the SIRT3 locus signal and the closest telomeric signal are reported; N > 40 nuclei per condition, means ± SEM are shown. Single nucleus cells were excluded from the analysis (e.g., less than 5% of total values). We observe a significant increase in separated signals corresponding to an increased distance between the telomere and SIRT3 locus in myotubes transduced with shTERF2 (Kruskal–Wallis multiple comparisons test; α = 0.05) compared to the other conditions (shScramble, Empty, TRF2). *p < .05; **p < .01; ***p < .001
Figure 5
Figure 5
Muscle‐specific Terf2‐deficient mice do not trigger telomere damages but display increased oxidative fibers. (a) Scheme depicting the Terf2 locus within the targeted conditional allele (Terf2F/F) and the null allele (Terf2/). PCR primers used for genotyping are indicated by arrows. (b) PCR analysis of transgenic mice. Muscle‐specific Terf2 KO allows the amplification of a 385 bp PCR product in muscle fibers. M: molecular weight markers; WT: Terf2F/F mice, KO: HSACre‐Terf2/. (c) No statistical differences of weight were seen among mice of the same age. (d) Knockdown of Terf2 in mature muscle fibers was further validated in RT‐qPCR and IFs (Figure S10). Terf2 expression quantified by RT‐qPCR in RNA extracted from skeletal muscle (TA) from WT and KO mice. Each measure represents the average fold‐change expression of eight independent repetitions (four mice in technical duplicate) normalized to three housekeeping genes (Hprt, Ppib, and Gapdh; ΔΔCt method). Means ± SEM with associated statistical significance are reported (Kruskal–Wallis multiple comparisons test; α = 0.05). € Telomeric induced focus (TIF) analysis in transgenic WT and KO mice and associated quantification reported in (f) in the soleus (SOL) and gastrocnemius (GASTR). For each group, we report the number of TIFs counted in 30 nuclei per mice for a minimum of four mice (minimum of 120 nuclei per group). Means ± SEM are shown. No statistical differences were observed between groups (Kruskal–Wallis multiple comparisons test; α = 0.05). (g–h) Fiber‐type characterization in HSACre+/‐Terf2/ mice using myosin heavy chain antibodies against type I and IIa fibers for the gastrocnemius (GAST), soleus (SOL), and tibia anterialis (TA). n = 5 mice per group. Undetermined fibers (U) represent fibers that remained unstained after using both antibodies (e.g., against type I and type IIa fibers, Figure S10). Means ± SEM are shown. * <.05; ** <.001; *** <.0001
Figure 6
Figure 6
Muscle‐specific Terf2‐deficient mice exhibit increased mitochondrial DNA content, mitochondrial dysfunction, and nuclear Foxo3a accumulation. (a) Relative quantification of mitochondrial DNA content in the soleus of transgenic mice (WT and KO). Terf2 KO mice exhibit a significantly higher mtDNA content (Kruskal–Wallis multiple comparisons test; α = 0.05). n = 12 per group, means ± SEM are shown. (b) Electroporated tibia anterialis (TA), using Mito‐DsRed in control and transgenic mice (n = 4 per group). Electroporation of the construct allows one to stain the mitochondrial network in tissues. The mitochondrial network of KO mice (right) appears punctuated and less structured as in controls (left). (c) Mitochondrial complex I, II, and IV activity in tissues (e.g., kidney; heart; soleus; tibia anterialis) from 40‐week‐old transgenic WT and KO mouse (n = 10 per data point). Terf2 KO mice exhibit skeletal muscle‐specific mitochondrial defects. We report a decreased complex I activity (p < .05, paired, two‐tailed Student's t test; α = 0.05) and an increased complex IV activity (p < .001, paired, two‐tailed Student's t test; α = 0.05), potentially part of a compensating phenomenon. No statistical differences were observed between WT and KO kidney and heart extracts. (d) SIRT3 immunoblots of enriched mitochondria extracts from the tibia anterialis (TA) of transgenic mice using HSP60 as loading control. N = 5 per group. Terf2 abolished expression results in decreased SIRT3 level (WT vs. KO, p = .0007). (e–f) Foxo3a immunofluorescence and associated quantifications in muscles along with type I staining (e.g., GAST, SOL, and TA). No statistical association was found among positive nuclei and fiber types. Terf2 KO mice exhibit a higher percentage of Foxo3a‐positive nuclei (aged and muscle‐matched KO vs. WT, p < .05; Kruskal–Wallis multiple comparisons test; α = 0.05). * <.05; ** <.01; *** <.001

Similar articles

Cited by

  • RNA-Seq-based discovery of genetic variants and allele-specific expression of two layer lines and broiler chicken.
    Iqbal MA, Hadlich F, Reyer H, Oster M, Trakooljul N, Murani E, Perdomo-Sabogal A, Wimmers K, Ponsuksili S. Iqbal MA, et al. Evol Appl. 2023 May 22;16(6):1135-1153. doi: 10.1111/eva.13557. eCollection 2023 Jun. Evol Appl. 2023. PMID: 37360029 Free PMC article.
  • The non-telomeric evolutionary trajectory of TRF2 in zebrafish reveals its specific roles in neurodevelopment and aging.
    Ying Y, Hu X, Han P, Mendez-Bermudez A, Bauwens S, Eid R, Tan L, Pousse M, Giraud-Panis MJ, Lu Y, Gilson E, Ye J. Ying Y, et al. Nucleic Acids Res. 2022 Feb 28;50(4):2081-2095. doi: 10.1093/nar/gkac065. Nucleic Acids Res. 2022. PMID: 35150283 Free PMC article.
  • Biomarkers of aging.
    Aging Biomarker Consortium; Bao H, Cao J, Chen M, Chen M, Chen W, Chen X, Chen Y, Chen Y, Chen Y, Chen Z, Chhetri JK, Ding Y, Feng J, Guo J, Guo M, He C, Jia Y, Jiang H, Jing Y, Li D, Li J, Li J, Liang Q, Liang R, Liu F, Liu X, Liu Z, Luo OJ, Lv J, Ma J, Mao K, Nie J, Qiao X, Sun X, Tang X, Wang J, Wang Q, Wang S, Wang X, Wang Y, Wang Y, Wu R, Xia K, Xiao FH, Xu L, Xu Y, Yan H, Yang L, Yang R, Yang Y, Ying Y, Zhang L, Zhang W, Zhang W, Zhang X, Zhang Z, Zhou M, Zhou R, Zhu Q, Zhu Z, Cao F, Cao Z, Chan P, Chen C, Chen G, Chen HZ, Chen J, Ci W, Ding BS, Ding Q, Gao F, Han JJ, Huang K, Ju Z, Kong QP, Li J, Li J, Li X, Liu B, Liu F, Liu L, Liu Q, Liu Q, Liu X, Liu Y, Luo X, Ma S, Ma X, Mao Z, Nie J, Peng Y, Qu J, Ren J, Ren R, Song M, Songyang Z, Sun YE, Sun Y, Tian M, Wang S, Wang S, Wang X, Wang X, Wang YJ, Wang Y, Wong CCL, Xiang AP, Xiao Y, Xie Z, Xu D, Ye J, Yue R, Zhang C, Zhang H, Zhang L, Zhang W, Zhang Y, Zhang YW, Zhang Z, Zhao T, Zhao Y, Zhu D, Zou W, Pei G, Liu GH. Aging Biomarker Consortium, et al. Sci China Life Sci. 2023 May;66(5):893-1066. doi: 10.1007/s11427-023-2305-0. Epub 2023 Apr 11. Sci China Life Sci. 2023. PMID: 37076725 Free PMC article. Review.
  • TIN2 modulates FOXO1 mitochondrial shuttling to enhance oxidative stress-induced apoptosis in retinal pigment epithelium under hyperglycemia.
    Chen S, Sun D, Zhang S, Xu L, Wang N, Li H, Xu X, Wei F. Chen S, et al. Cell Death Differ. 2024 Nov;31(11):1487-1505. doi: 10.1038/s41418-024-01349-8. Epub 2024 Jul 30. Cell Death Differ. 2024. PMID: 39080375
  • Calorie restriction modulates the transcription of genes related to stress response and longevity in human muscle: The CALERIE study.
    Das JK, Banskota N, Candia J, Griswold ME, Orenduff M, de Cabo R, Corcoran DL, Das SK, De S, Huffman KM, Kraus VB, Kraus WE, Martin CK, Racette SB, Redman LM, Schilling B, Belsky DW, Ferrucci L. Das JK, et al. Aging Cell. 2023 Dec;22(12):e13963. doi: 10.1111/acel.13963. Epub 2023 Oct 12. Aging Cell. 2023. PMID: 37823711 Free PMC article. Clinical Trial.

References

    1. Aeby, E. , Ahmed, W. , Redon, S. , Simanis, V. , & Lingner, J. (2016). Peroxiredoxin 1 protects telomeres from oxidative damage and preserves telomeric DNA for extension by telomerase. Cell Reports, 17, 3107–3114. 10.1016/j.celrep.2016.11.071 - DOI - PubMed
    1. Ahmed, S. , Passos, J. F. , Birket, M. J. , Beckmann, T. , Brings, S. , Peters, H. , … Saretzki, G. (2008). Telomerase does not counteract telomere shortening but protects mitochondrial function under oxidative stress. Journal of Cell Science, 121, 1046–1053. - PubMed
    1. Ahmed, W. , & Lingner, J. (2018). PRDX1 and MTH1 cooperate to prevent ROS‐mediated inhibition of telomerase. Genes & Development, 32, 658–669. 10.1101/gad.313460.118 - DOI - PMC - PubMed
    1. Ahn, B. H. , Kim, H. S. , Song, S. , Lee, I. H. , Liu, J. , Vassilopoulos, A. , … Finkel, T. (2008). A role for the mitochondrial deacetylase Sirt3 in regulating energy homeostasis. Proceedings of the National Academy of Sciences, 105, 14447–14452. 10.1073/pnas.0803790105 - DOI - PMC - PubMed
    1. Albani, D. , Ateri, E. , Mazzuco, S. , Ghilardi, A. , Rodilossi, S. , Biella, G. , … Forloni, G. (2014). Modulation of human longevity by SIRT3 single nucleotide polymorphisms in the prospective study "Treviso Longeva (TRELONG)". Age, 36, 469–478. 10.1007/s11357-013-9559-2 - DOI - PMC - PubMed

Publication types

MeSH terms