Ovarian mitochondrial dynamics and cell fate regulation in an androgen-induced rat model of polycystic ovarian syndrome
- PMID: 31974436
- PMCID: PMC6978404
- DOI: 10.1038/s41598-020-57672-w
Ovarian mitochondrial dynamics and cell fate regulation in an androgen-induced rat model of polycystic ovarian syndrome
Abstract
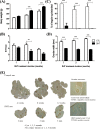
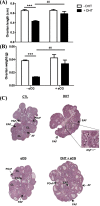
In this study, we investigated in an androgenized rat model the involvement of autophagy and mitochondrial dynamics in granulosa cells in the pathogenesis of polycystic ovarian syndrome (PCOS) and its modulation by exogenous gonadotropin (eCG). We found 5α-dihydrotestosterone (DHT) treatment reduces ovarian length and weight with predominantly late antral and/or preovulatory stage follicles and no corpora lutea. DHT increased the population of large lysosomes (>50 micron) and macroautophagy, an event associated with granulosa cell apoptosis. Increased granulosa cell Dynamin Related Protein 1 (Drp1) content in the DHT group was accompanied by increased circular and constricted, but reduced rod-shaped, mitochondria. eCG eliminated all atypical follicles and increased the number of late antral and preovulatory follicles with less granulosa cell apoptosis. eCG-treated rats had a higher proportion of connected mitochondria, and in combination with DHT had a lower proportion of circular and constricted mitochondria than rats treated with DHT alone, suggesting that eCG induces mitochondrial fusion and attenuates fission in granulosa cells. In summary, we observed that DHT-induced up-regulation of Drp1 is associated with excessive mitochondrial fission, macroautophagy and apoptosis in granulosa cells at the antral stage of development in an androgenized rat model for PCOS, a response partially attenuated by exogenous gonadotropin.
Conflict of interest statement
The authors declare no competing interests.
Figures


Similar articles
-
Chemerin suppresses ovarian follicular development and its potential involvement in follicular arrest in rats treated chronically with dihydrotestosterone.Endocrinology. 2013 Aug;154(8):2912-23. doi: 10.1210/en.2013-1001. Epub 2013 May 21. Endocrinology. 2013. PMID: 23696570
-
Polycystic ovary syndrome: possible involvement of androgen-induced, chemerin-mediated ovarian recruitment of monocytes/macrophages.Biol Reprod. 2018 Oct 1;99(4):838-852. doi: 10.1093/biolre/ioy096. Biol Reprod. 2018. PMID: 29688269 Free PMC article.
-
The effect of androgens on ovarian follicle maturation: Dihydrotestosterone suppress FSH-stimulated granulosa cell proliferation by upregulating PPARγ-dependent PTEN expression.Sci Rep. 2015 Dec 17;5:18319. doi: 10.1038/srep18319. Sci Rep. 2015. PMID: 26674985 Free PMC article.
-
Animal models for study of polycystic ovaries and ovarian atresia.Adv Exp Med Biol. 1987;219:237-57. doi: 10.1007/978-1-4684-5395-9_12. Adv Exp Med Biol. 1987. PMID: 2963503 Review.
-
Interactions between androgens, FSH, anti-Müllerian hormone and estradiol during folliculogenesis in the human normal and polycystic ovary.Hum Reprod Update. 2016 Nov;22(6):709-724. doi: 10.1093/humupd/dmw027. Epub 2016 Aug 27. Hum Reprod Update. 2016. PMID: 27566840 Review.
Cited by
-
Metabolic Syndrome and PCOS: Pathogenesis and the Role of Metabolites.Metabolites. 2021 Dec 14;11(12):869. doi: 10.3390/metabo11120869. Metabolites. 2021. PMID: 34940628 Free PMC article. Review.
-
Ficus deltoidea ameliorates biochemical, hormonal, and histomorphometric changes in letrozole-induced polycystic ovarian syndrome rats.BMC Complement Med Ther. 2021 Nov 29;21(1):291. doi: 10.1186/s12906-021-03452-6. BMC Complement Med Ther. 2021. PMID: 34844580 Free PMC article.
-
The role of androgen and its related signals in PCOS.J Cell Mol Med. 2021 Feb;25(4):1825-1837. doi: 10.1111/jcmm.16205. Epub 2020 Dec 23. J Cell Mol Med. 2021. PMID: 33369146 Free PMC article. Review.
-
The effect of adipose-derived mesenchymal stem cell transplantation on ovarian mitochondrial dysfunction in letrozole-induced polycystic ovary syndrome in rats: the role of PI3K-AKT signaling pathway.J Ovarian Res. 2024 Apr 27;17(1):91. doi: 10.1186/s13048-024-01422-3. J Ovarian Res. 2024. PMID: 38678269 Free PMC article.
-
The role of FDX1 in granulosa cell of Polycystic ovary syndrome (PCOS).BMC Endocr Disord. 2021 Jun 15;21(1):119. doi: 10.1186/s12902-021-00775-w. BMC Endocr Disord. 2021. PMID: 34130686 Free PMC article.
References
Publication types
MeSH terms
Substances
Grants and funding
LinkOut - more resources
Full Text Sources
Medical
Research Materials
Miscellaneous

